Calgary Absorption Rate
What is really happening in the Calgary Real Estate Market?
Stay ahead of everyone else by following our Monthly Market Snapshot of the Calgary Real Estate Market This shows what’s really happening! The market is driven by supply and demand so here we show the inventory (supply) and sales (demand) and most importantly the relationship between the two and how it affects the price of Calgary Real Estate. A simple way to keep up to date with how the market is trending and to stay ahead of most! All numbers are taken from the Calgary Real Estate Boards Stats package for Realtors. I have also included some general comments which are simply my opinion.
Absorption Rate (Months of Inventory) (the inventory divided by the number of sales in the last month). What does this mean you might ask?
| Buyer’s Market | >4.0 | Drives prices down |
| Balanced Market | Between 2.4 to 4.0 | Prices typically remain stable |
| Seller’s Market | <2.4 | Drives prices up |
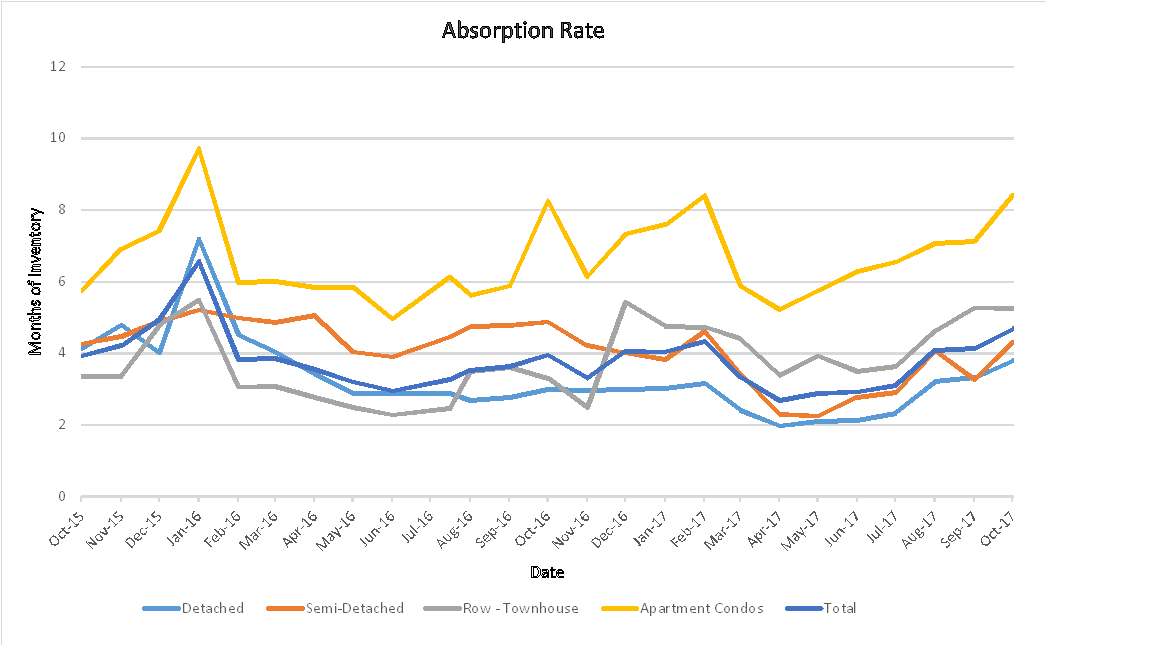
Absorption Rate
The Absorption rate for September increased in all categories except attached-row homes where it dropped marginally. The one to note is apartment condos which increased by 1.29 putting us at 8.42 months of inventory.
| Aug 2017 | Sept 2017 | Change | |
| Detached | 3.32 | 3.79 | 0.46 |
| Semi Detached | 3.27 | 4.31 | 1.04 |
| Attached – Row | 5.27 | 5.25 | -0.02 |
| Apartment | 7.13 | 8.42 | 1.29 |
| Total City | 4.13 | 4.69 | 0.56 |
Calgary Listing Inventory
In September all categories stayed flat except for detached homes which saw an increase of 199 listings.
| Inventory | Aug 2017 | Sept 2017 | Change |
| Detached | 3280 | 3479 | 199 |
| Semi Detached | 585 | 621 | 36 |
| Attached – Row | 991 | 993 | 2 |
| Apartment | 1769 | 1768 | -1 |
| Total City | 6624 | 6861 | 237 |
Calgary Sales:
Sales for September saw a decrease in all categories except attached-row homes which increased by 1. A decrease at this time of year is fairly normal and I would classify this as simply seasonal.
Of interest Calgary year to date sales are 7% above last year’s sales.
| Calgary Sales | Aug 2017 | Sept 2017 | Change | % Change |
| Detached | 987 | 919 | -68 | -6.89% |
| Semi Detached | 179 | 144 | -35 | -19.55% |
| Attached – Row | 188 | 189 | 1 | 0.53% |
| Apartment | 248 | 210 | -38 | -15.32% |
| Total City | 1602 | 1462 | -140 | -8.74% |
Calgary Real Estate Sales Prices:
Okay, I will eat my words here. Last month I predicted that prices would remain fairly even except for attached – row houses and apartment condos which I said should drop. As you can see below I was wrong however with the absorption rates I again will predict all categories will remain fairly flat with the exception of apartment condos where a decrease is likely.
| Sales Prices | Aug 2017Benchmark Price | Sept 2017 Benchmark Price | Change |
| Detached | 510,900 | 508,900 | -2,000 |
| Semi Detached | 419,600 | 419,400 | -200 |
| Attached – Row | 307,000 | 306,900 | -100 |
| Apartment | 263,300 | 263,700 | 400 |
| Total City | 442,300 | 441,500 | -800 |
Sales Prices “Year to Date”
| Sales Prices | Jan 1, 2017 Benchmark Price | Sept 2017 Benchmark Price | Change
$ |
% Change |
| Detached | 498,700 | 508,900 | 10,200 | 2.05% |
| Semi Detached | 406,800 | 419,400 | 12,600 | 3.10% |
| Attached – Row | 302,600 | 306,900 | 4,300 | 1.42% |
| Apartment | 265,000 | 263,700 | -1,300 | -0.49% |
| Total City | 433,400 | 441,500 | 8,100 | 1.87% |
**Please note that these numbers include only Calgary homes and do change on a community basis and more so for towns. This report does not include rural properties. If you would like to find stats on your community just let me know. If you have any questions about this summary or Real Estate questions please feel free to contact us.
TSW Real Estate Group
Tags: Calgary Real Estate Market Snapshot, calgary real estate prices, House Prices calgary