What is really happening in the Calgary Real Estate Market?
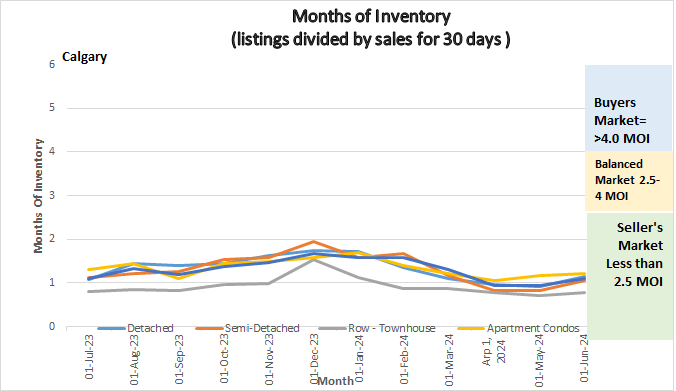
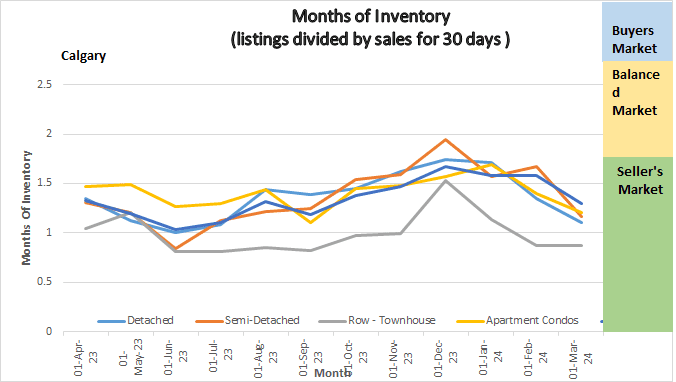
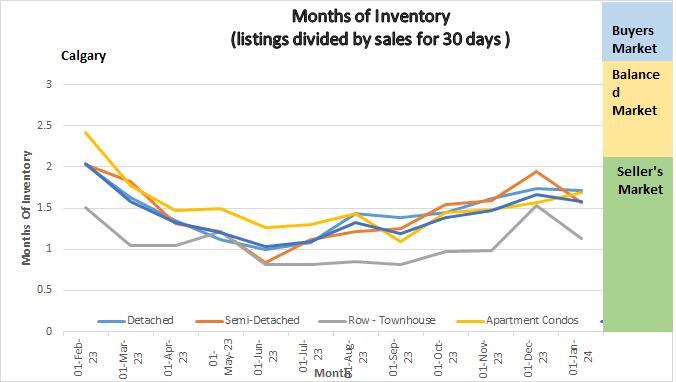
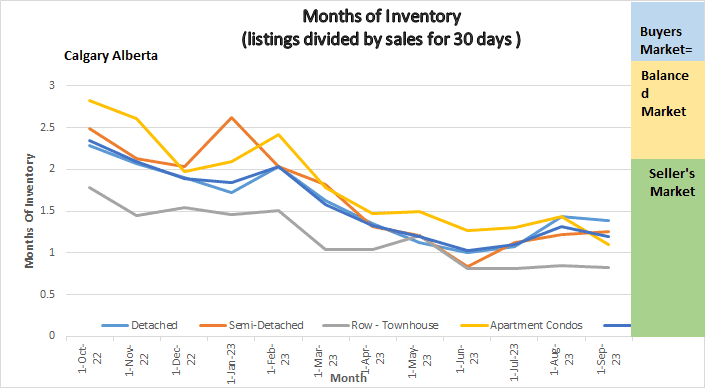
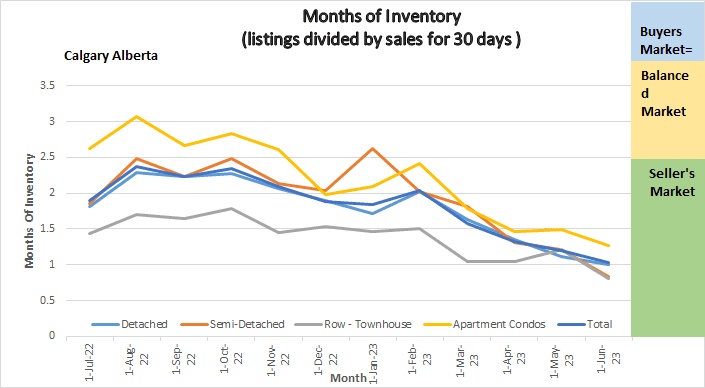
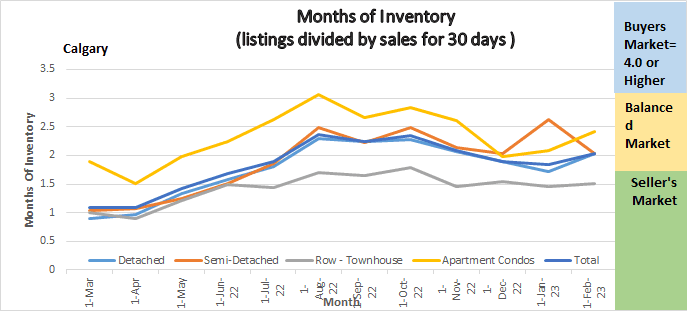
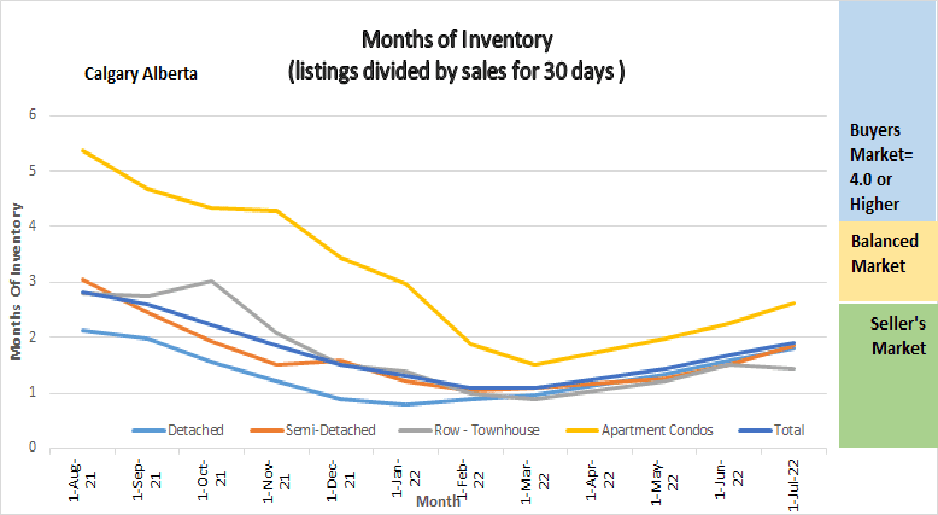
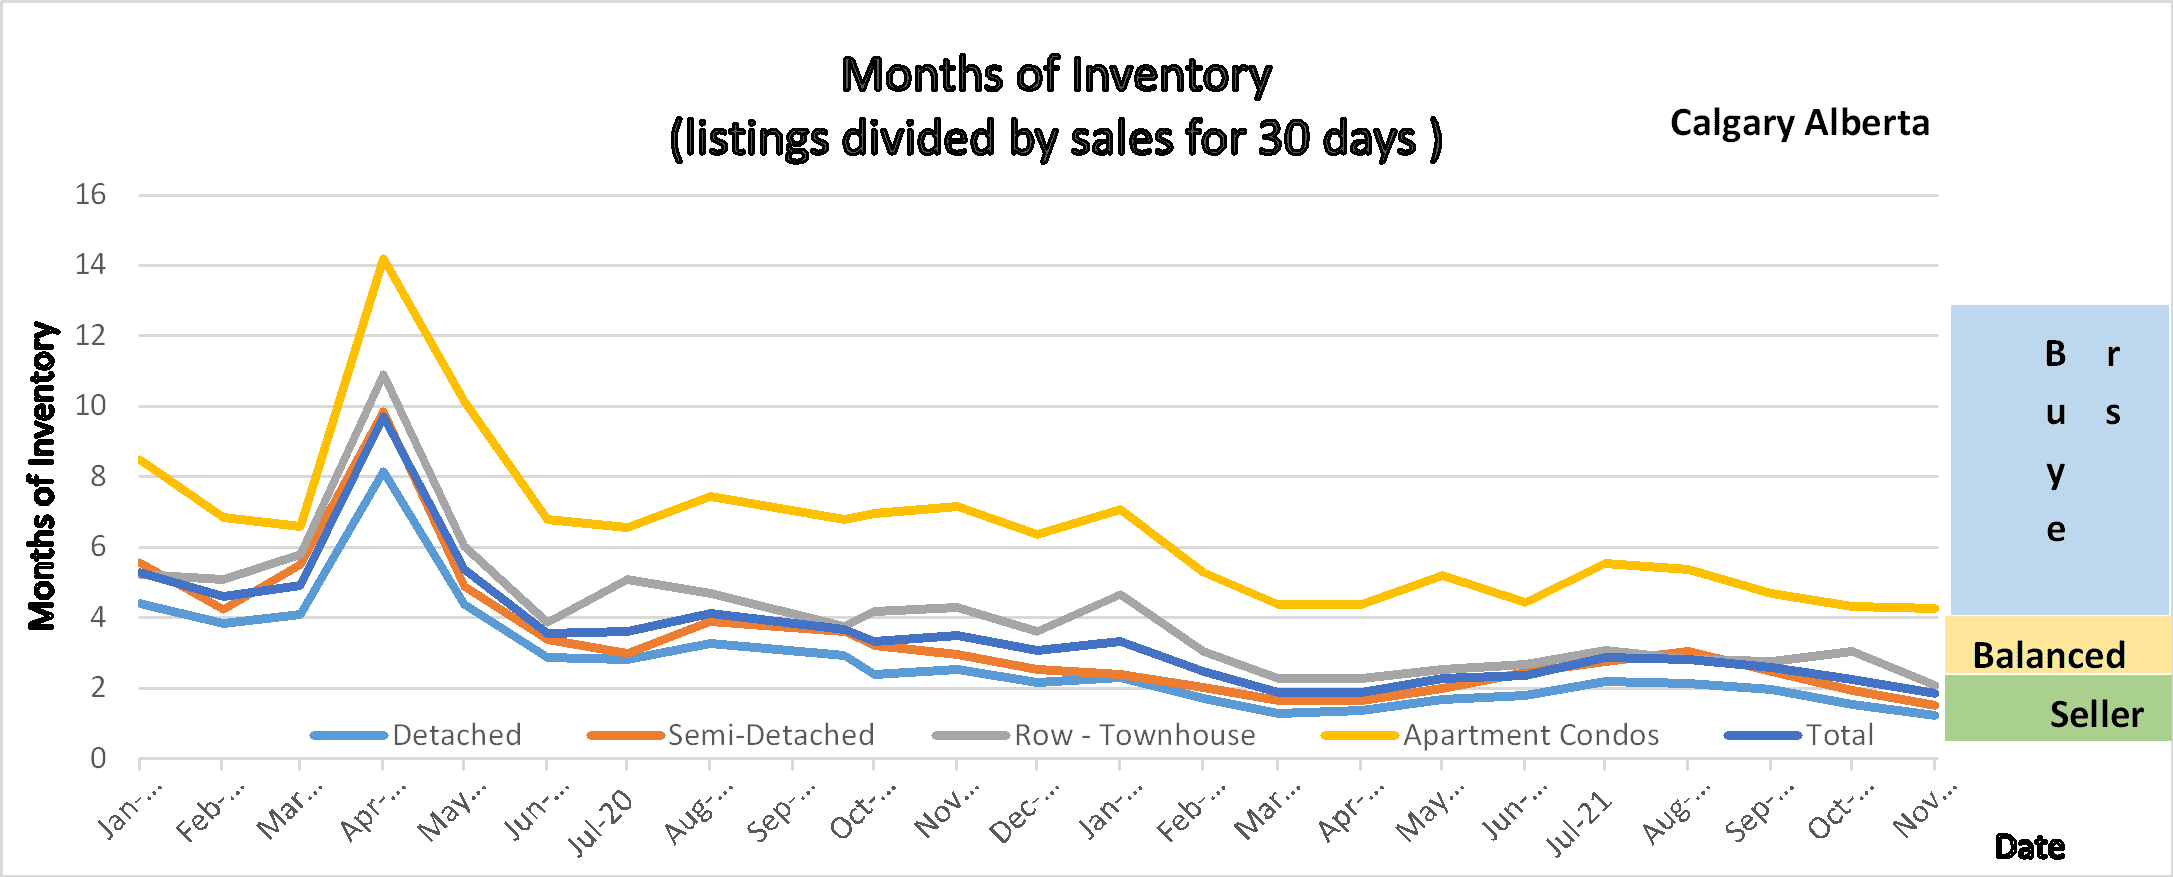
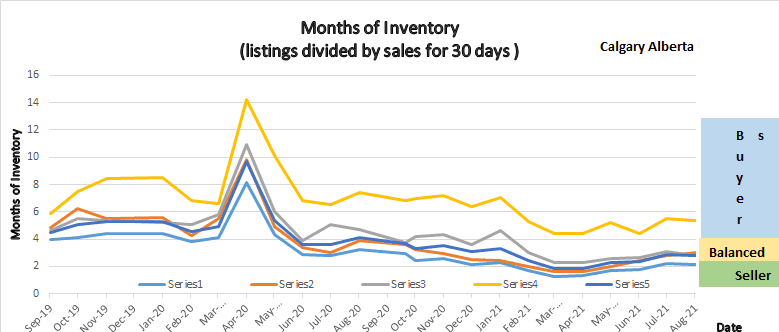
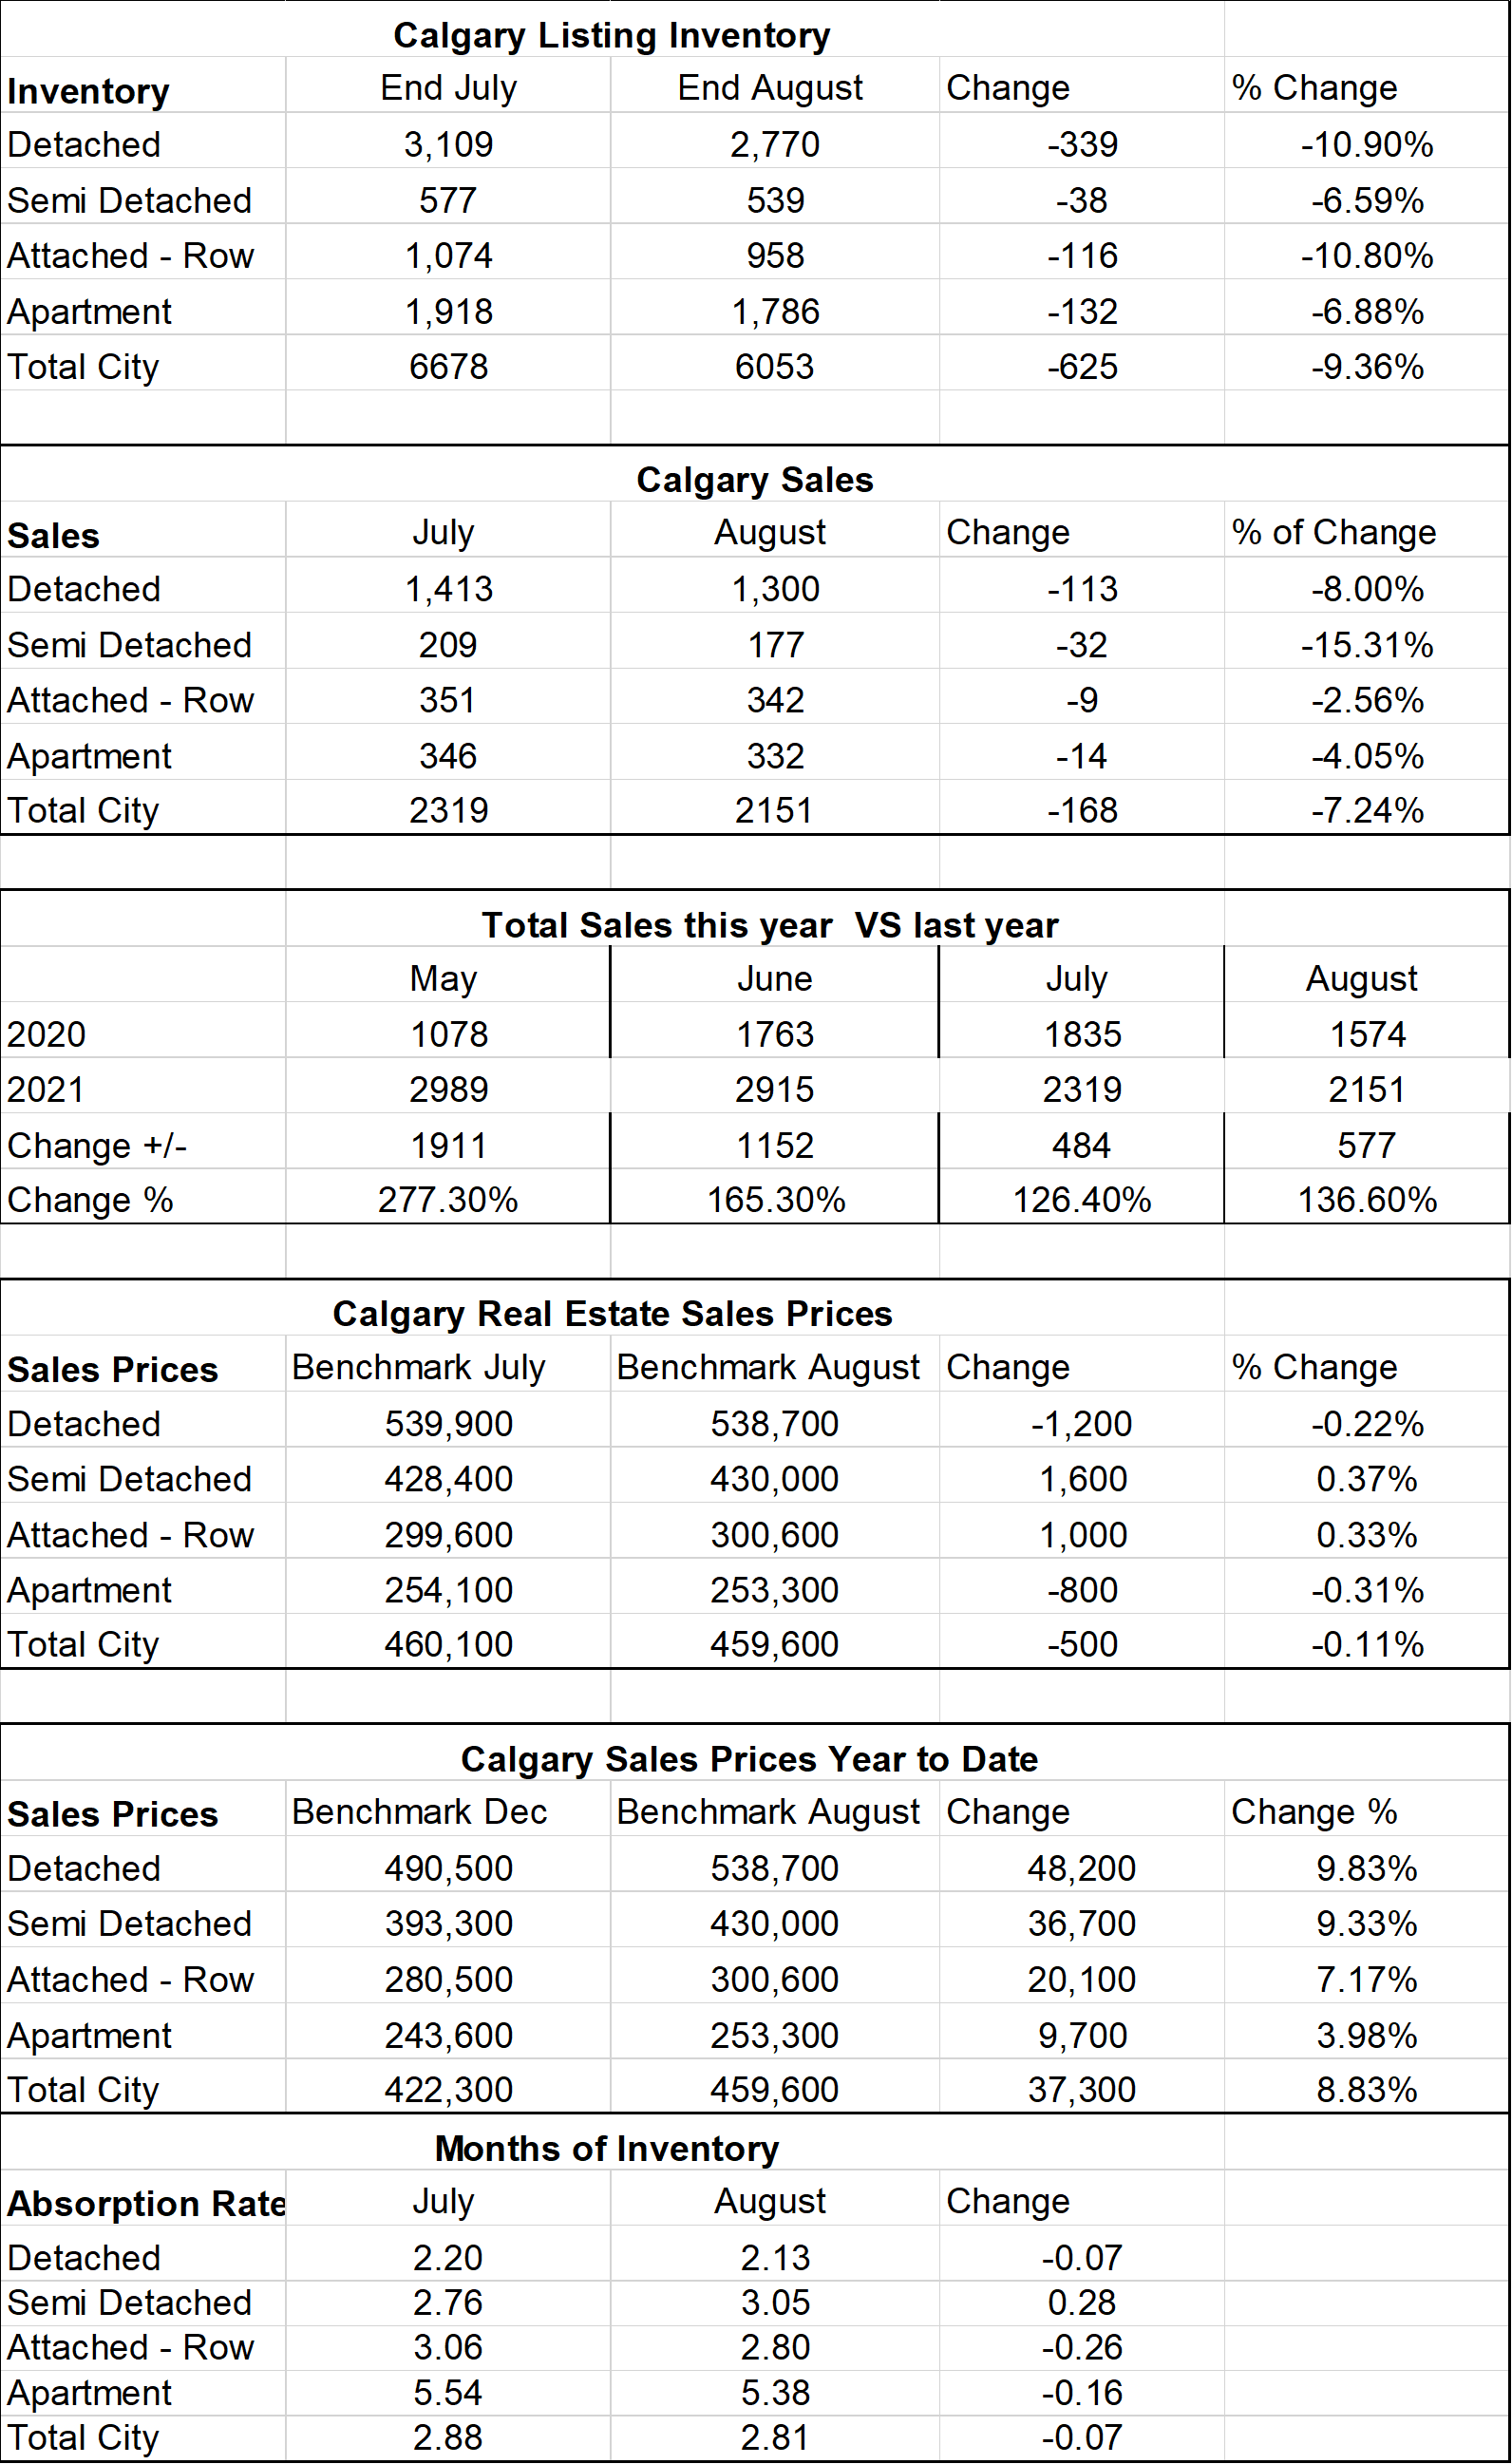
The following graph shows the months of inventory for each housing sector. Looking at a one-year trendline gives you an indication of where things are really heading.
Graph showing Months of Inventory for Calgary Real Estate Market
Gord’s commentary for the month (just my opinion).
Sept 1, 2025, Highlights
The month of inventory rises again.
Inventory is down in all Sectors.
Prices are creeping down from last years highs.
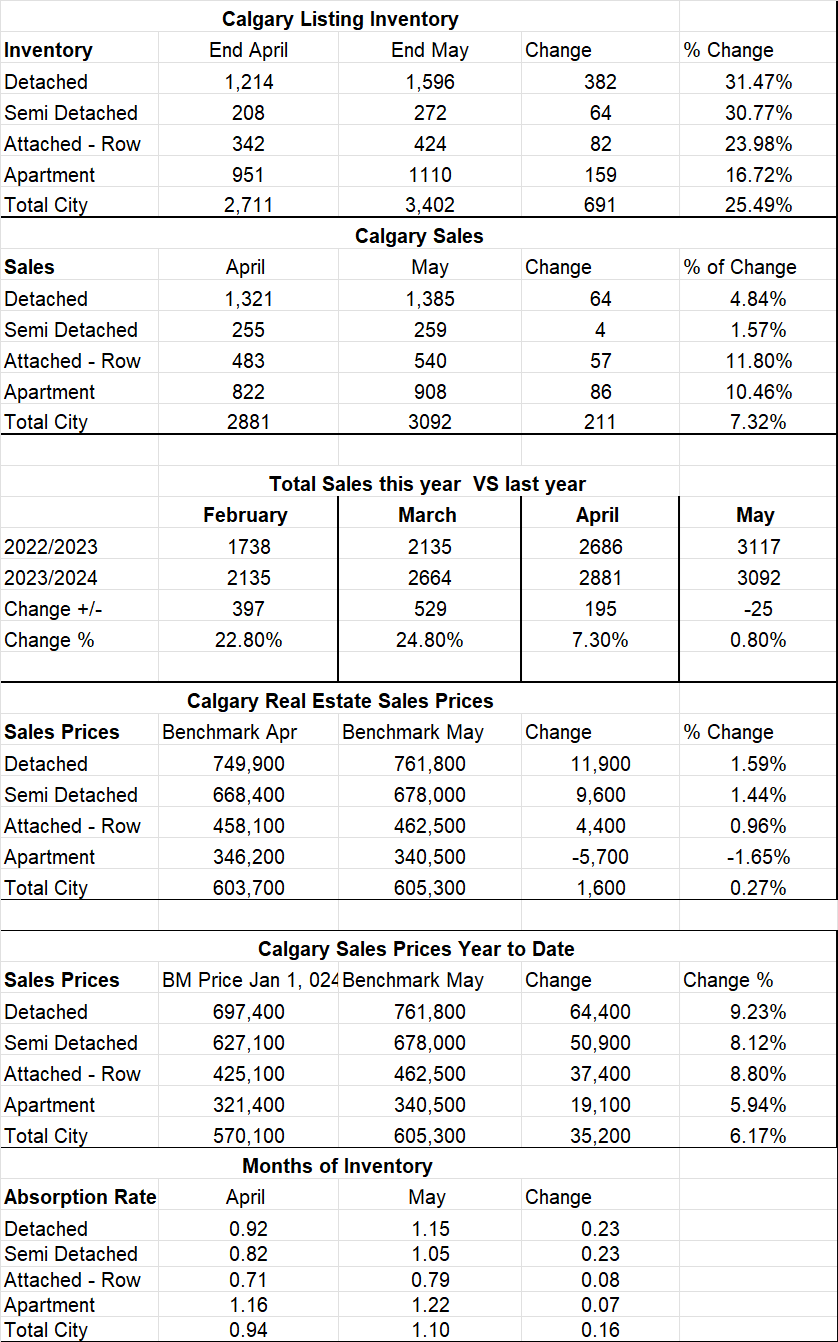
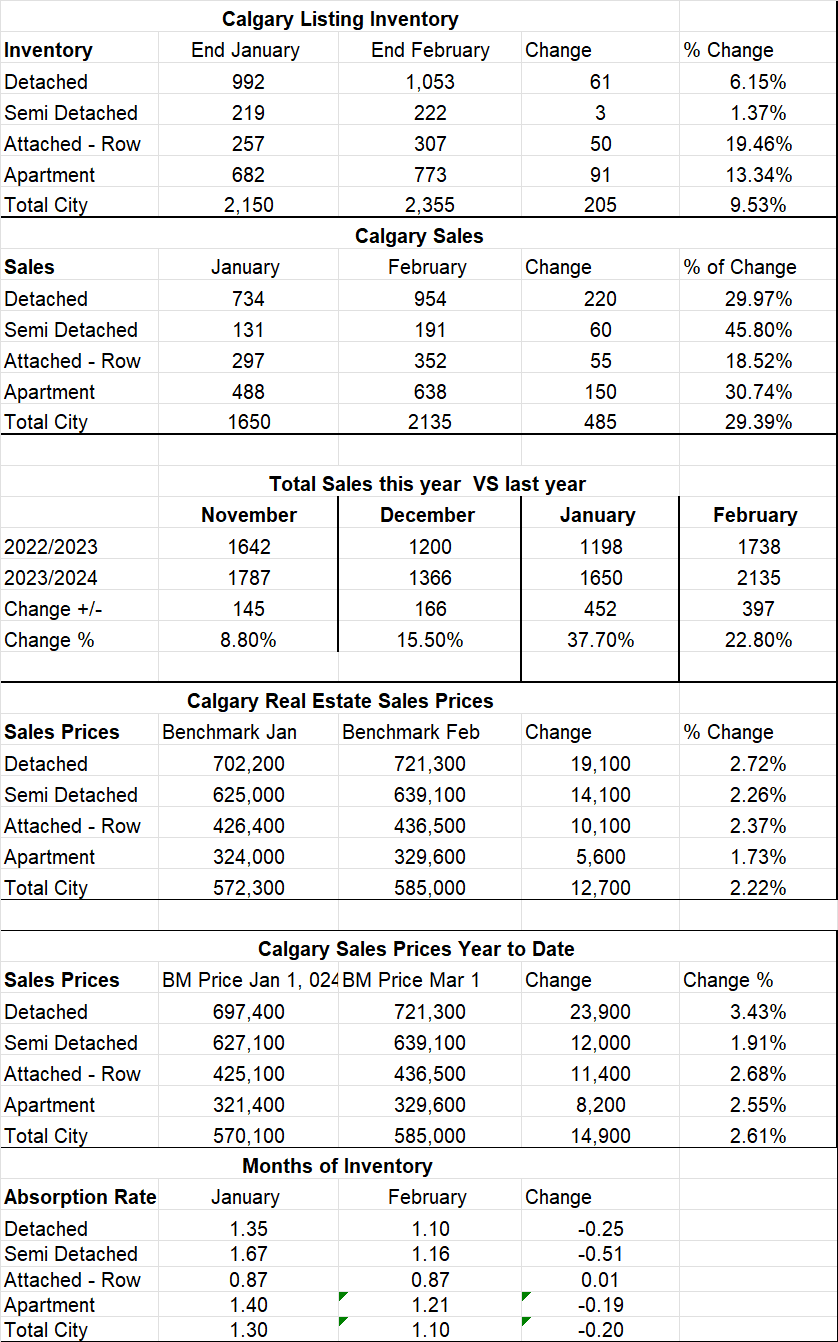
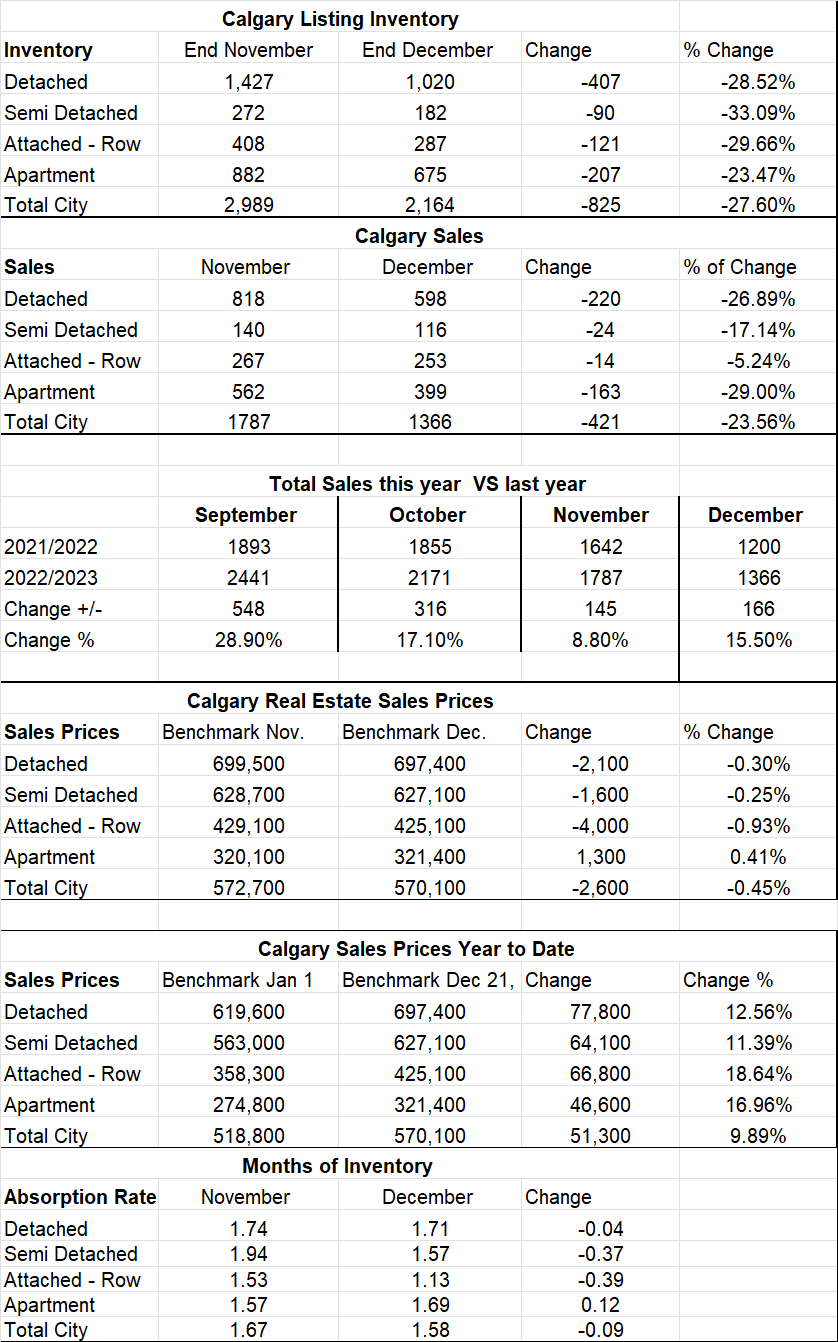
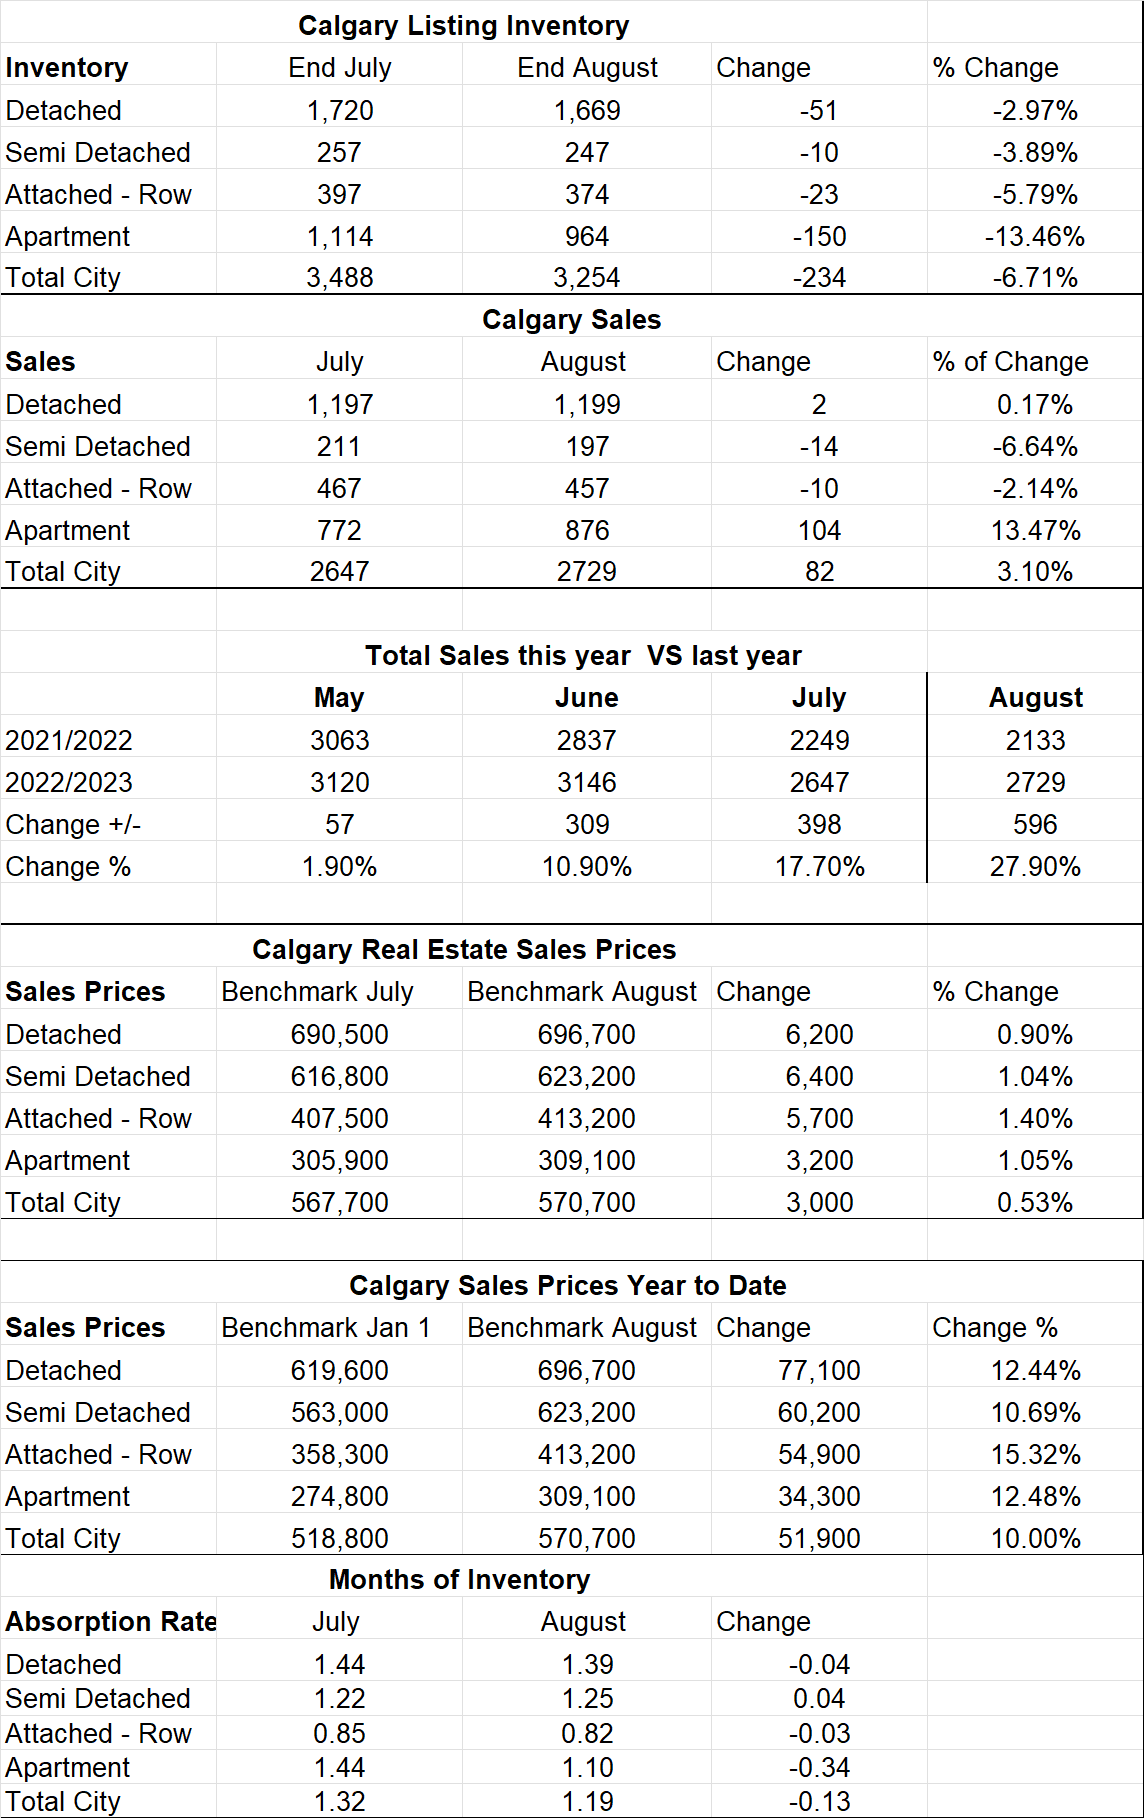
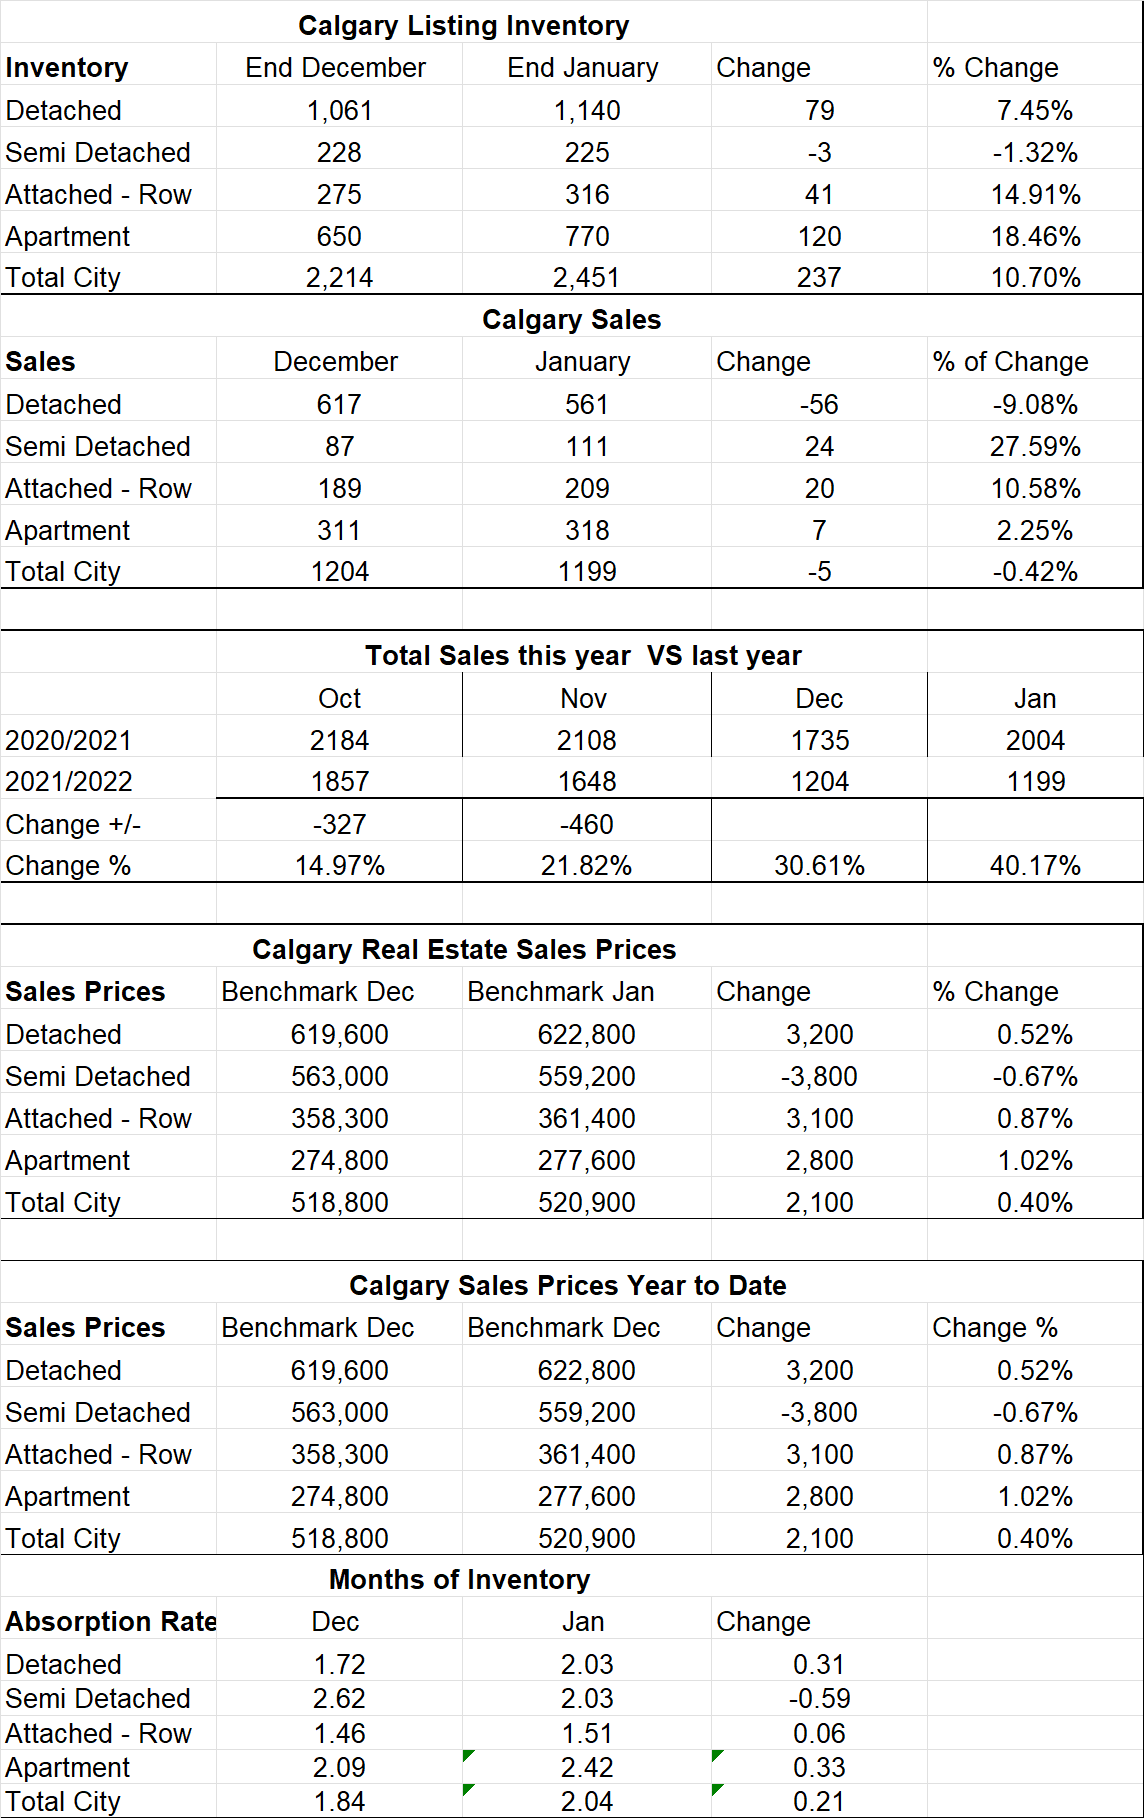
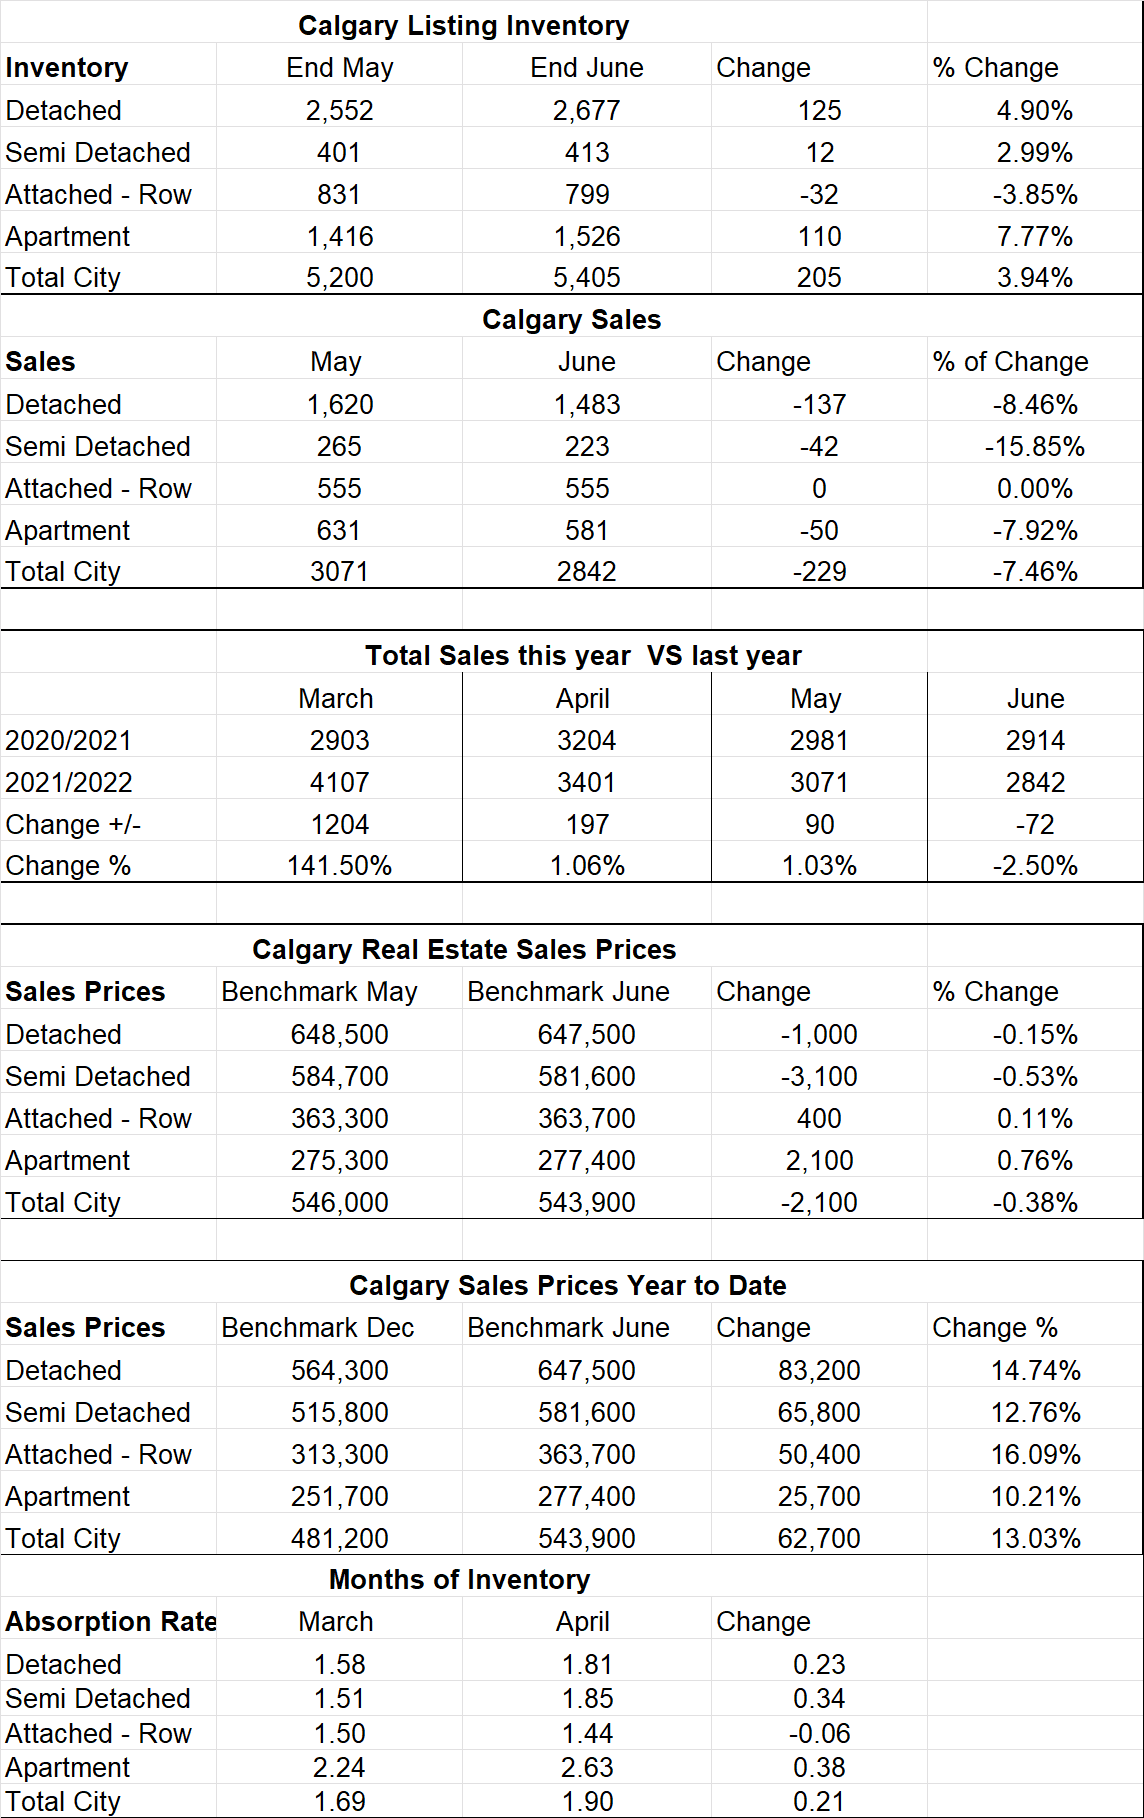
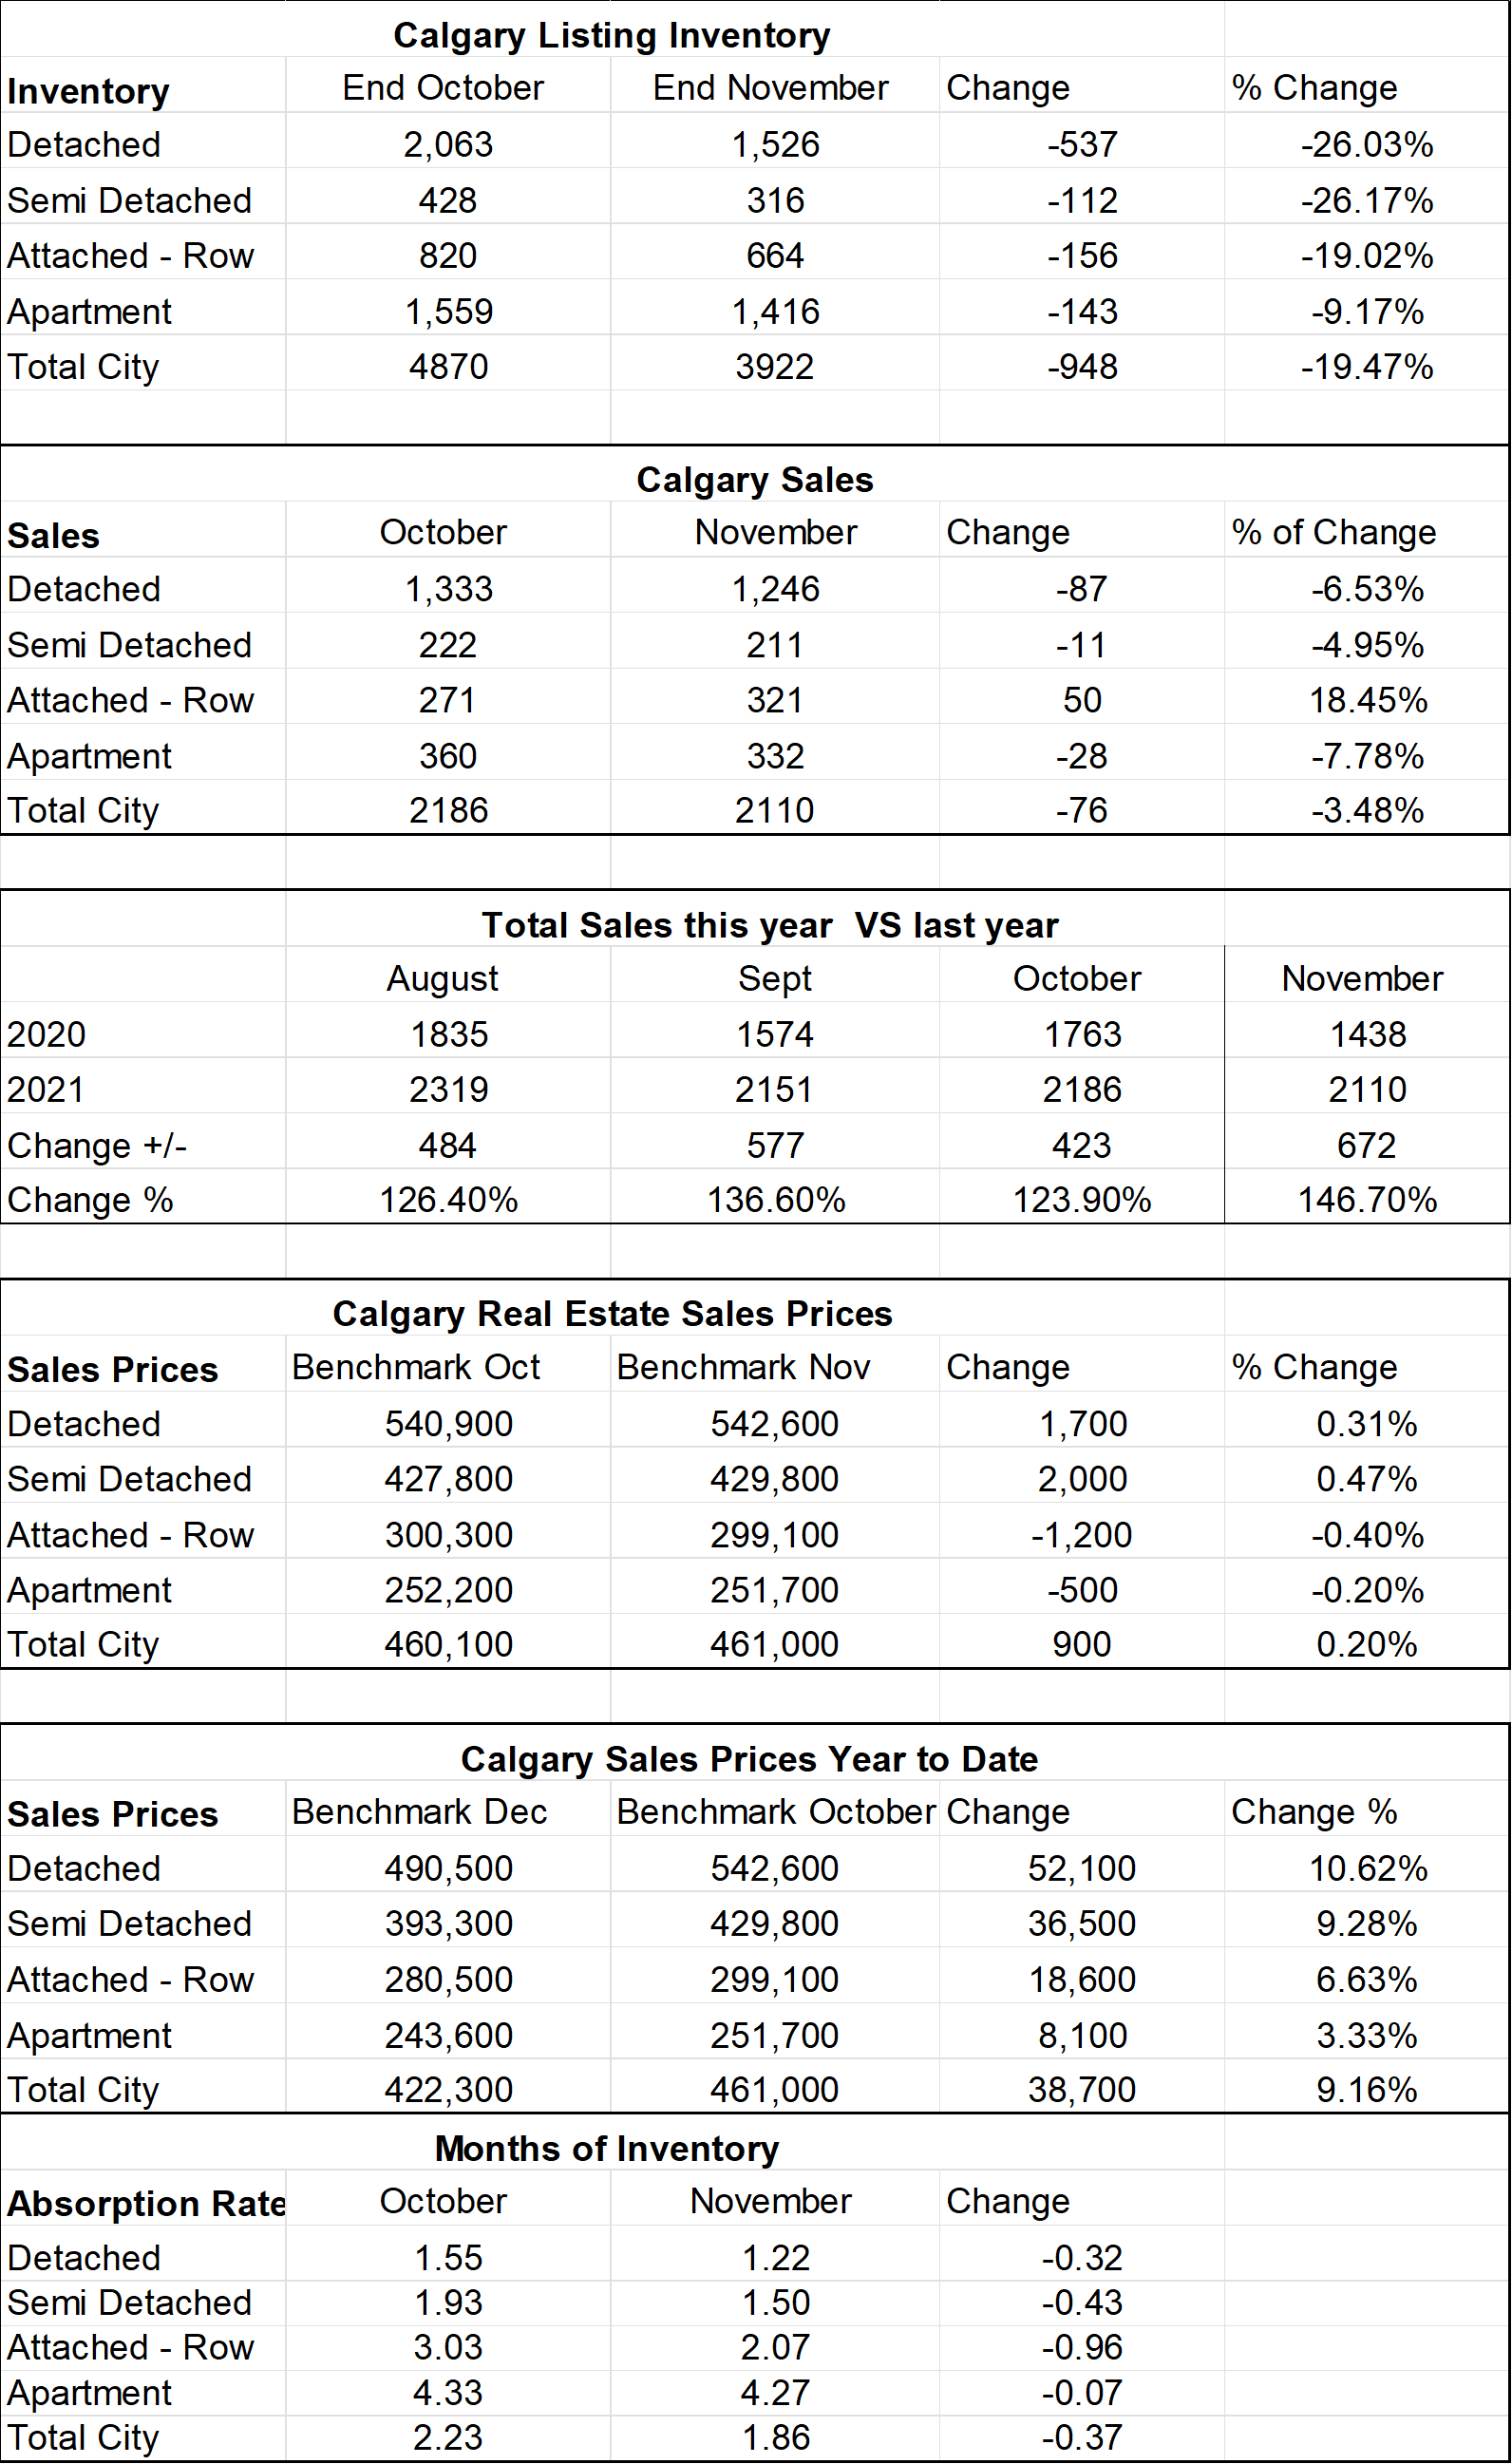
Calgary Listing Inventory
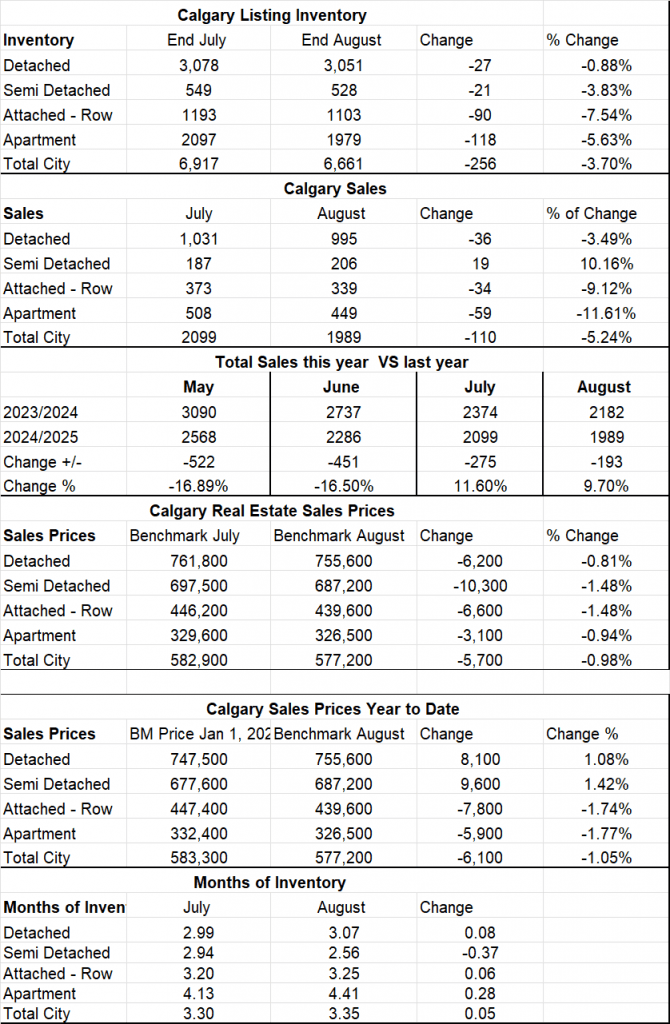
For the month of August our Inventory decreased in all sectors. A decreasing inventory in August is quite typical at this time of year as less people want to list their home at the end of the summer. The trend of decreasing inventory is to be expected until the start of 2026.
Calgary Sales
August reported 1,989 sales, nearly nine per cent lower than last year. Sales have slowed compared to the elevated levels reported over the past four years. However, activity is still above long-term trends, reflecting relatively strong demand.
Sales Compared to 2024:
Compared to July of 2024 our sales were down 193 or 9.7%. While this drop seems significant, it is because last year was an abnormally high month/year of sales. We are still trending above long-term averages in sales showing a relatively strong market.
| March | April | May | June | July | August | |
| 2024 | 2658 | 2876 | 3090 | 2374 | 2374 | 2182 |
| 2025 | 2159 | 2236 | 2568 | 2286 | 2099 | 1989 |
| Change | -499 | -640 | -522 | 88 | -275 | -193 |
| % Change | -18.88 | -22.25% | -16.89 | -.04 | -11.6% | -9.7% |
Calgary Real Estate Benchmark Sales Prices:
The overall Benchmark price for August was down by $5,700 or .98% The main cause of this is our increased supply level giving buyers more choices. This decrease was seen across all sectors.
Current Months of Inventory (Absorption Rate):
The months of inventory increased by only .05% however we saw a large loss of .37 in the Semi-Detached sector while all the other sectors increased. As you can see from my graph at the top the Apartment Condo sector continues to trend the highest.
My Prediction for what is ahead:
In the short term (3-6 months), I believe, based on our trend is that we will continue to see our months of Inventory increase slightly every month which will put the entire market into a more balanced territory with prices decreasing slightly. What is interesting is when you look at specific communities some are up, and some are down. It is also interesting to note that while the only sector showing to be in a buyer’s market is the Apartment Condo sector but buyers in all sectors are acting like we a in a full-blown buyer’s market.
* All numbers vary by community and price ranges, if you would like stats specifically for your neighbourhood, please contact us.
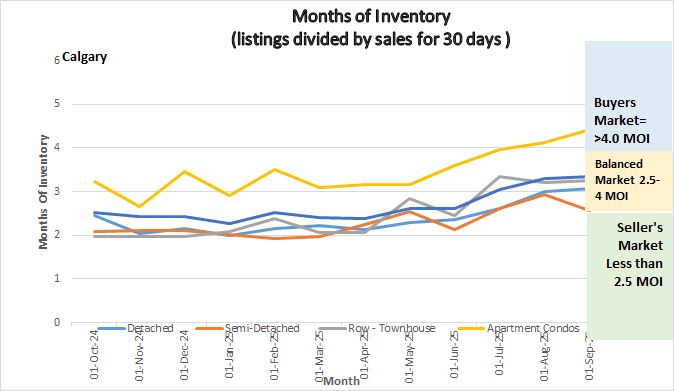
See Calgary Real Estate Stats Below:
A Summary of the Calgary Real Estate Board Realtors Stats