What is really happening in the Calgary Real Estate Market?
Another month of record sales and sharp price increases!

Real Estate Prices Rising
Following is a graph that shows the months of inventory for each housing sector. Looking at a one-year trendline gives you an indication of where things are really heading.
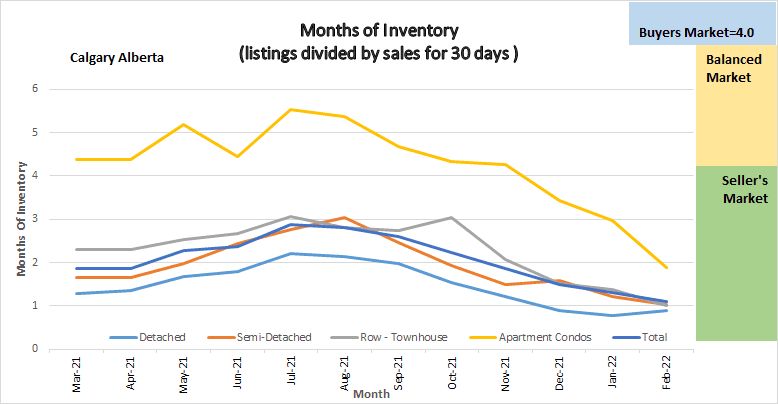
This graph shows the one year trend of months of Inventory in all sectors of the Calgary Real Estate Market
Gord’s commentary for the month (just my opinion).
2022 Highlights
- All Sectors of the Calgary Real Estate Market are in a deep seller’s market position
- Prices are going up, quickly
- We are running extremely low on Inventory
- Although new listings were 63% higher than last year total inventory only increased by 973.
- All homes no matter what style are either going into multiple offers or are selling in a week.
Calgary Listing Inventory
Listing inventory Increased in all sectors by a total of 980 more listings at the end of February compared to the end of January.
Calgary Sales:
February sales are the highest on record for a February. Sales increased in all sectors anywhere from 49.25% to 65.94% increase over January sales.
Sales Compared to 2021: This puts things into Perspective
Calgary home sales for February were 1474 higher than last February, an increase of 180.5%
| Jan | Feb | Mar | Apr | May | June | July | |
| 2021 | 1207 | 1831 | |||||
| 2022 | 2009 | 3305 | |||||
| Change | + 802 | 1474 | |||||
| % Change | + 66.4% | +180.5% |
Last years numbers
| Aug | Sept | Oct | Nov | Dec | Year to Date | |
| 2020 | 1574 | 1702 | 1763 | 1438 | 1199 | 16,149 |
| 2021 | 2151 | 2162 | 2186 | 2110 | 1737 | 27,686 |
| Change | +577 | +456 | + 423 | +672 | +538 | 11,537 |
| % Change | 136.6% | 126.7% | 123.9% | 146.7% | 144.9% | 171.4% |
Calgary Real Estate Benchmark Sales Prices:
The benchmark price for all sectors increased in February.
Detached home sector increased by $36,600 or 6.54%
Semi-detached increased by $21,500 or 4.89%
Attached Row increased by $15,500 or7.0%
Apartment Condos decreased by $5,900 or 7.65%
It is a long time since I have seen price changes so high in a month.
Calgary Real Estate Benchmark Year to Date Sales Price: See chart below.
Same Stats below
Current Months of Inventory (Absorption Rate):
The Months of inventory decreased in all sectors except Detached homes this month which increased by only .11. As you can see in my chart above our months of inventory keeps decreasing in all sectors putting us into a deep seller’s market position.
What might 2022 bring: (again just my opinion)
We are now very deep into a seller’s market. As inventory increases (which typically happens in Mar to may) I believe the market will softer but, in the meantime, I believe we will see more substantial price increases. Many people are asking me why this is all happening, and I have some thoughts:
- Since 2015 sales have been low compared to the 10 year average so there is pent up demand
- Alberta’s economy is showing signs of improvement
- There are a huge number of people moving here from Vancouver and Ontario
- There are now investors from Vancouver and Toronto buying up anything they can get their hands on.
It is also important to note that these numbers vary by community, and by price range. If you would like numbers for your community, or more specific numbers for your home please contact us.
Below is a summary of numbers in chart form. All numbers are taken from the Calgary Real Estate Boards monthly Stats package.
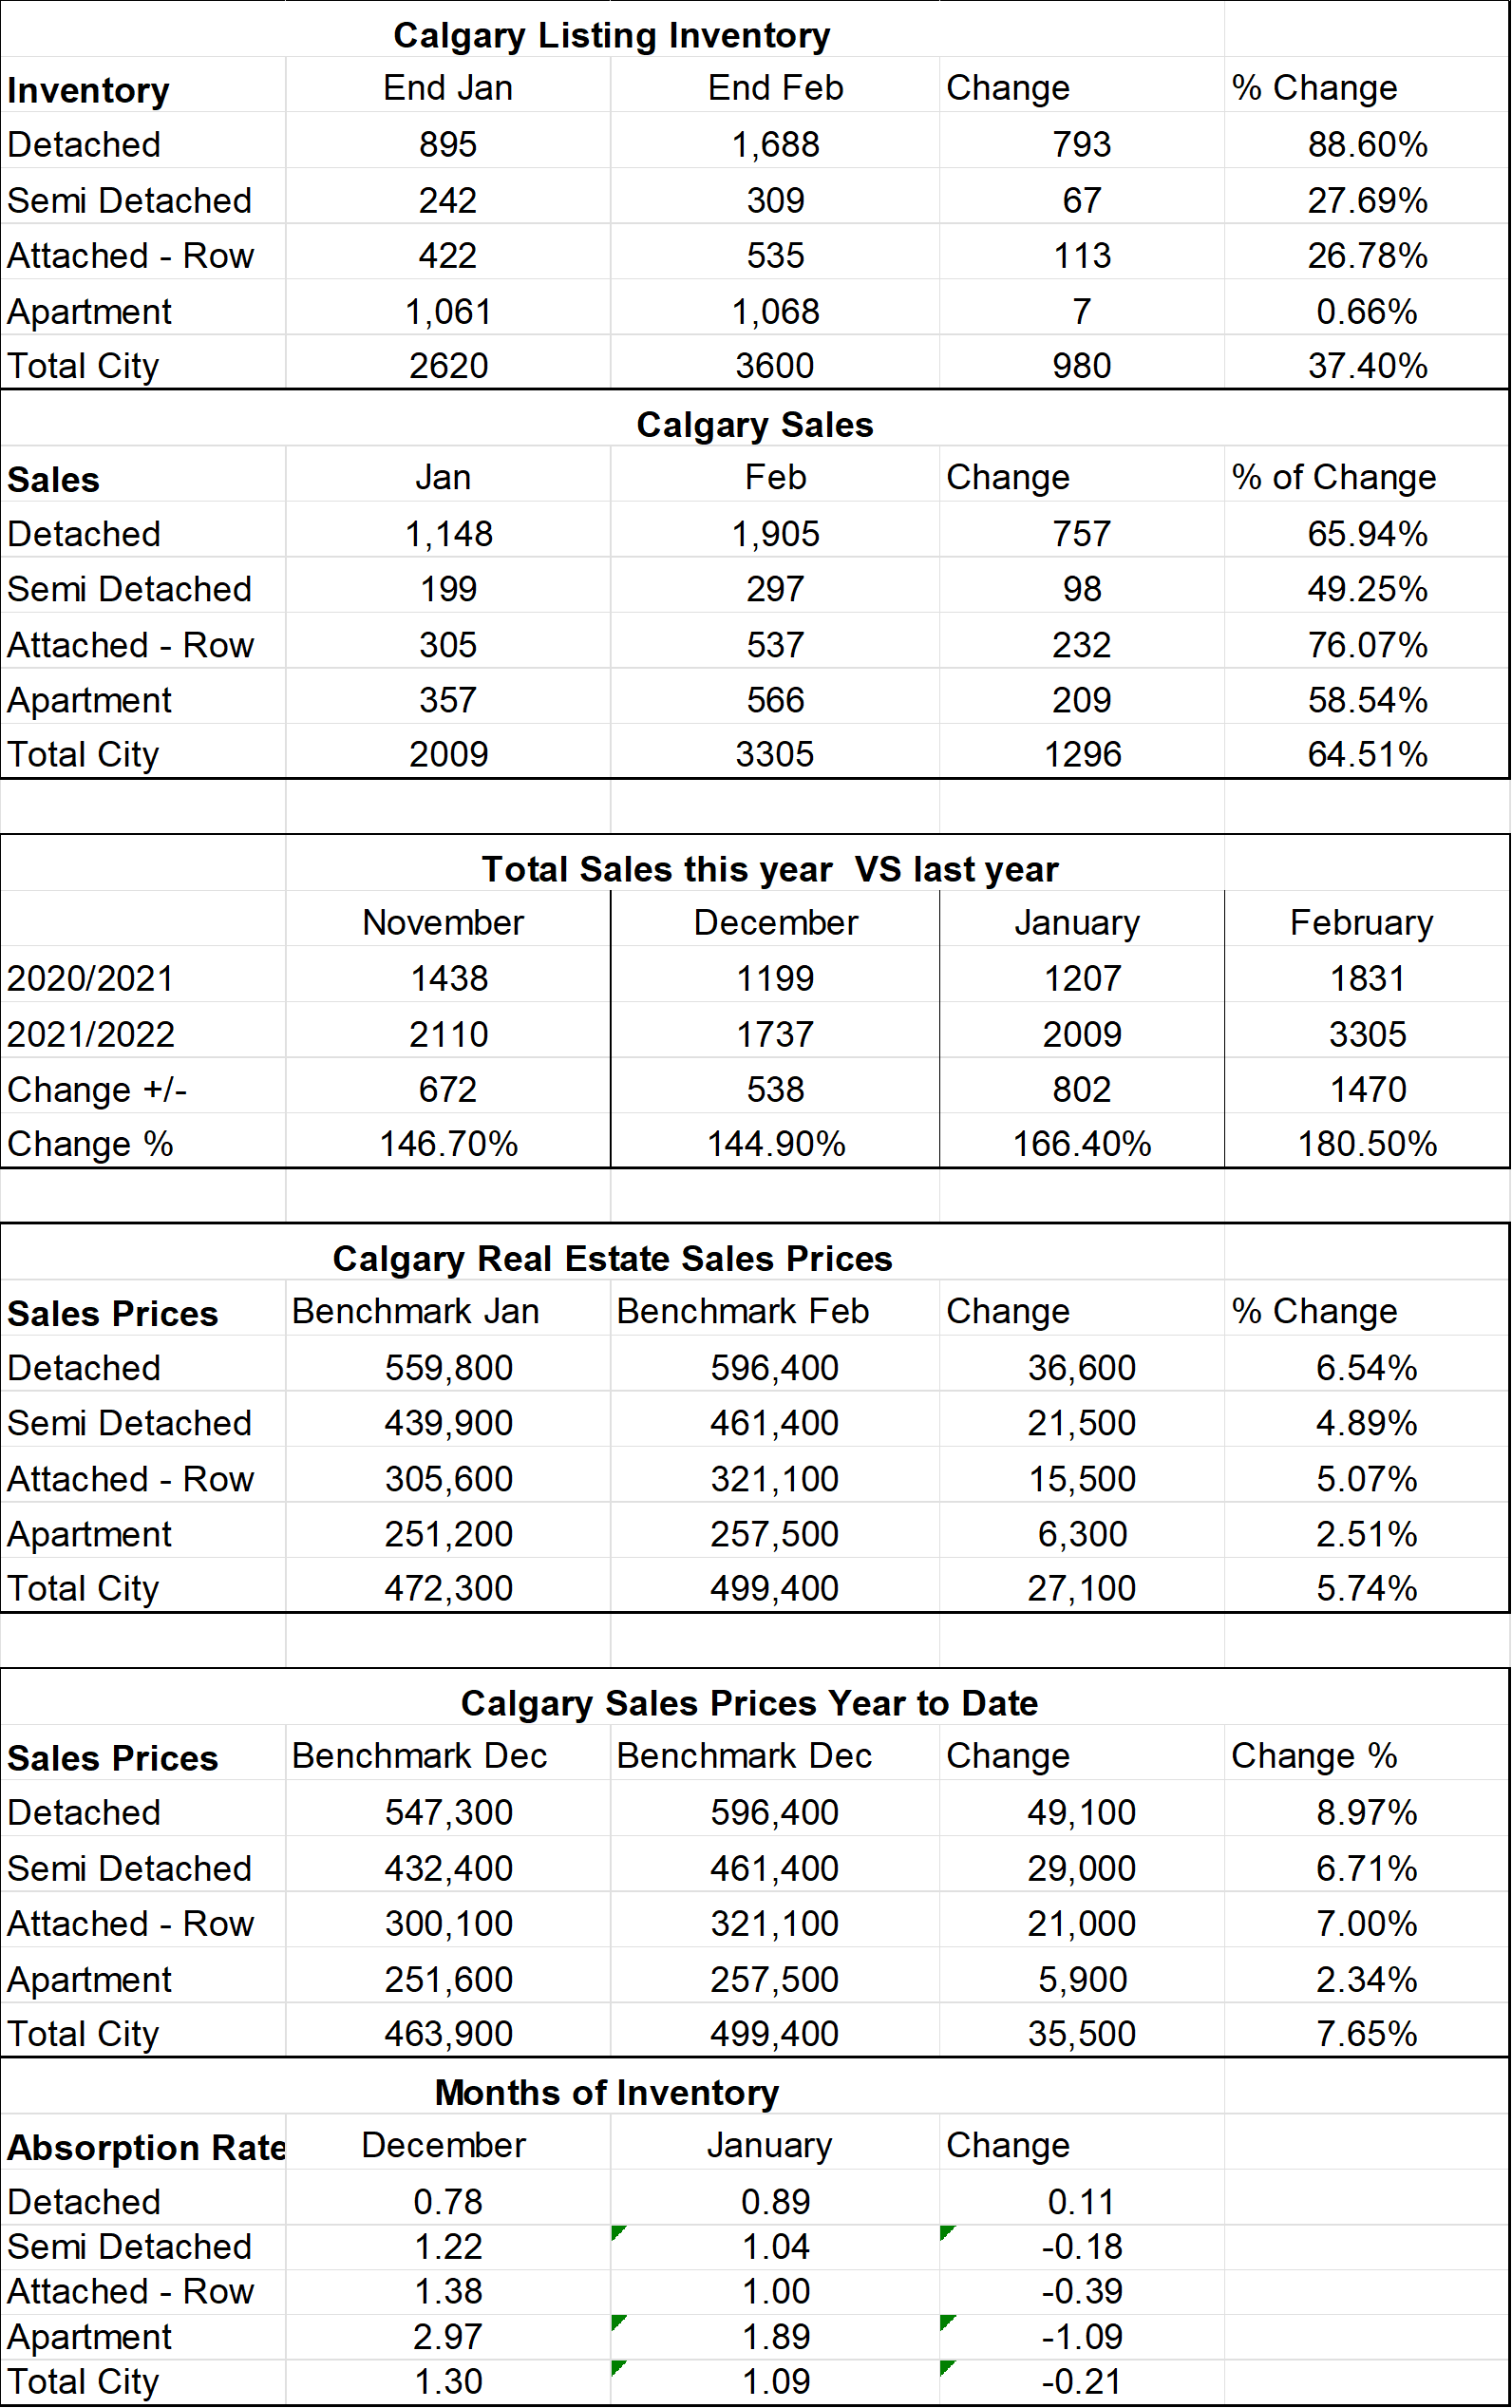
These stats are taken from the Calgary Real Estate Boards Stats Package for March 1, 2022. You will see only the critical numbers of Inventory, Sales, Prices and months of Inventory.
Tags: Calgary Condo Market, Calgary Condo Prices, Calgary Housing Market, Calgary Housing Prices, Calgary Real Estate Market snapshot March 1