What is really happening in the Calgary Real Estate Market?
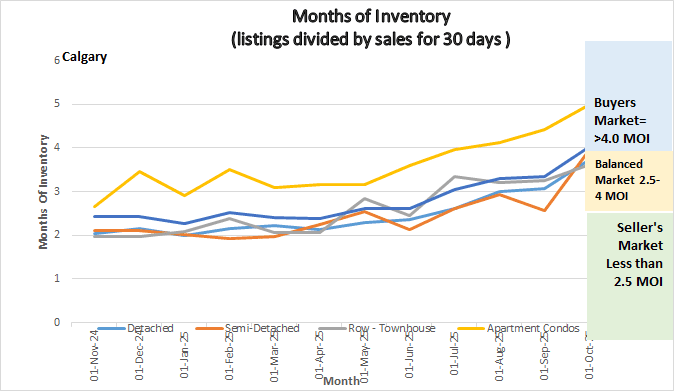
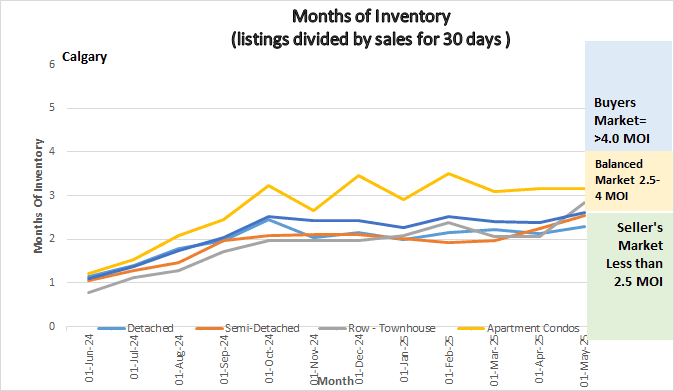
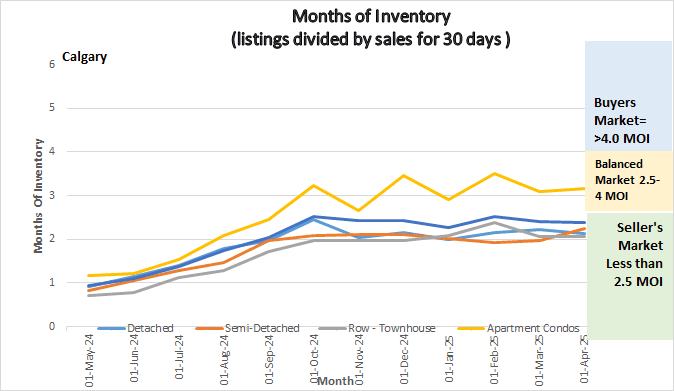
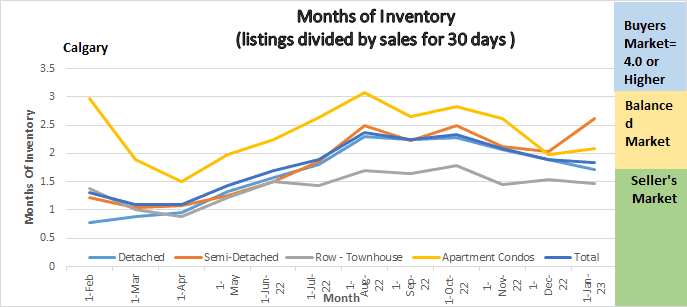
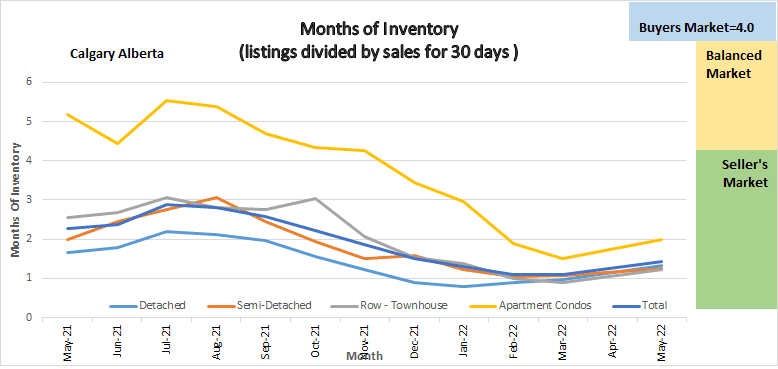
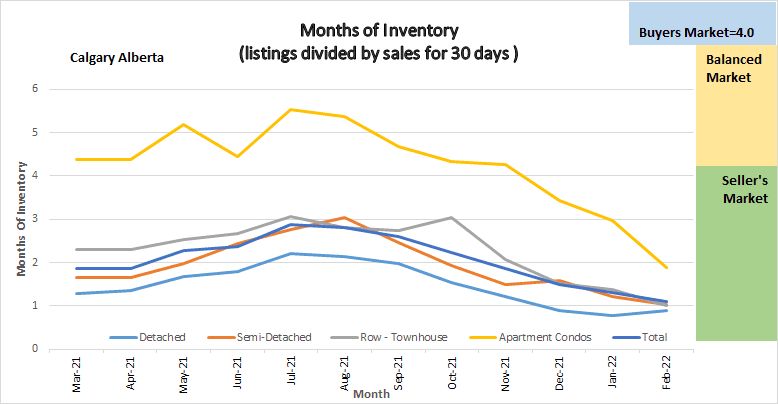
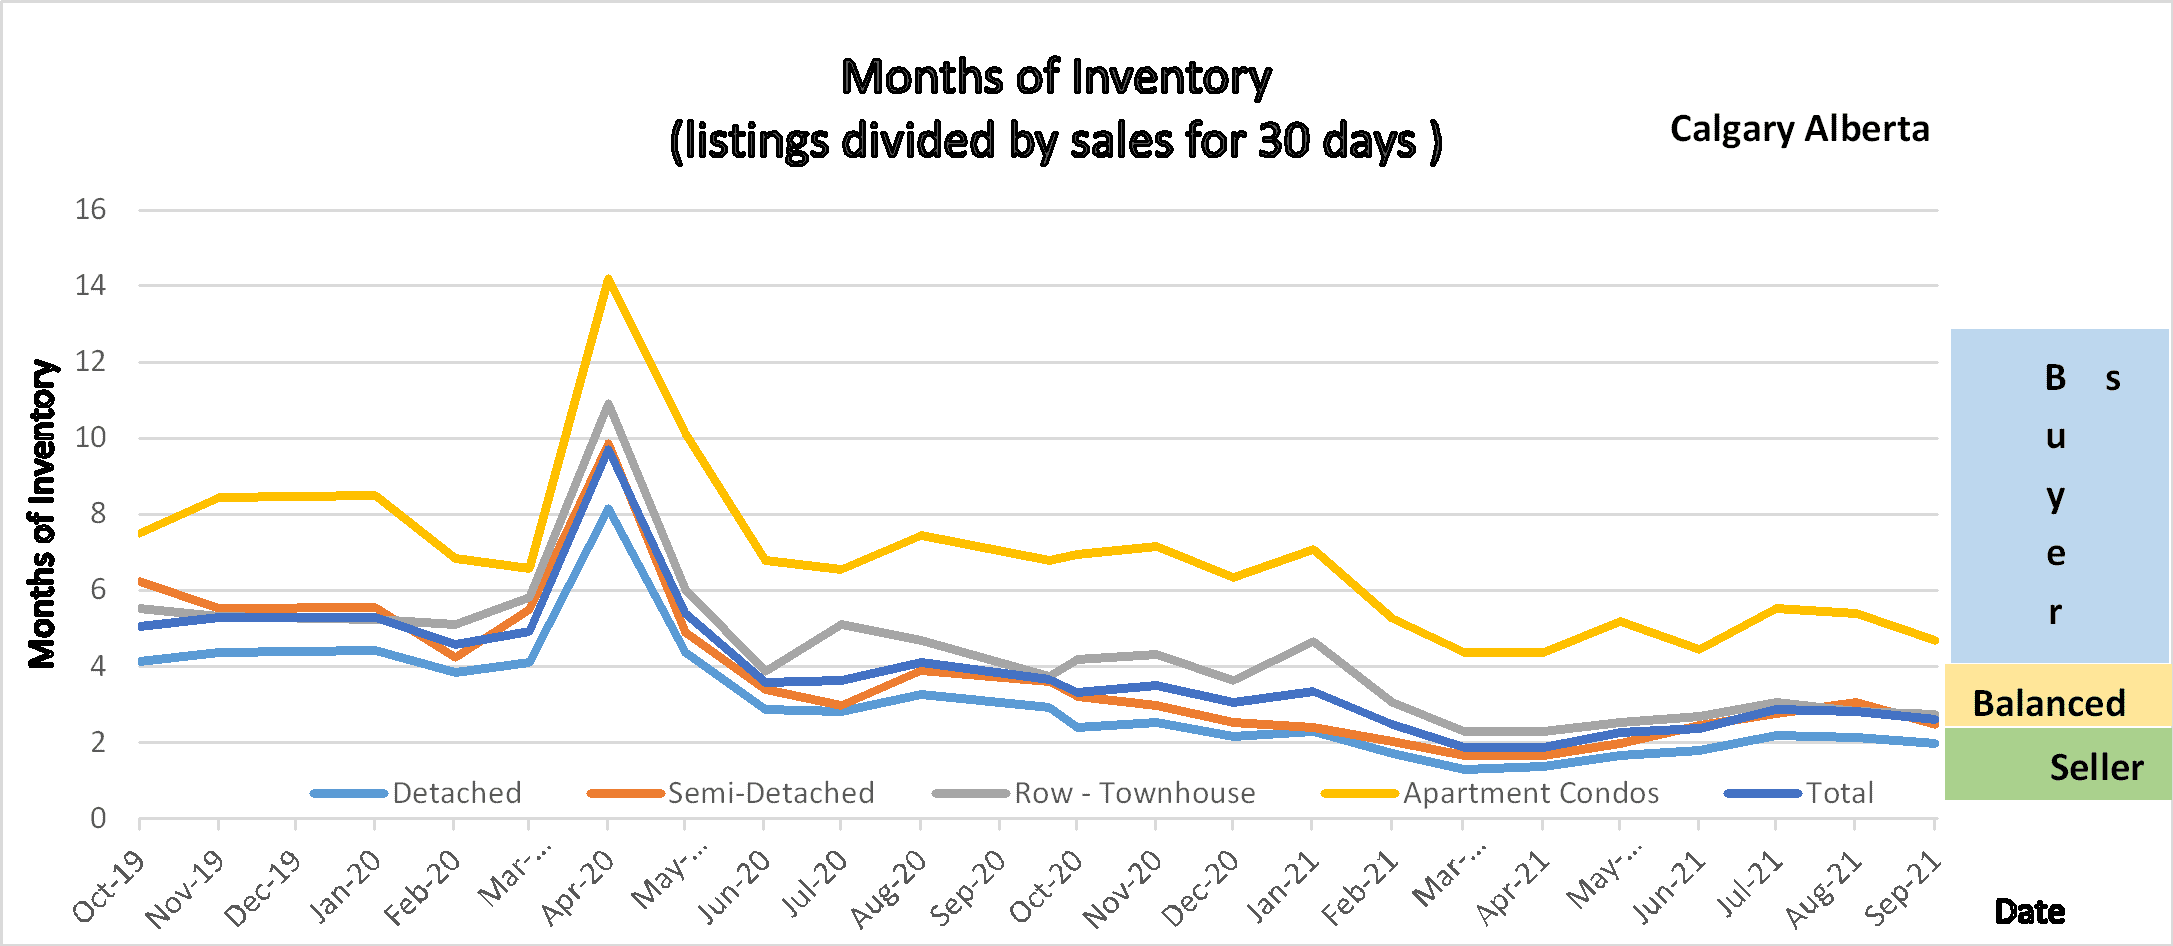
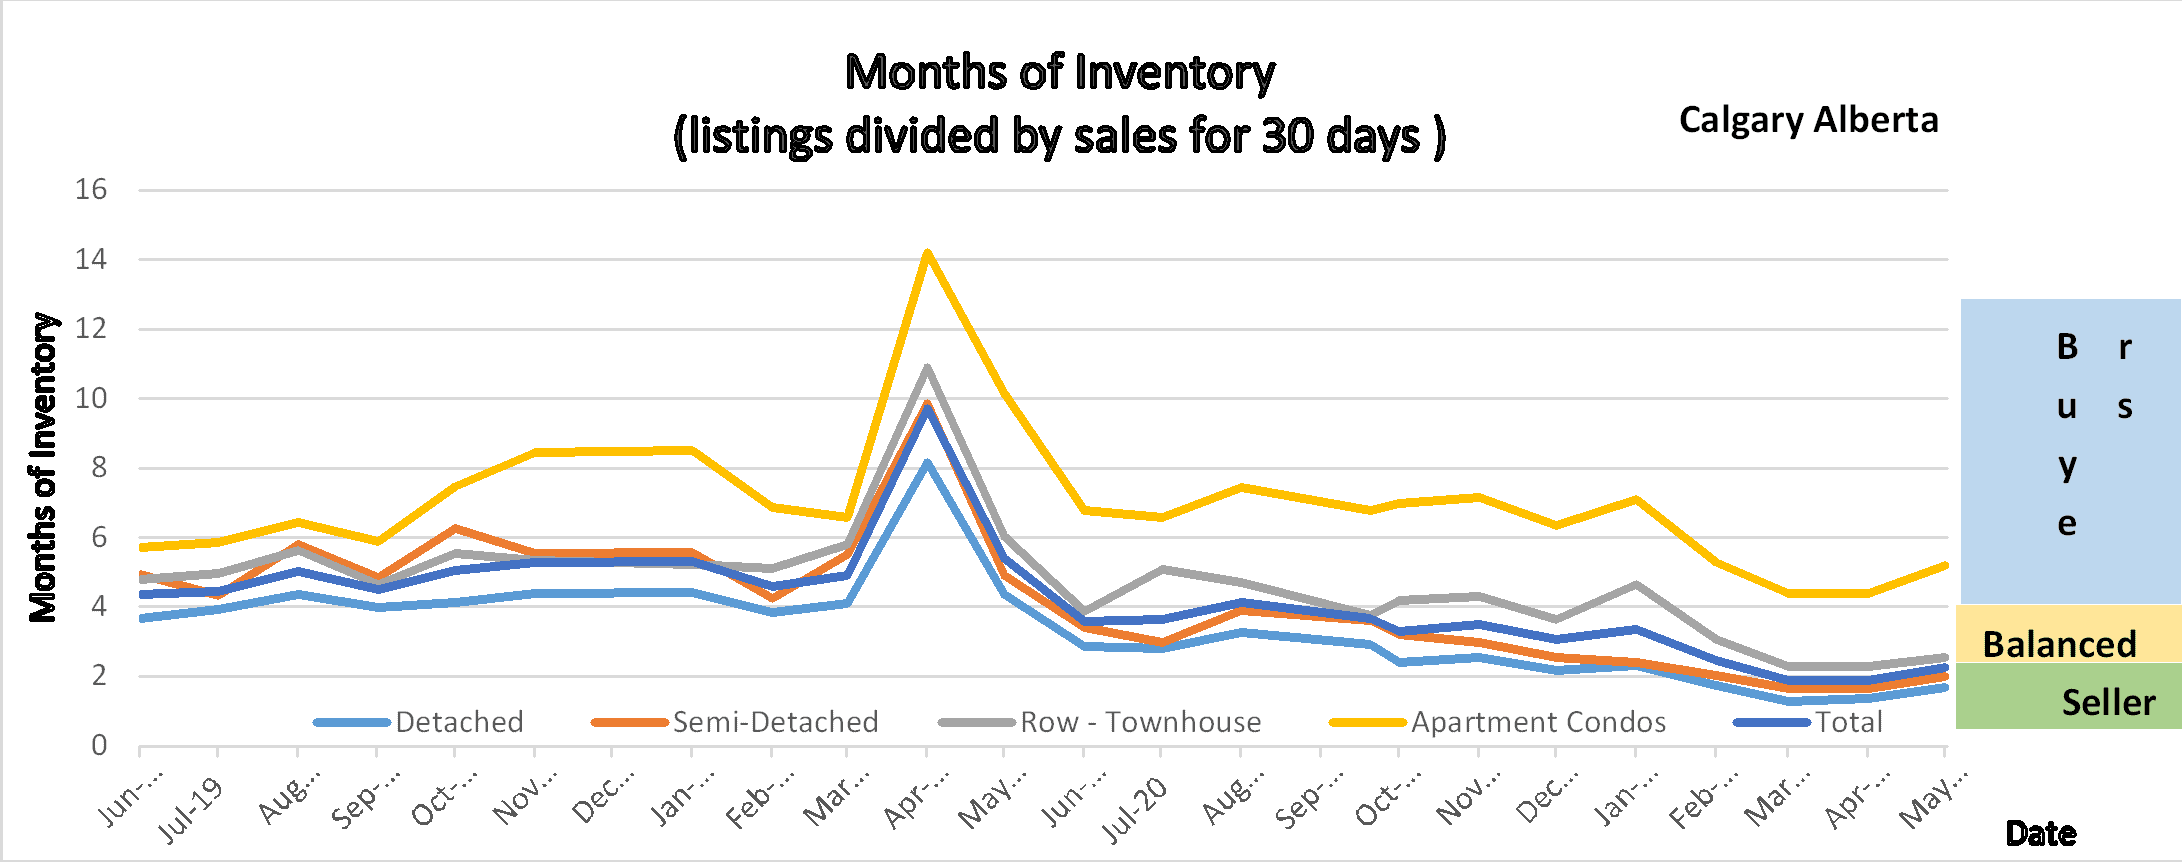
The following graph shows the months of inventory for each housing sector. Looking at a one-year trendline gives you an indication of where things are really heading. As you can see the state of the market did not change much during April.
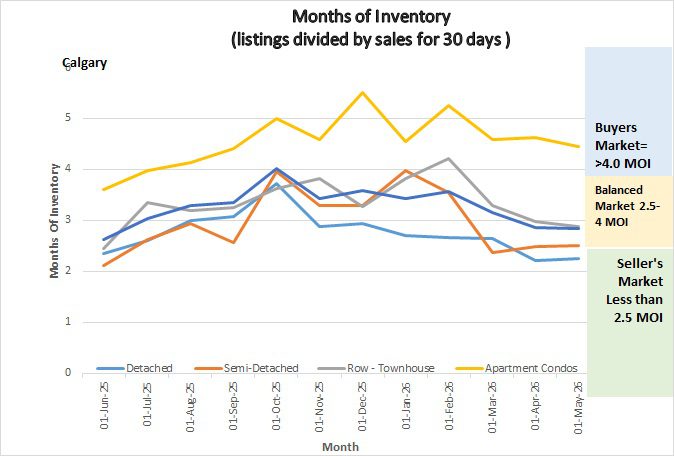
Graph shows the months of inventory for all sectors in the Calgary Real Estate Market
Gord’s commentary for the month (just my opinion).
April Highlights
- Sales and inventory both increased at the same rate
- Pricing overall increased but not substantially
- Months of Inventory remained constant.
- Not too much excitement in these numbers and that okay.
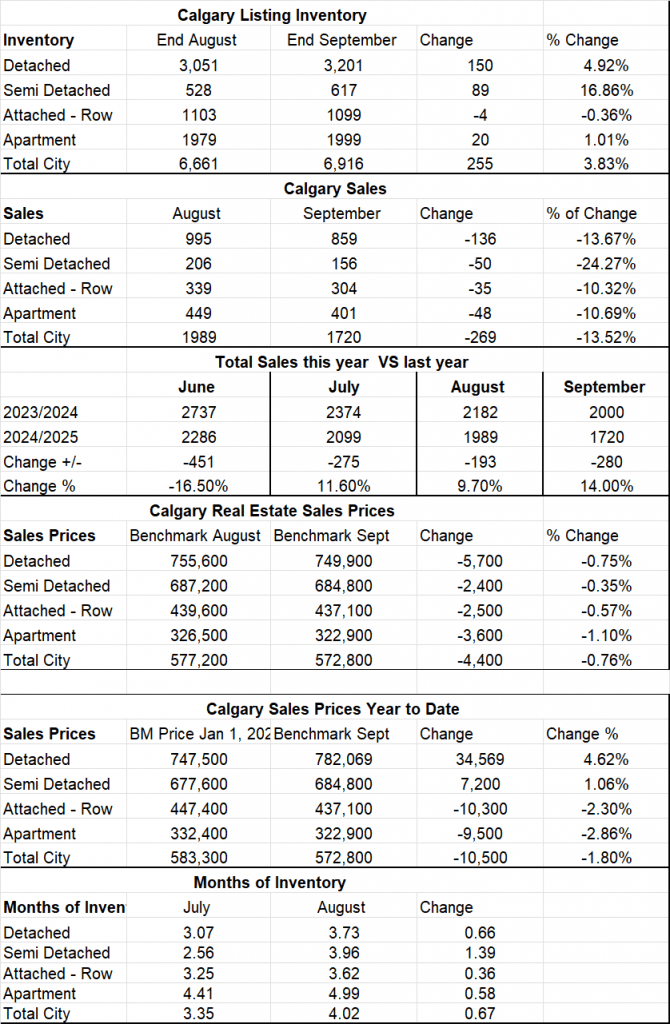
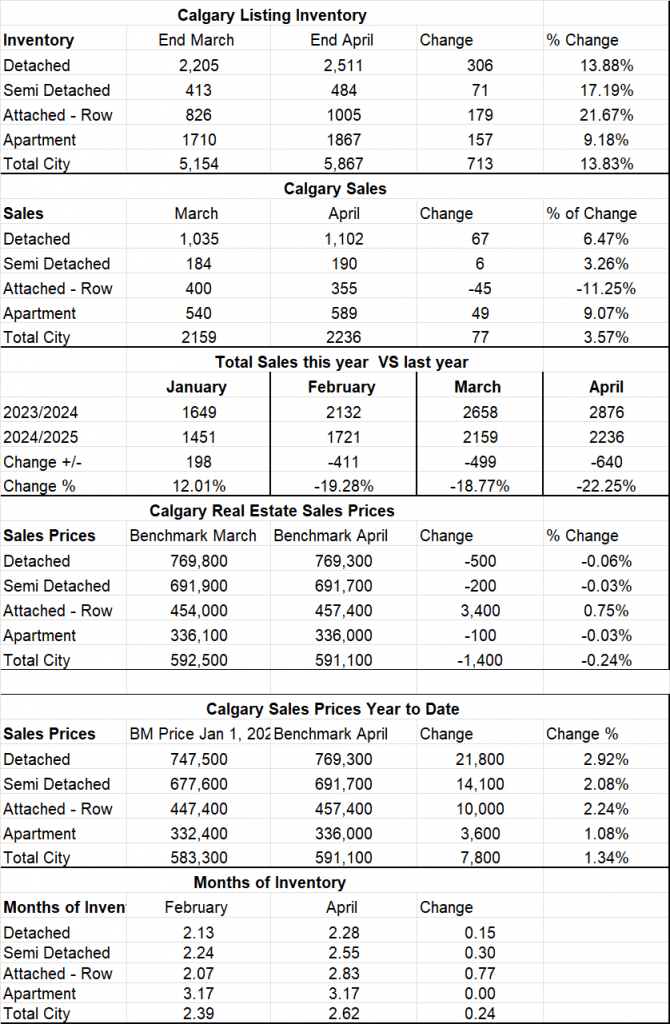
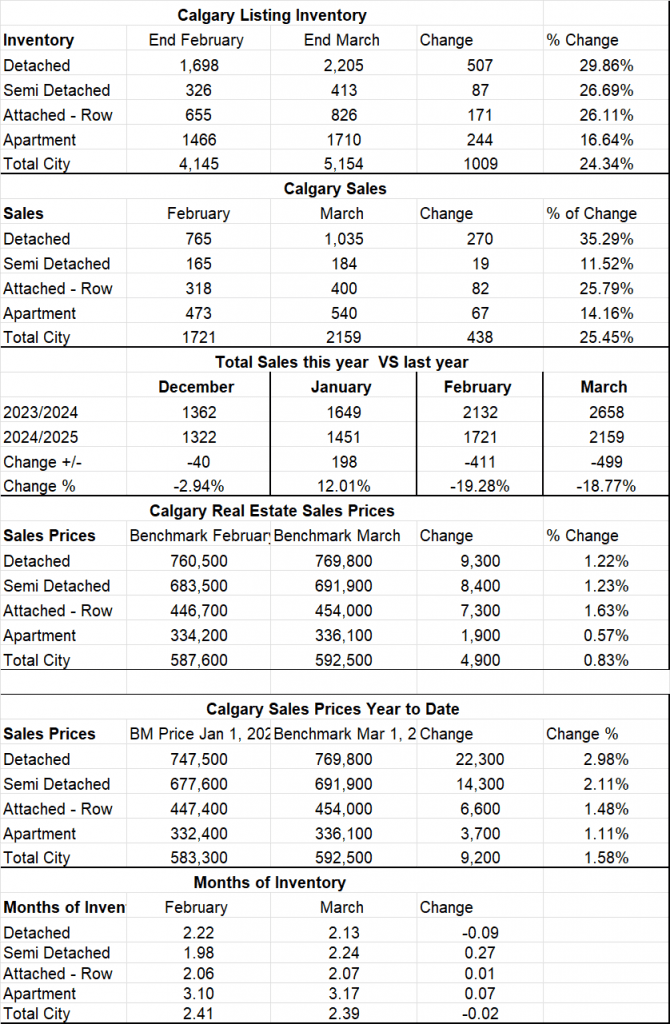
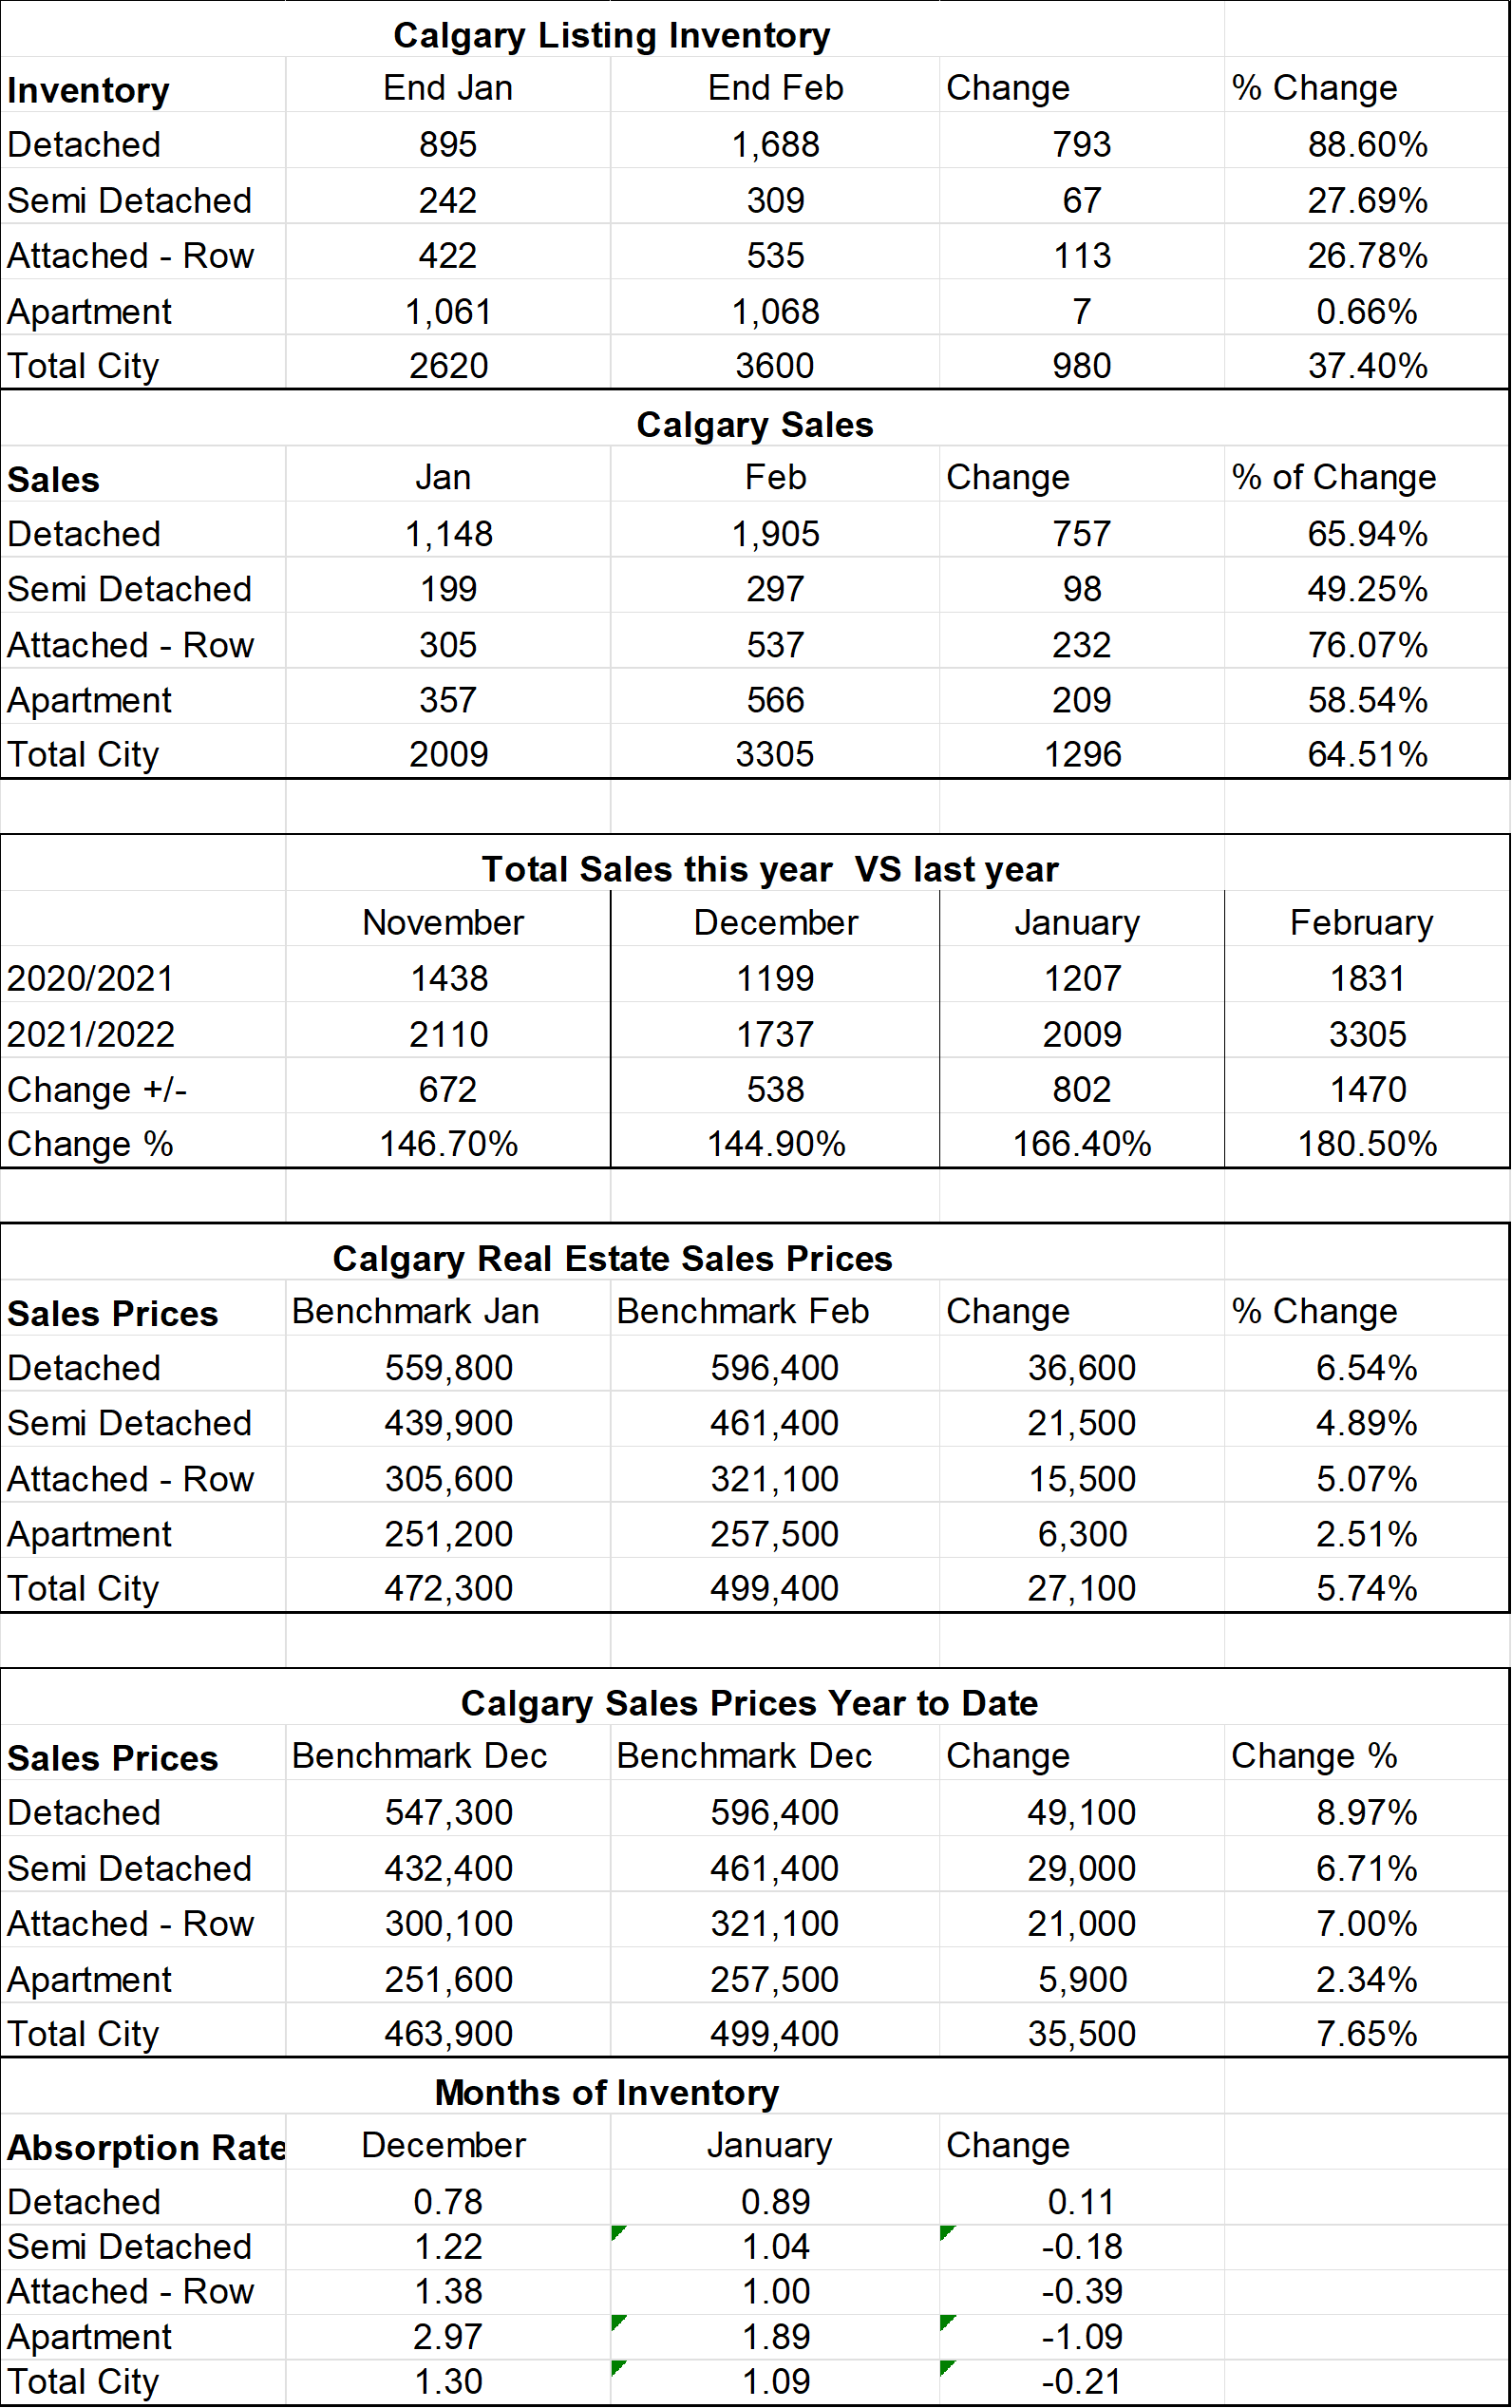
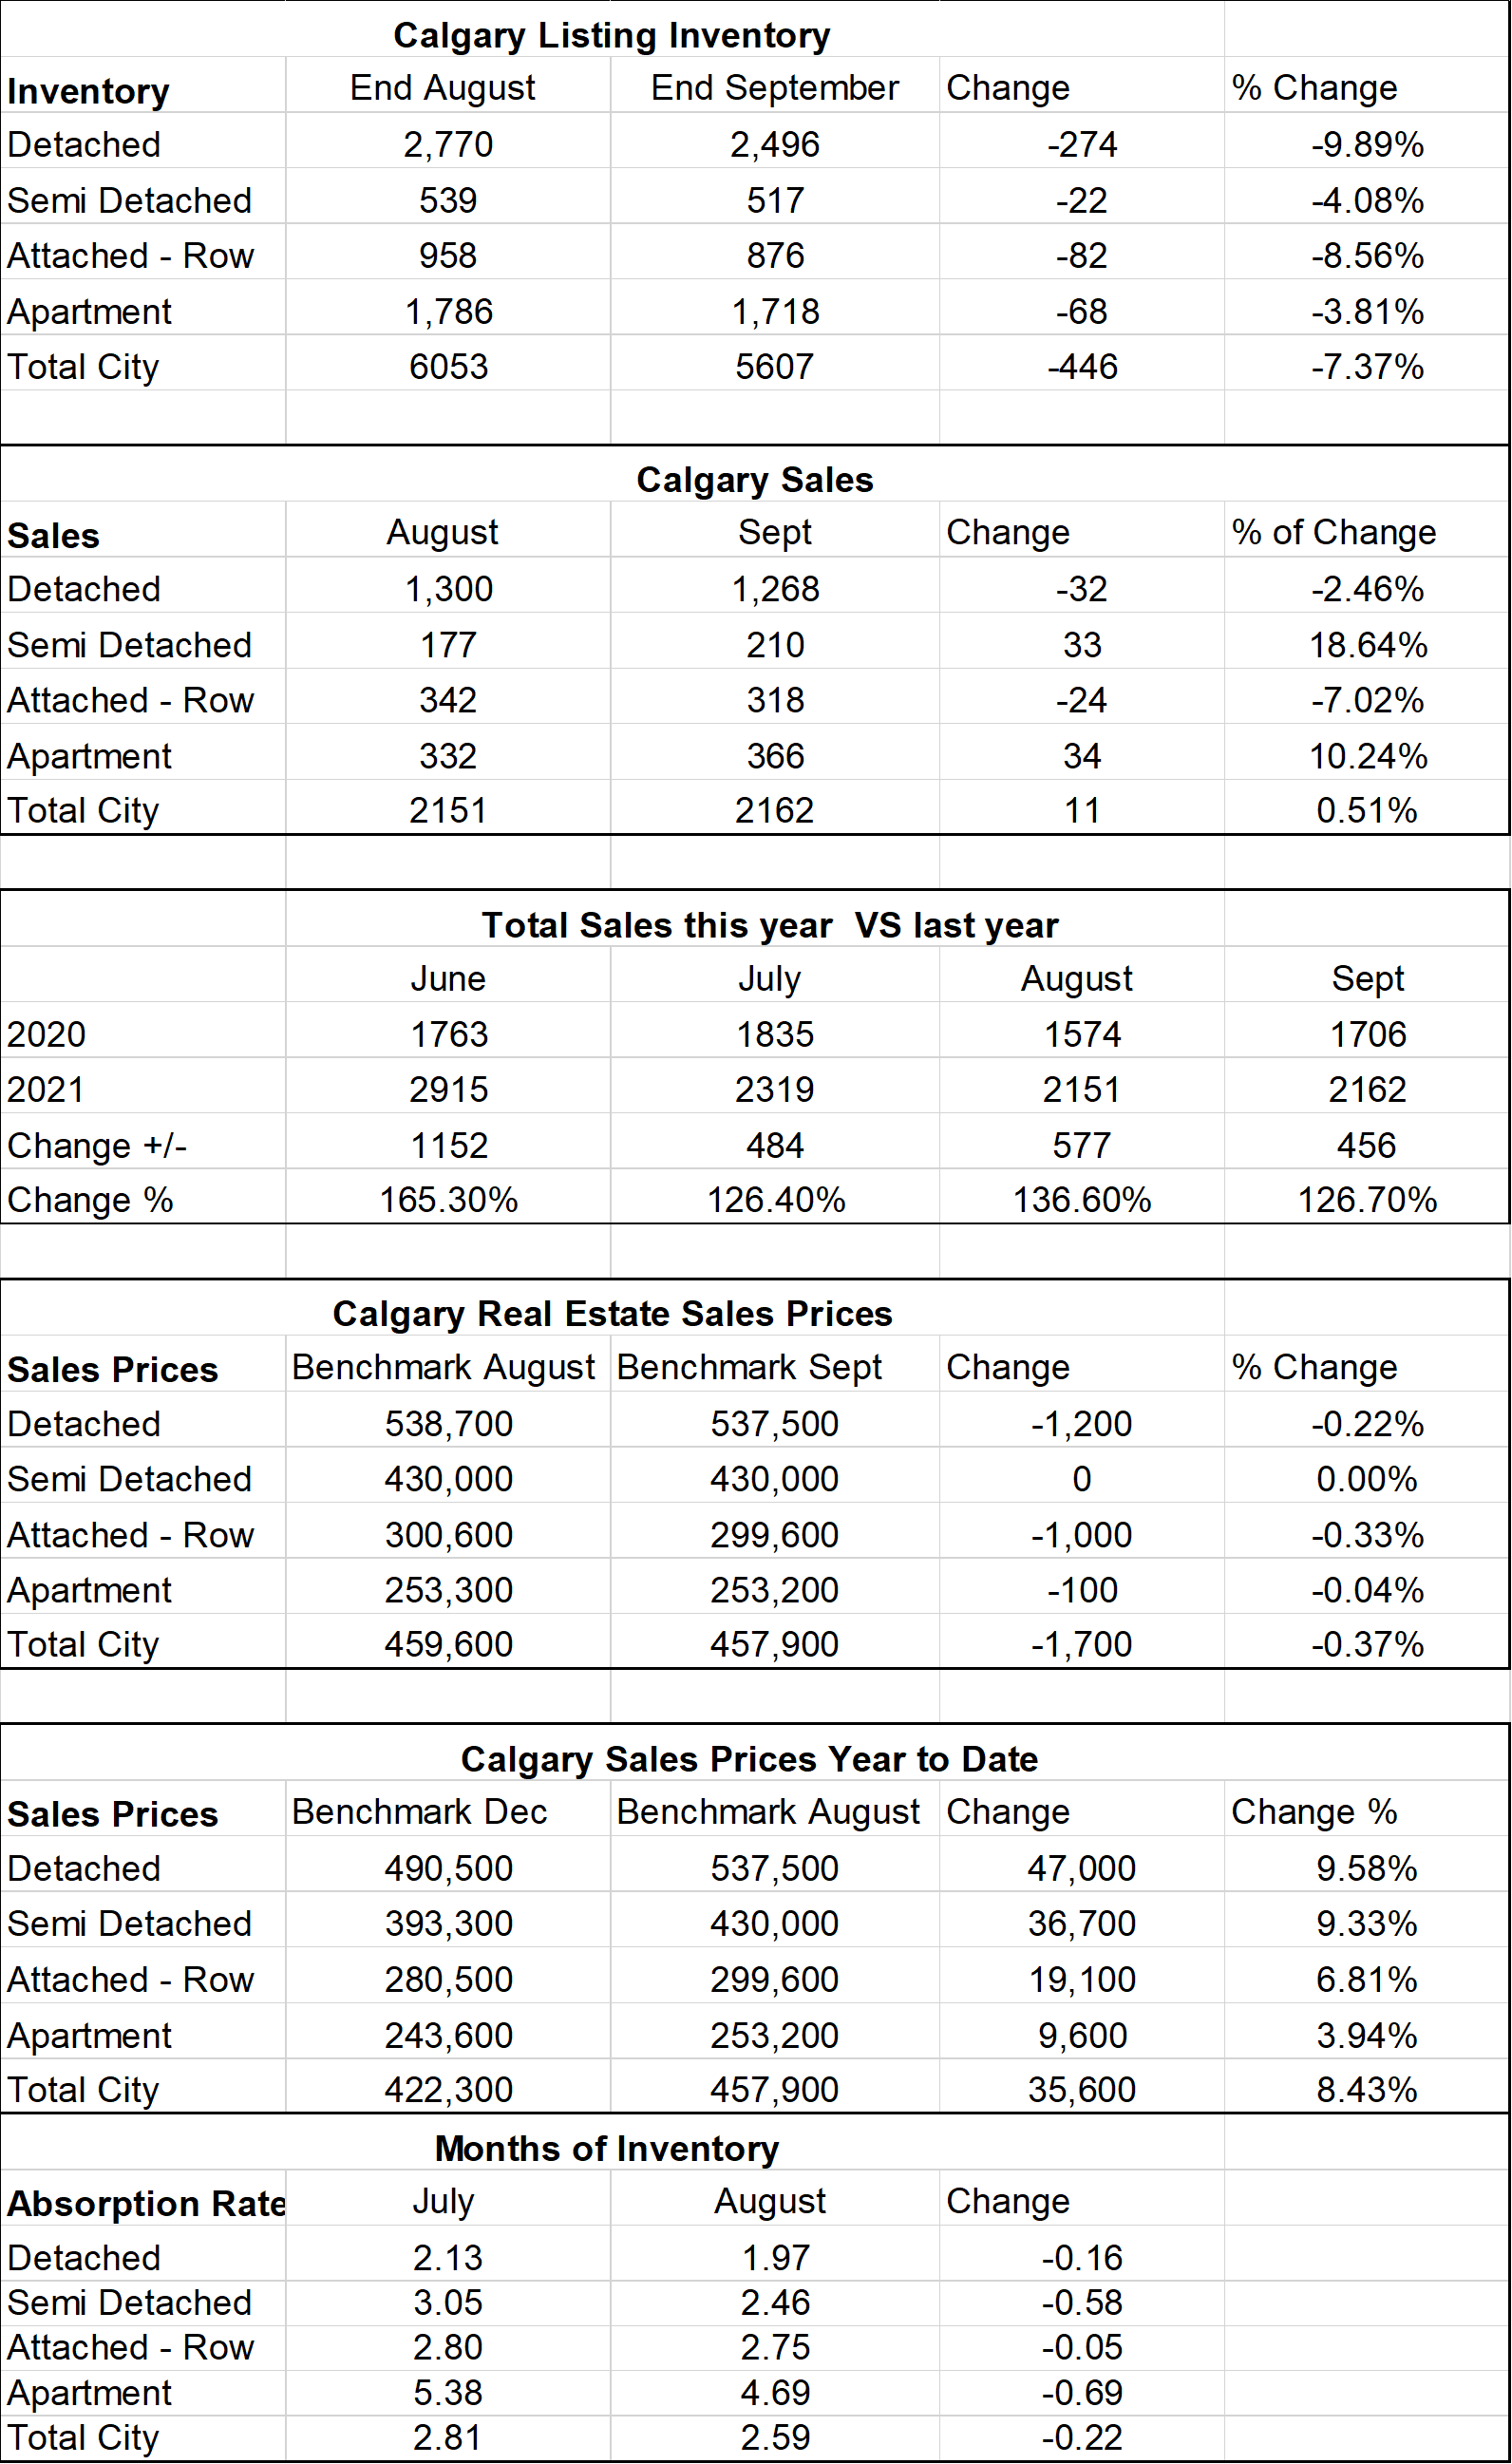
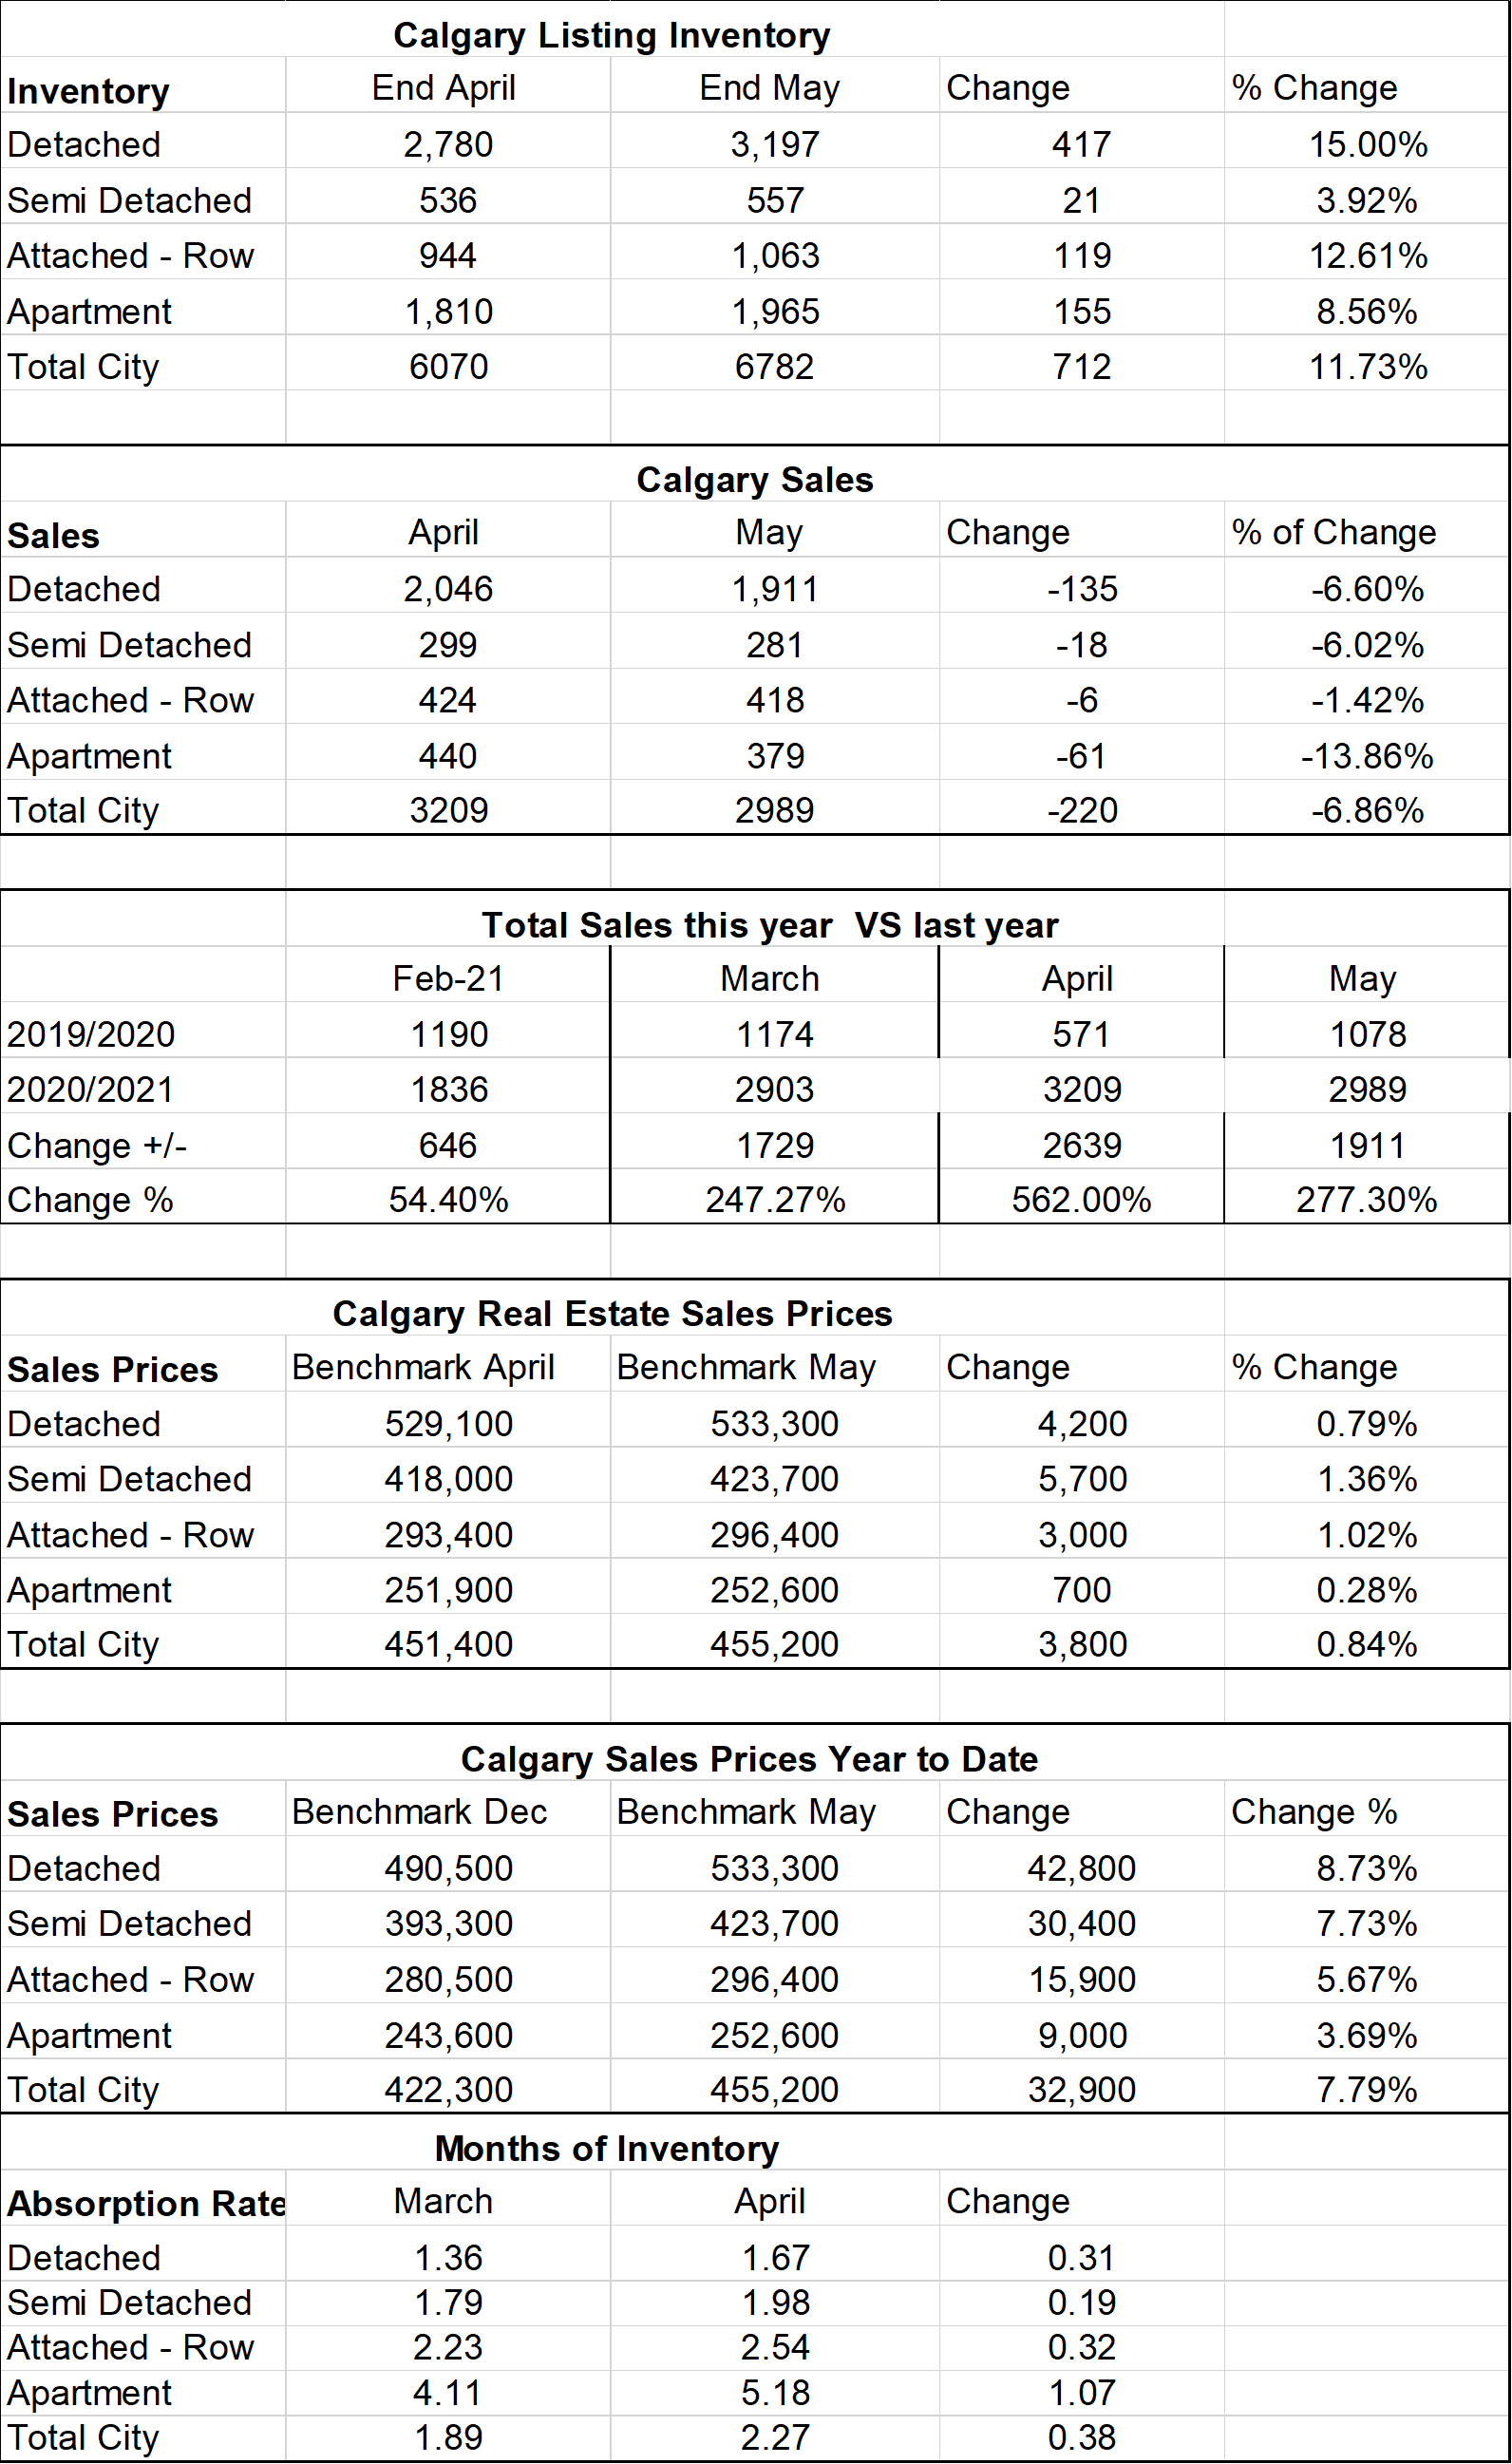
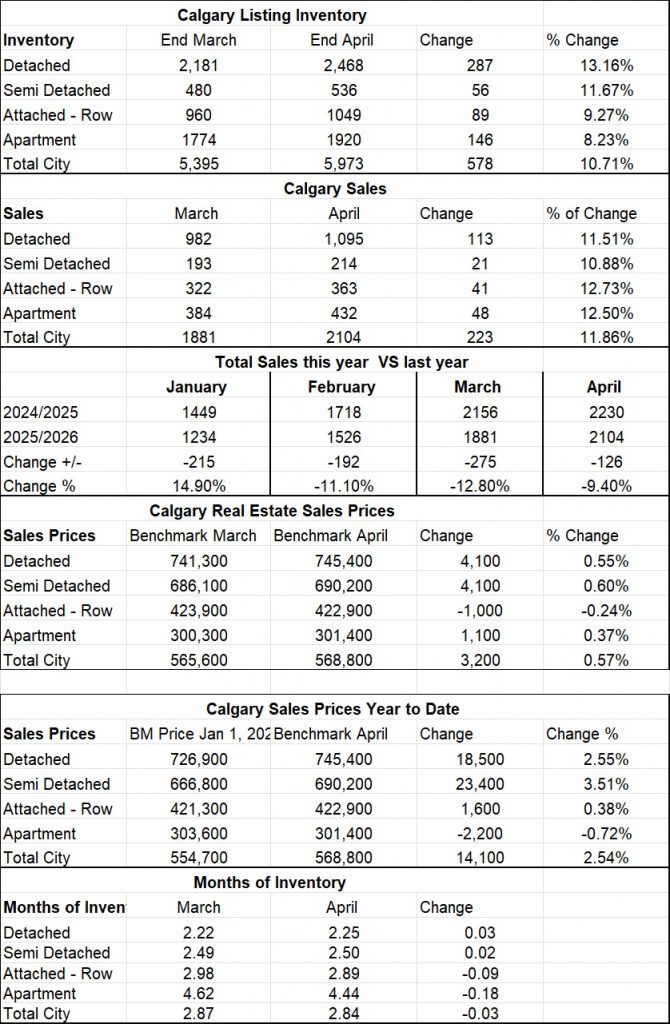
Calgary Listing Inventory
All sectors saw an increase in Inventory which is normal for this time of year. Increases ranged from 9.27% to 13.16%. We can anticipate this number to continue to increase until June.
Calgary Sales
Calgary overall sales increased by 11.86% in April. We can expect this trend to continue until June. All sectors saw an increase, and they ranged from 10.88% to 12.5%.
Sales Compared to 2025:
As you can see sales in 2026 compared to 2025 are lower. Seems the difference is getting smaller every month. As mentioned before these sales levels are still above the long-term average so nothing concerning here.
| November | December | January | February | March | April | |
| 2025 | 1793 | 1318 | 1449 | 1718 | 2156 | 2230 |
| 2026 | 1553 | 1126 | 1234 | 1526 | 1881 | 2104 |
| Change | -240 | -192 | -215 | -192 | -275 | -126 |
| % Change | -13.4% | -14.5% | -14.9% | 11.1% | -12.8 | -9.4 |
Calgary Real Estate Benchmark Sales Prices:
The overall Benchmark price increased by $3,200 or .57% in April. The larger gains were in the Detached and Semi-detached sectors of $4,100 each. The Attached row sector declined by $1,000 and the Apartment sector increased by $1,100 This is showing an indication that Apartment condominiums may have hit there low and might show less decreases that past soft markets.
Current Months of Inventory (Absorption Rate):
The overall months of Inventory decreased by only .03 so all sectors remained flat through April.
My Prediction for what is ahead:
Based on the numbers for the last two months it looks like we are going to see the Detached Sector and the Semi-detached sector favor sellers more while the Apartment Condo and Attached -Row sector will remain flat.
Special Note: What I am seeing on the street is inconsistent with the numbers above. What I am referring to is there seems to be significant differences in communities, for example inner city detached homes are remarkably busy and many of them are going into competing offers while the newer communities are struggling with a lot of inventory.
Summary of the Calgary Real Estate Board Realtors Stats
- Note – These numbers will vary substantially from Community to Community. If you would like info on your community contact us.