What is really happening in the Calgary Real Estate Market?
Following is a graph that shows the months of inventory for each housing sector. Looking at a one-year trendline gives you an indication of where things are really heading.
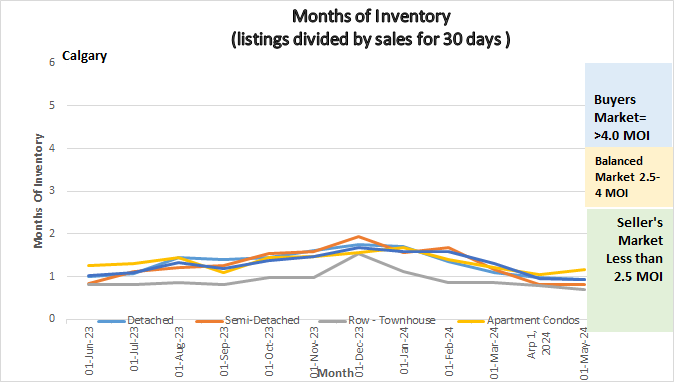
Graph showing Months of Inventory for Calgary Real Estate Market
Gord’s commentary for the month (just my opinion).
April 2024 Highlights
2024 Continues to Roar!
- Inventory increased but only marginally.
- Sales Increased 7.3% over last year and are much higher than long term trends.
- Prices increased again!
- Seller’s market continues….
Calgary Listing Inventory
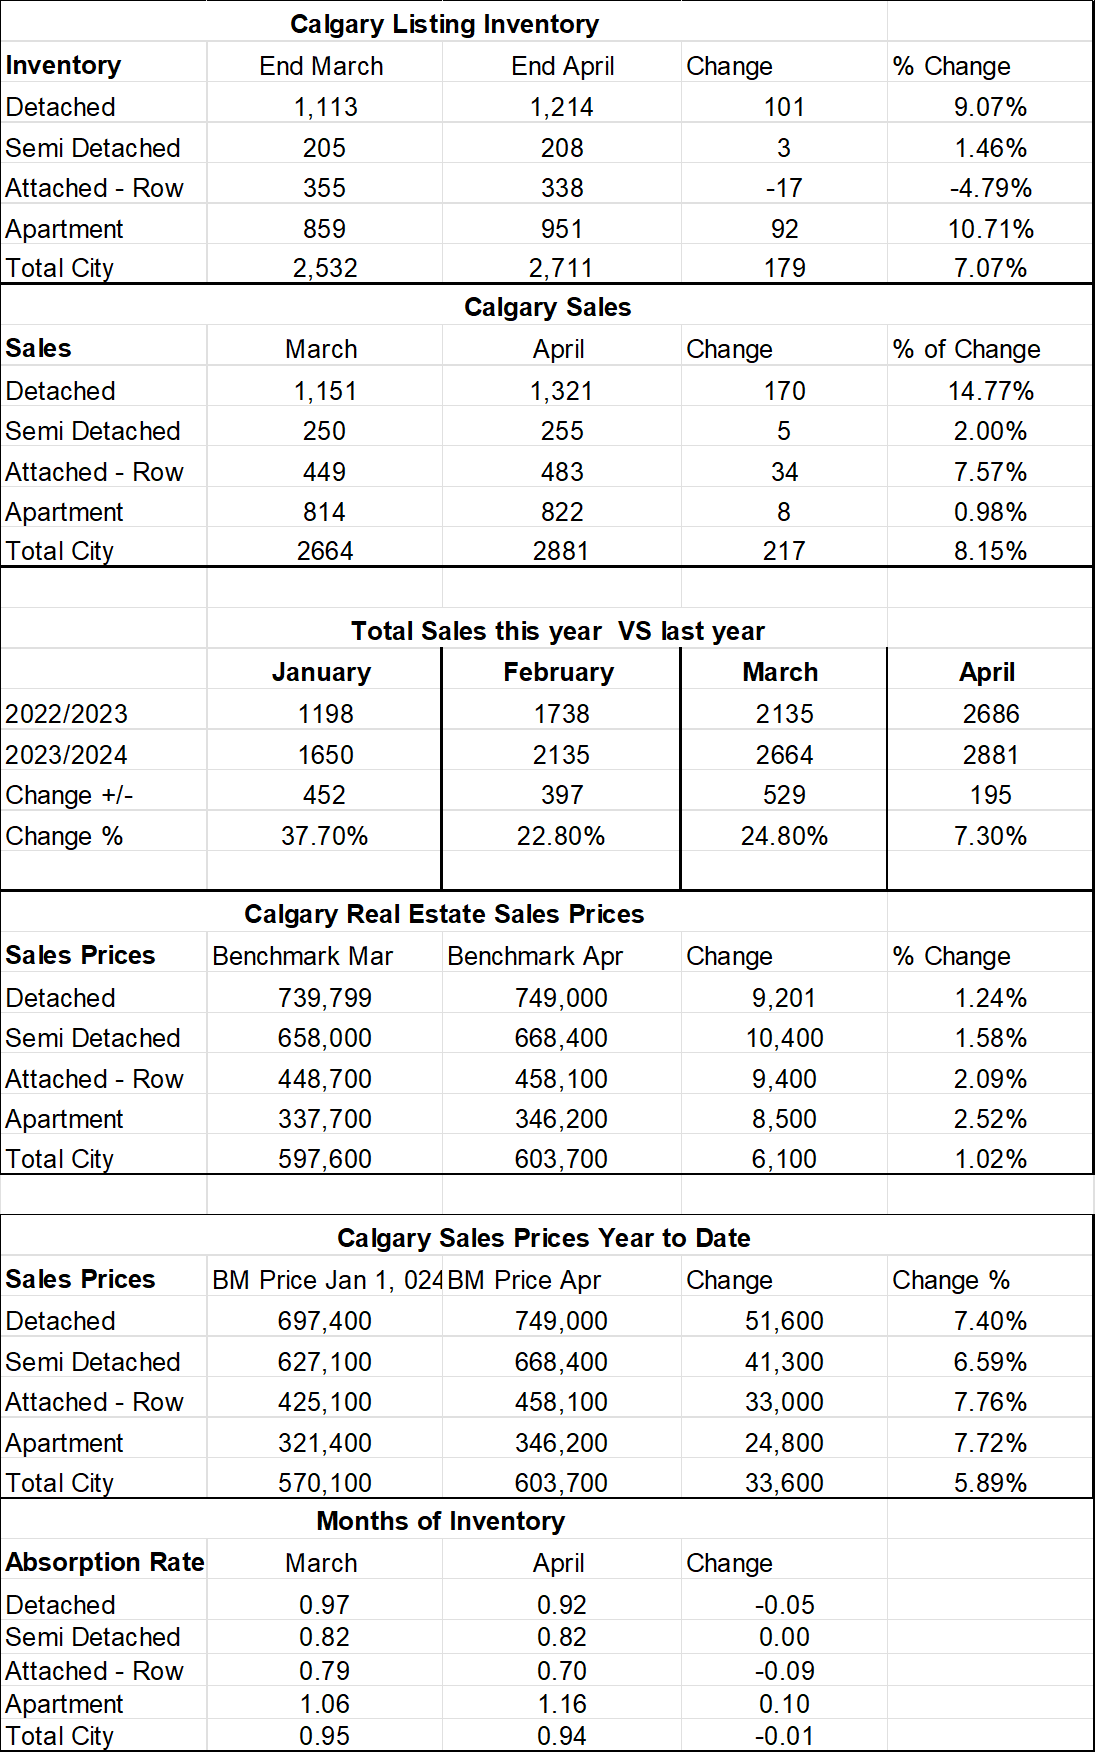
Our listing inventory increased in April, only by 179 listings so our inventory is still critically low especially in the lower price brackets.
Calgary Sales:
Sales increased again in April but only by 8.15% compared to a 24.8% increase from February to March.
As I have said before if we had more inventory the sales would be substantially higher.
Sales Compared to 2023:
Sales in April were 195 (or 7.3%) over April of last year. Yes, this number has dropped compared to last month, so I point out that from march to April last year we saw a significant increase as I believe we were showing an increase due to the season. This year we started off booming and it has stayed flatter.
| Jan | Feb | Mar | Apr | May | June | |
| 2023 | 1198 | 1738 | 2135 | 2686 | ||
| 2024 | 1650 | 2135 | 2664 | 2881 | ||
| Change | +452 | +397 | +529 | +195 | ||
| % Change | 37.7% | 22.8% | 24.8% | 7.3% |
| July | Aug | Sept | Oct | Nov | Dec | |
| 2022 | 2249 | 2133 | 1893 | 1855 | 1642 | 1200 |
| 2023 | 2647 | 2729 | 2441 | 2171 | 1787 | 1366 |
| Change | +398 | +596 | +548 | 316 | +145 | +166 |
| % Change | +17.7% | 27.9% | +28.9% | +17.1% | 8.8% | 15.5% |
Calgary Real Estate Benchmark Sales Prices:
The overall Benchmark price increased by another $6,100 or 1.02% in April. Increases were fairly consistent across all sectors.
Calgary Real Estate Benchmark Year to Date Sales Price: See chart below.
Year to date the entire market has increases by $33,600 or 5.89% which is substantial. As long as we are inventory challenged these increases will continue.
Current Months of Inventory (Absorption Rate): Our Months of Inventory remained flat this month with the largest change being an increase in Apartment Condos of .10 and a decrease in Attached Row Homes of .9. Keep in mind that anything below 2.5 is in a seller’s market position so we are deep in Seller’s market territory and prices will continue to rise.
My Prediction for what is ahead: Anything below 2.5 months of Inventory is in a seller’s market position so at .94 months of inventory we are deep in Seller’s market and prices will continue to rise. On the street I am seeing more offers on listings and the amount over list price appears to be rising.
If you are following Real Estate listings you will also notice that some listings, come on the market at what looks like an incredible deal! Some sellers are listing well below market value trying to create multiple offers and then those listings sell for substantially higher than list price.
*Below is a summary of numbers in chart form. All numbers are taken from the Calgary Real Estate Boards monthly Stats package.
*All numbers vary by community and price ranges, if you would like stats specifically for your neighbourhood, please contact us.
See Calgary Real Estate Stats Below
Calgary Real Estate Board Stats
Tags: Calgary Condo Market, Calgary Condo Prices, Calgary Real Estate Market, calgary real estate prices