What is really happening in the Calgary Real Estate Market?
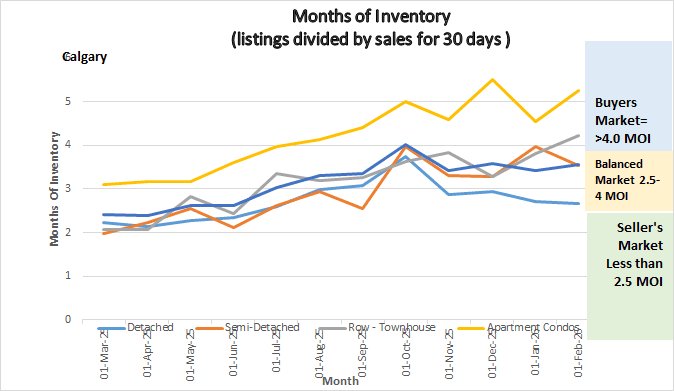
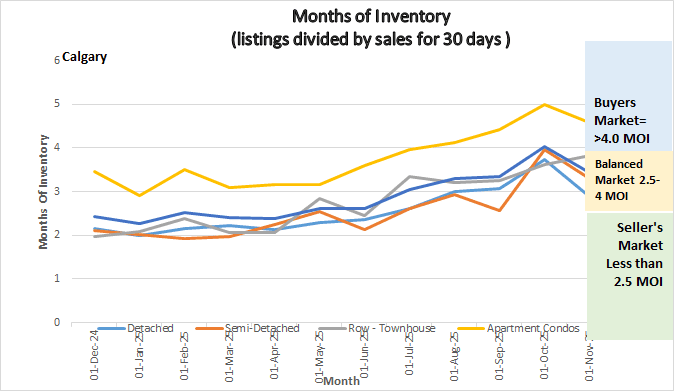
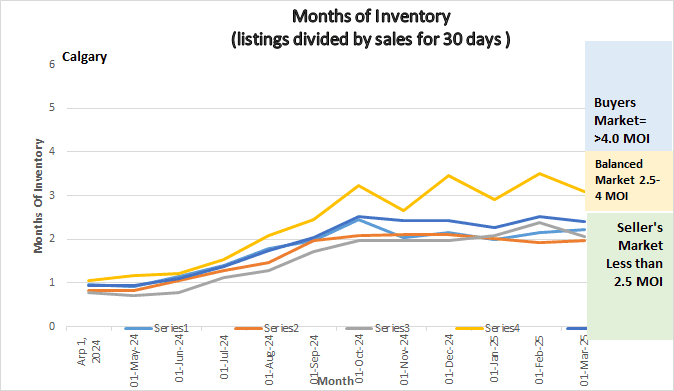
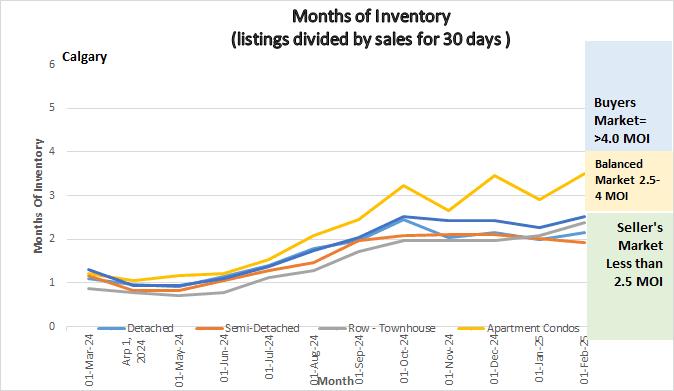
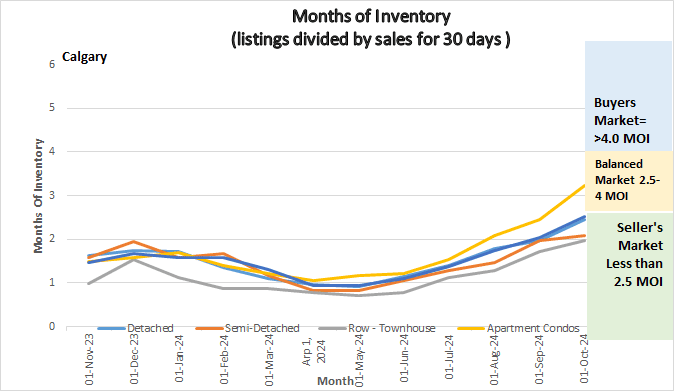
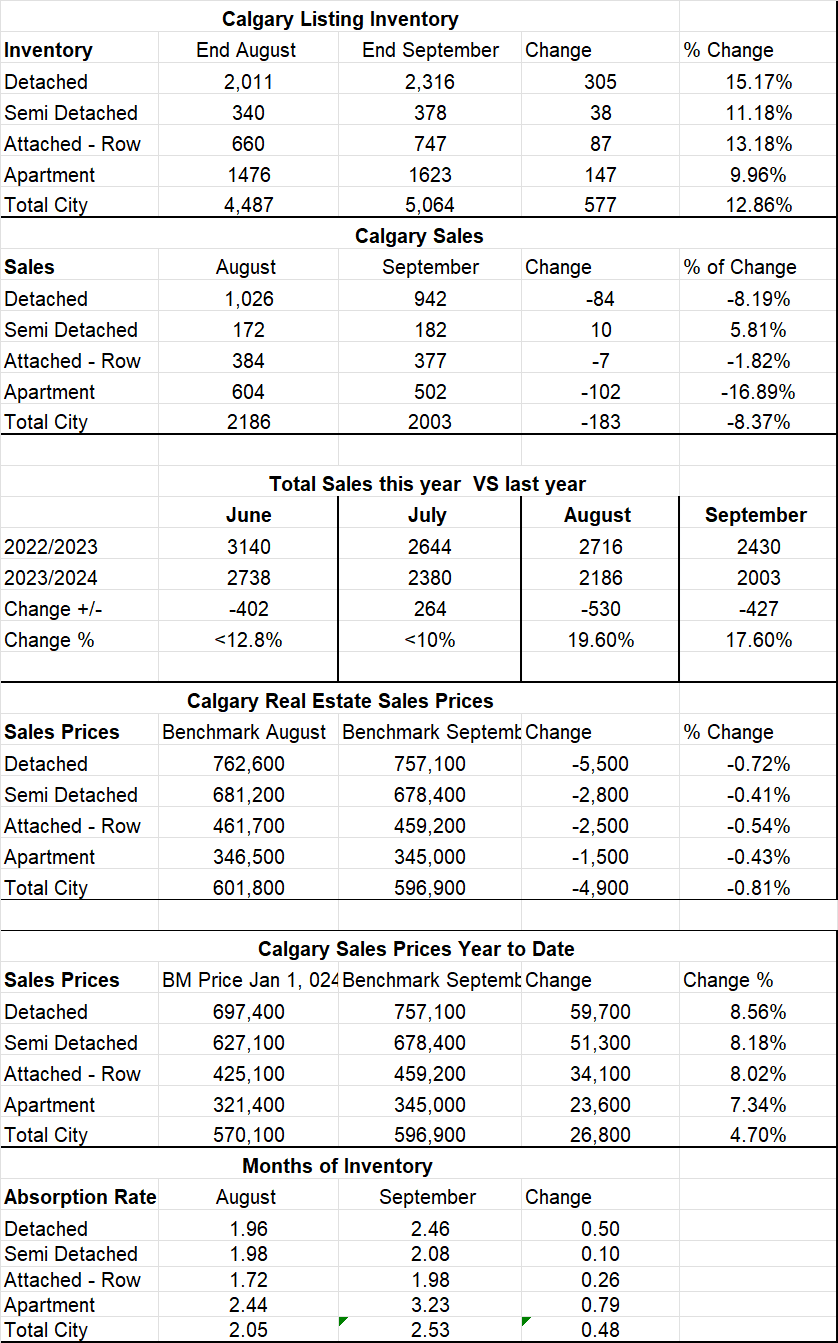
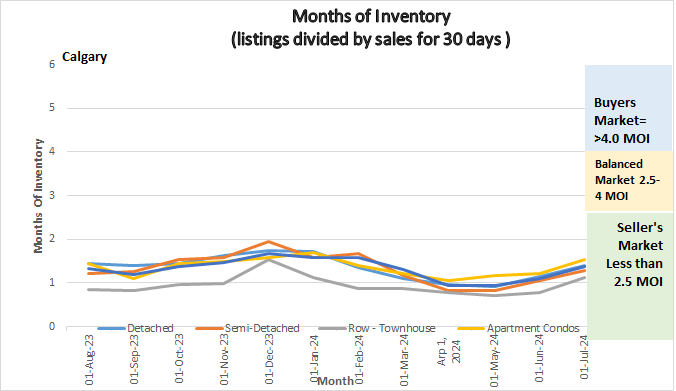
The following graph shows the months of inventory for each housing sector. Looking at a one-year trendline gives you an indication of where things are really heading.

Graph shows the months of inventory for all sectors in the Calgary Real Estate Market
Gord’s commentary for the month (just my opinion).
February Highlights
- The increase in sales outpaced the increase in Months of Inventory by approx. 14% moving us to favor sellers more than buyers.
- Prices for Semi-Detached and Detached Homes increased by $15,200 and $10,300 respectively while prices for apartment condominiums decreased by $2,600. Attached Row Homes remained flat.
- Months of Inventory decreased by .4
- Looking like in 2026 Buyers are beating sellers to the market.
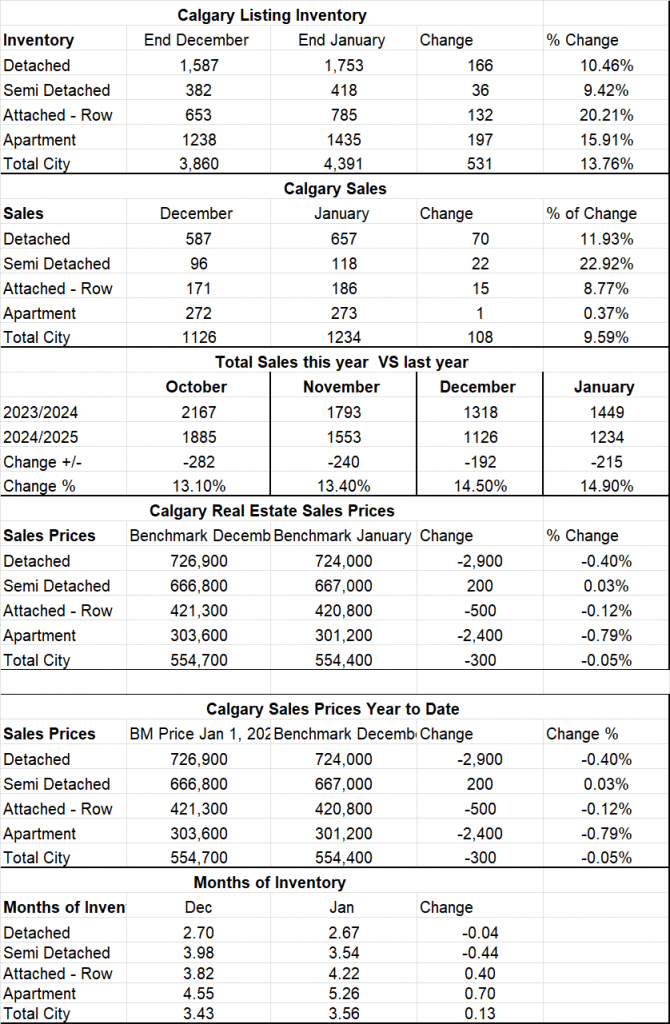
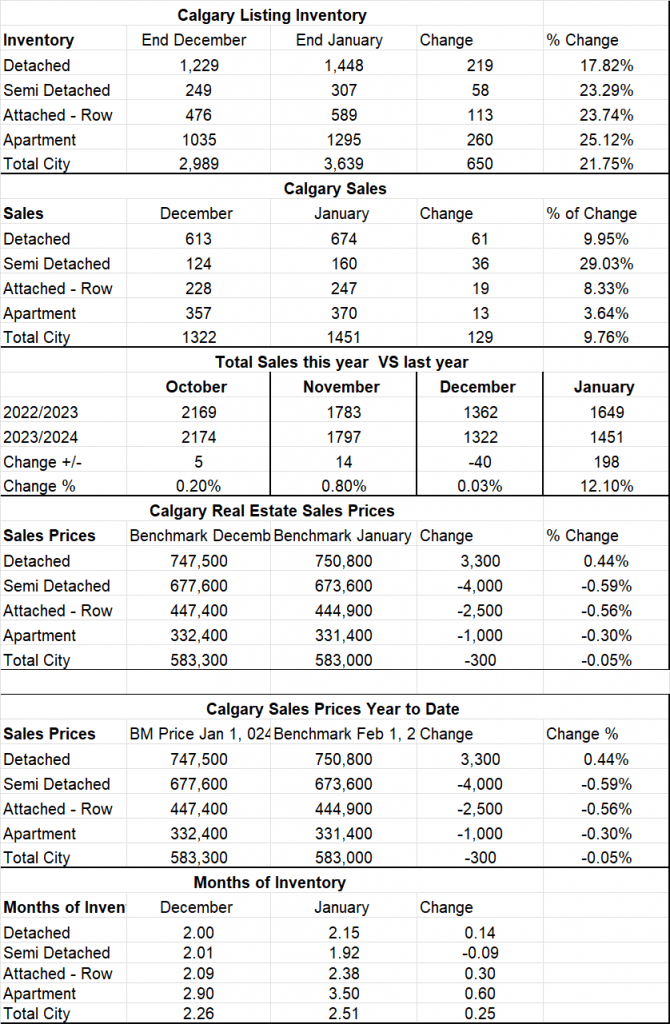
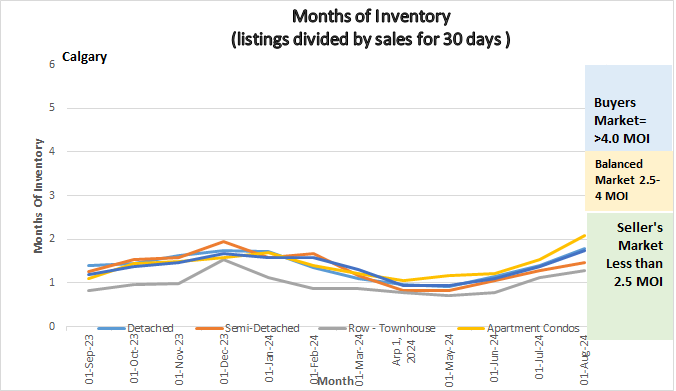
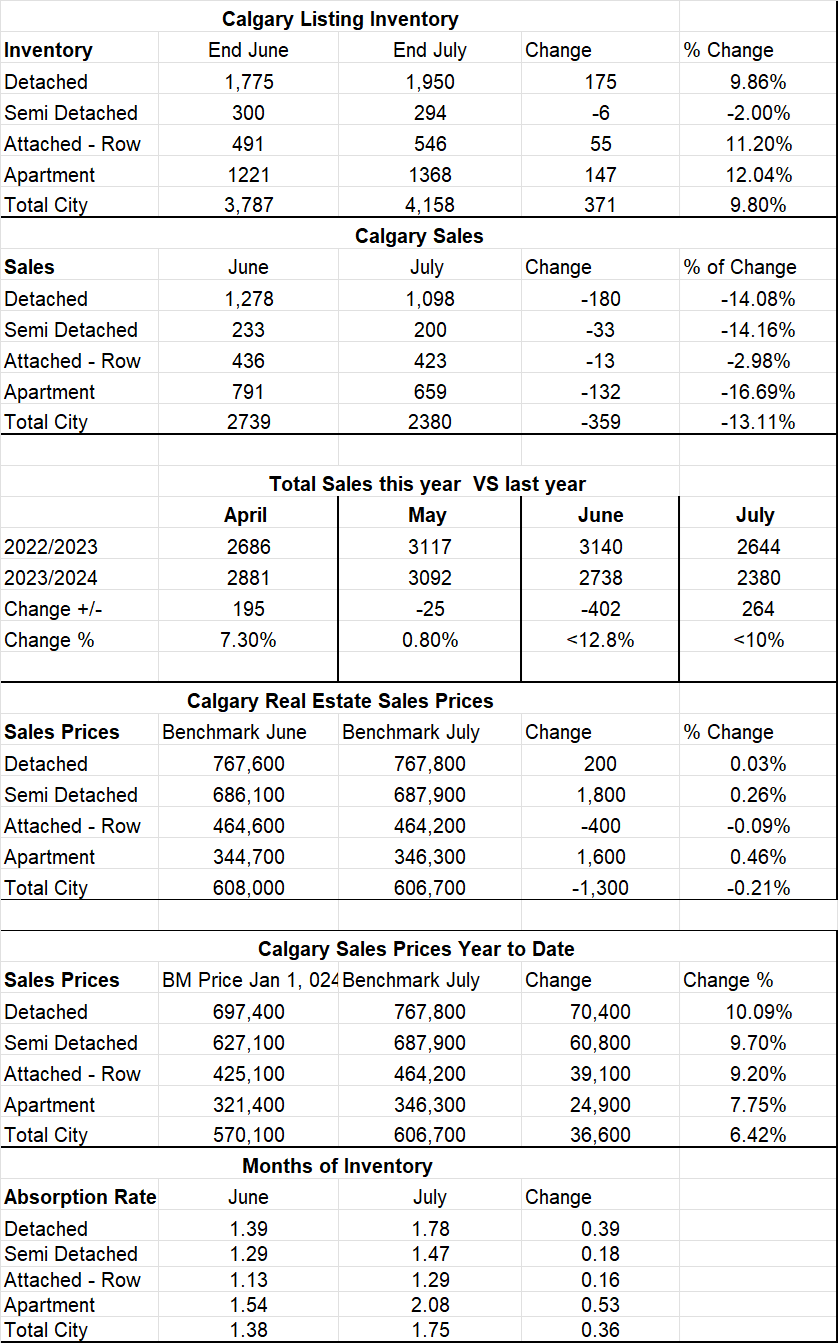
Calgary Listing Inventory
All sectors saw the Months of Inventory increase between 9% to 11% in February. The only exception is in the Semi-Detached Sector and this sector decreased by only four listings. This is normal for this time of year, as listings usually increase from January to June.
Calgary Sales
Sales in February increased by 23.66% over January. Take note that the increase in Semi-Detached homes was 48.31% and Attached Row homes increased by 45.16%. Other sectors increased by between 12-26%
Sales Compared to 2025:
February compared to February of last year saw a sales decrease of 192 sales or 11.1%.
This shows that sales are still below last year at this time but it’s important to note that these numbers are still above long-term trends.
| Sept | October | November | December | January | February | |
| 2025 | 2000 | 2167 | 1793 | 1318 | 1449 | 1718 |
| 2026 | 1720 | 1885 | 1553 | 1126 | 1234 | 1526 |
| Change | -280 | -282 | -240 | -192 | -215 | -192 |
| % Change | -14. % | -13.1 | -13.4% | -14.5% | -14.9% | 11.1% |
Calgary Real Estate Benchmark Sales Prices:
The overall Benchmark price $6,100 in February. The highest increase was in the Semi-Detached sector at $15,200 followed by the detached sector at $10,300. The only sector that showed a loss was the Apartment Condo sector which lost $$2,600 or .86%.
Current Months of Inventory (Absorption Rate):
The overall months of Inventory decreased by .4 which is quite substantial and really shows the direction of the market – moving to favor sellers over buyers.
My Prediction for what is ahead:
I believe that the Detached and Semi-Detached are going to continue favoring the sellers, the Attached Row sector will remain stable while the Apartment Condo sector will continue to favor Buyers meaning future price decreases.
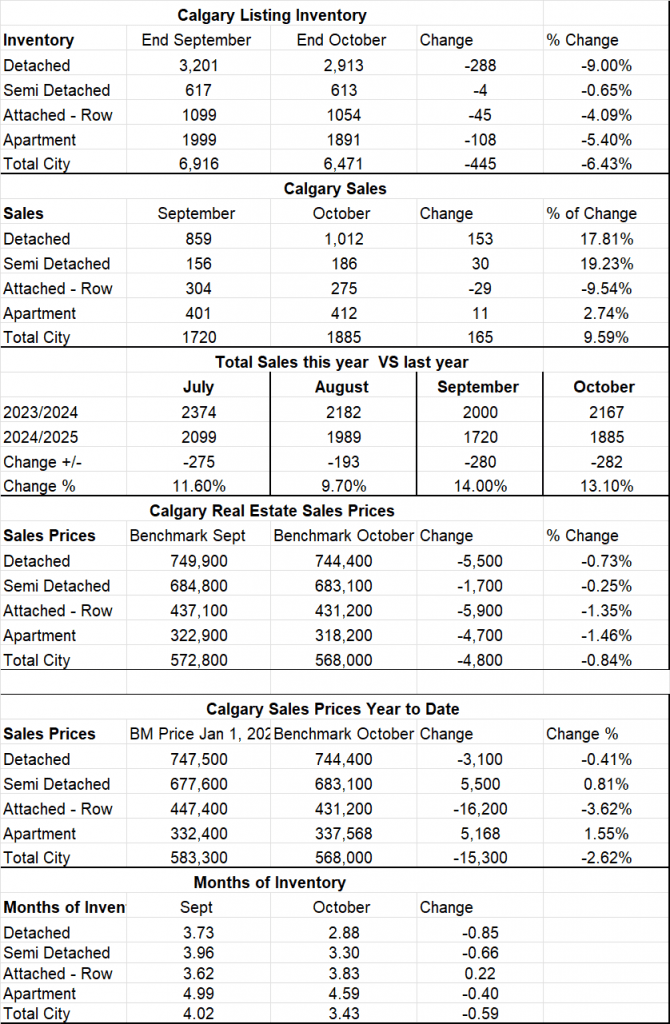
*Below is a summary of numbers in chart form. All numbers are taken from the Calgary Real Estate Boards monthly Stats package.
* All numbers vary by community and price ranges, if you would like stats specifically for your neighbourhood, please contact us.