What is really happening in the Calgary Real Estate Market?
Following is a graph that shows the months of inventory for each housing sector. Looking at a one-year trendline gives you an indication of where things are really heading. As you can see our months of inventory is heading upwards.
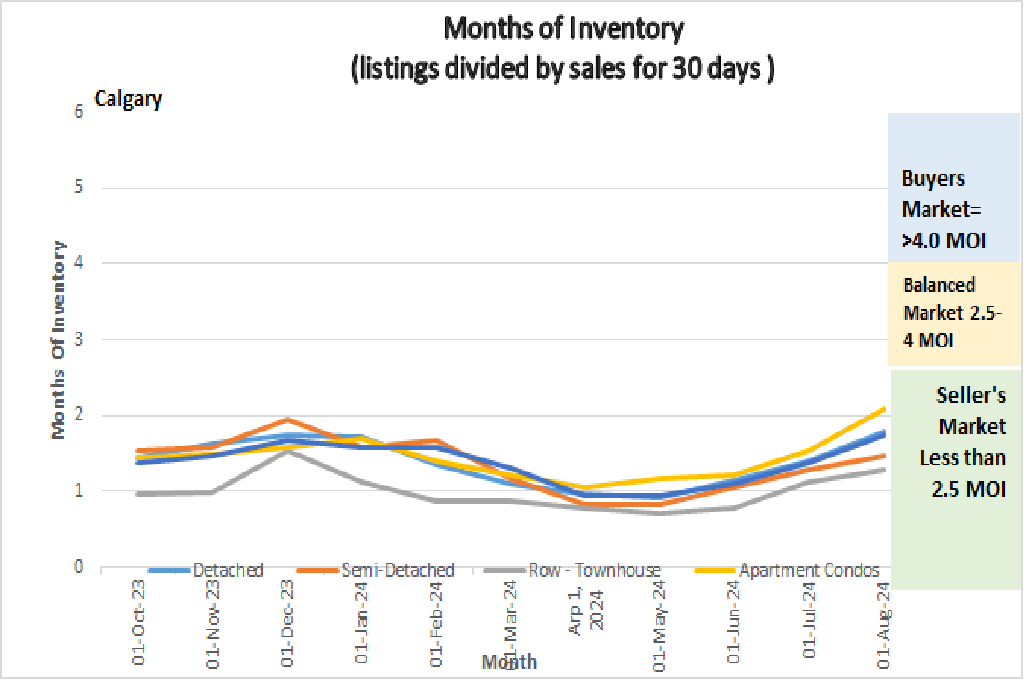
Graph showing Months of Inventory for Calgary Real Estate Market
Gord’s commentary for the month (just my opinion).
August 2024 Highlights
Change is here:
- Our Months of Inventory continues to rise (see graph above) however we are still in a Seller’s Market Position.
- We are trending quickly towards a more balanced market.
- Inventory continues to rise a little each week.
- Overall Benchmark Prices Decreased a little in the month of August.
Calgary Listing Inventory
The Calgary listing Inventory increased again in August to 2.05 months of Inventory, a number that has not been seen since 2022. Although the Inventory increased again, we are still 17% lower than the long-term average for the month of August. One week does not make a trend nut last week say a decrease in inventory for the first time in 8 weeks.
Calgary Sales:
Sales in August slowed again and were 194 (8.15%) lower than the month of July. I see this as more of a seasonal decrease.
Sales Compared to 2023:
Sales in August compared to 2023 were down by 530 or (19.6%) This tells me the slowdown is not just seasonal, but that market is slowing.
| Jan | Feb | Mar | Apr | May | June | |
| 2023 | 1198 | 1738 | 2135 | 2686 | 3117 | 3140 |
| 2024 | 1650 | 2135 | 2664 | 2881 | 3092 | 2738 |
| Change | +452 | +397 | +529 | +195 | -25 | -402 |
| % Change | 37.7% | 22.8% | 24.8% | 7.3% | – .8% | -12.8% |
| July | Aug | Sept | Oct | Nov | Dec | |
| 2022 | 2644 | 2716 | ||||
| 2023 | 2380 | 2186 | ||||
| Change | -264 | -530 | ||||
| % Change | <10% | 19.6% |
Calgary Real Estate Benchmark Sales Prices:
The overall Benchmark price declined by a total of $4,900. Or .81%. The largest declines were in the Detached sector and the Semi-Detached sector.
Calgary Real Estate Benchmark Year to Date Sales Price: See chart below.
Year to date the entire market has increased by $31,700 or 5.56% which is substantial.
Current Months of Inventory (Absorption Rate): Our Months of Inventory increased in all sectors. The increases were between .18 to .51 with the lowest increase in the Detached Sector and the largest increase of .51 was in the Semi-detached sector.
My Prediction for what is ahead:
Based on what the current numbers are telling me, I believe for the next few months the market will level off if not slow a little more.
In the longer term, we are now also seeing decreases in the Interest Rates and there is still huge migration which leads me to speculate that either late this year or early next year we may see another decrease in inventory and rising prices again.
*Below is a summary of numbers in chart form. All numbers are taken from the Calgary Real Estate Boards monthly Stats package.
*All numbers vary by community and price ranges, if you would like stats specifically for your neighbourhood, please contact us.
Tags: About YYC Real Estate, Calgary Condo Market, Calgary Condo Prices, Calgary Real Estate Market, calgary real estate prices