What is really happening in the Calgary Real Estate Market?
Following is a graph that shows the months of inventory for each housing sector. Looking at a one-year trendline gives you an indication of where things are really heading.
Gord’s commentary for the month (just my opinion).
November 2024 Highlights
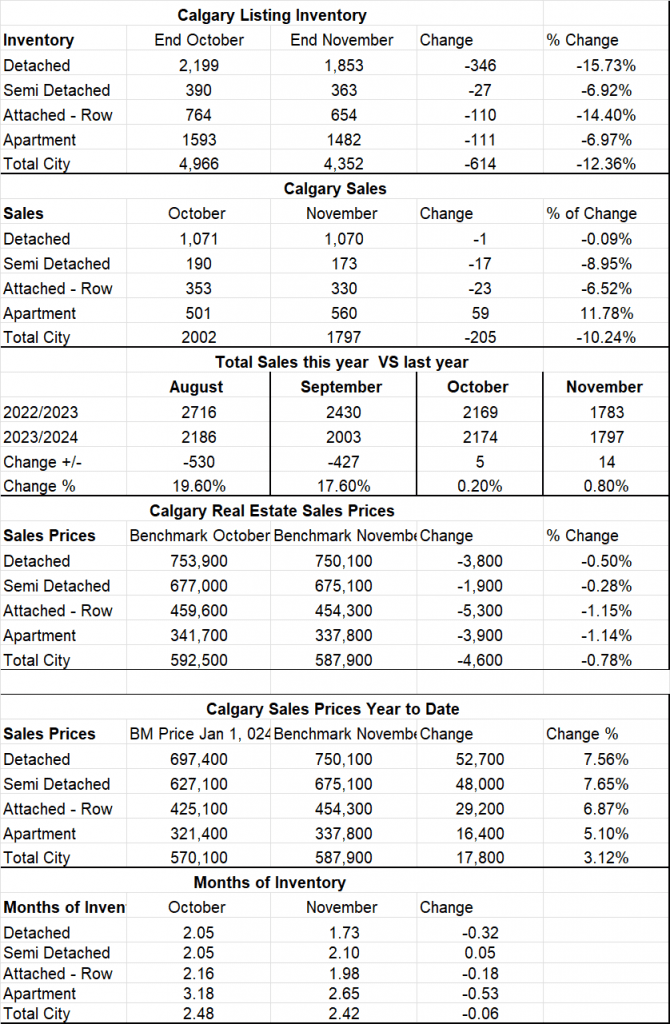
- A substantial decrease in inventory outpaced the smaller drop in sales bringing our Months of Inventory down again so we are heading more into a Sellers Market.
Calgary Listing Inventory
The Calgary listing Inventory decreased in November by 614 listings or 12.36%. To put this number in perspective the decrease in inventory in October 2024 was only 119 which is more of a seasonal drop.
Calgary Sales:
Sales across all sectors except Apartment condos decrease moderately this month. Sales of Apartment condos increase over October by 59 so it’s nice to see a little improvement there.
Sales Compared to 2023:
Sales in October compared to 2023 were up by 5. Typically, in October we will see a seasonal decline, so October was a good month. As you can see from below sales compared to last year have been way down from last year for the last 3 months, so this is showing some recovery.
| Jan | Feb | Mar | Apr | May | June | |
| 2023 | 1198 | 1738 | 2135 | 2686 | 3117 | 3140 |
| 2024 | 1650 | 2135 | 2664 | 2881 | 3092 | 2738 |
| Change | +452 | +397 | +529 | +195 | -25 | -402 |
| % Change | 37.7% | 22.8% | 24.8% | 7.3% | – .8% | -12.8% |
| July | Aug | Sept | Oct | Nov | Dec | |
| 2023 | 2644 | 2716 | 2430 | 2169 | 1783 | |
| 2024 | 2380 | 2186 | 2003 | 2174 | 1797 | |
| Change | -264 | -530 | -427 | 5 | 14 | |
| % Change | <10% | 19.6% | 17.6% | .2% | .8% |
Calgary Real Estate Benchmark Sales Prices:
The overall Benchmark price in November declined by $4,600. Or .78% This decline was consistent across all sectors.
Calgary Real Estate Benchmark Year to Date Sales Price: See chart below.
Year to date the entire market has increased by $17,800 or 3.12%. The largest increase has been detached homes at $52,700 while the smallest increase was in Apartment condos at $17,800.
Current Months of Inventory (Absorption Rate): Our Months of Inventory stayed flat in all sectors except Apartment Condos which decreased by .53.
My Prediction for what is ahead:
First, I will say that anything could happen with the change in the US government and how the Canadian government will react with new laws – today this is anyone’s guess.
Putting that aside here is what it looks like to me. We are already in a tight market and if December follows November’s direction, we will end the year in a very tight (low inventory) market. In my opinion this is likely and once the buyers come out in the new year it could be another crazy year with multiple offers and prices going up yet again.
*Below is a summary of numbers in chart form. All numbers are taken from the Calgary Real Estate Boards monthly Stats package.
*All numbers vary by community and price ranges, if you would like stats specifically for your neighbourhood, please contact us.
See Calgary Real Estate Stats Below

This chart shows the number of listings, sales, Benchmark Price and Months of Inventory for all sectors of the Calgary Real Estate Market for the last 2 months along with the change. Numbers are taken from the Calgary Real Estate Board Realtors Stats package.
Tags: Calgary Condo Market, Calgary Condo Prices, Calgary Real Estate Market, calgary real estate prices, YYC Real Estate
