What is really happening in the Calgary Real Estate Market? Yes, there is change on the horizon!
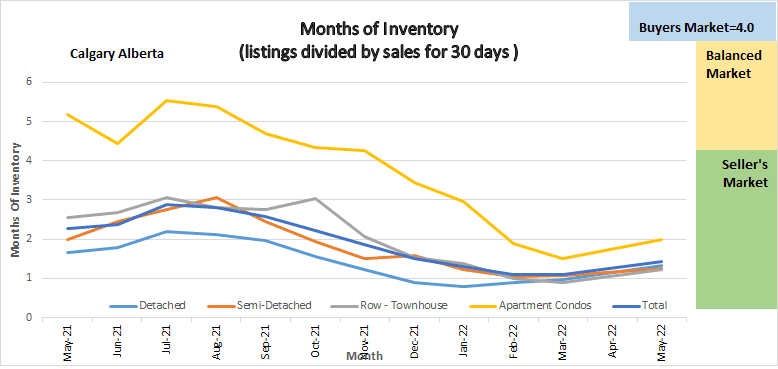
Following is a graph that shows the months of inventory for each housing sector. Looking at a one-year trendline gives you an indication of where things are really heading.
Gord’s commentary for the month (just my opinion).
March 2022 Highlights
- The direction of months of Inventory has changed and it is now increasing in all sectors – marginally!
- All Sectors of the Calgary Real Estate Market continue to be in a deep seller’s Market position
- Sales continue to be strong but are cooling from the highs we have had in recent months.
- Prices are still going up
- We are still running low on Inventory
- We are still seeing multiple offers, but the offers are now much more reasonable.
Calgary Listing Inventory
Listing inventory increased in all sectors combined by a total of 486 listings or 11.14%. The highest increase was in Detached homes at 12.2% and the lowest was in the Semi – Detached sector of 1.87%
Calgary Sales:
This is where the largest change has happened. Total Sales for the month dropped from last month by a total of 706 sales or 17.19%. The decrease was fairly consistent across all sectors.
Sales Compared to 2021:
Calgary home sales for April were just slightly higher than in April 2021 – by 197 Sales or 1.06%
| Jan | Feb | Mar | Apr | May | June | July | |
| 2021 | 1207 | 1831 | 2903 | 3204 | |||
| 2022 | 2009 | 3305 | 4107 | 3401 | |||
| Change | + 802 | 1474 | +1204 | +197 | |||
| % Change | + 66.4% | +180.5% | +141.5% | +1.06 |
| Aug | Sept | Oct | Nov | Dec | |
| 2020 | 1574 | 1702 | 1763 | 1438 | 1199 |
| 2021 | 2151 | 2162 | 2186 | 2110 | 1737 |
| Change | +577 | +456 | + 423 | +672 | +538 |
| % Change | 136.6% | 126.7% | 123.9% | 146.7% | 144.9% |
Calgary Real Estate Benchmark Sales Prices:
The benchmark price for all sectors increased combined increased by 1.56% or $8,100. The increase was consistent across all sectors.
Calgary Real Estate Benchmark Year to Date Sales Price: See chart below.
Year to date all sectors combined have increased by $62,800 or 13.54%. The highest increase (14.91%) was in the Detached home sector while the lowest increase was in the Apartment Condo sector (8.35%).
Current Months of Inventory (Absorption Rate):
The months of inventory increased in all sectors in April by an average of .36
All sectors were equal with the lowest increase (.18) being in the Semi-Detached sector.
What might 2022 bring: (again just my opinion)
Based on what I am seeing we are on our way towards a more balanced market although if the increase in months of inventory rises at the same rate that it has been it will take us between 2 to 3 months to hit balanced. Apartment condos may reach balanced within 1-2 months. With all sectors still in a Sellers Market position we will continue to see price increases – just not to the level it has been the last 3 months.
Tags: Calgary Condo Market, Calgary Condo Prices, Calgary Home Prices, Calgary Housing Market, Calgary Real Estate Market, Calgary Real Estate Market Snapshot May 2022
