Absorption Rate Dec. 2017
What is really happening in the Calgary Real Estate Market?
Stay ahead of everyone else by following our Monthly Market Snapshot of the Calgary Real Estate Market This shows what’s really happening! The market is driven by supply and demand so here we show the inventory (supply) and sales (demand) and most importantly the relationship between the two and how it affects the price of Calgary Real Estate. A simple way to keep up to date with how the market is trending and to stay ahead of most! All numbers are taken from the Calgary Real Estate Boards Stats package for Realtors. I have also included some general comments which are simply my opinion.
What is Absorption Rate (Months of Inventory) (the inventory divided by the number of sales in the last month). What does this mean you might ask?
| Buyer’s Market | >4.0 | Drives prices down |
| Balanced Market | Between 2.4 to 4.0 | Prices typically remain stable |
| Seller’s Market | <2.4 | Drives prices up |
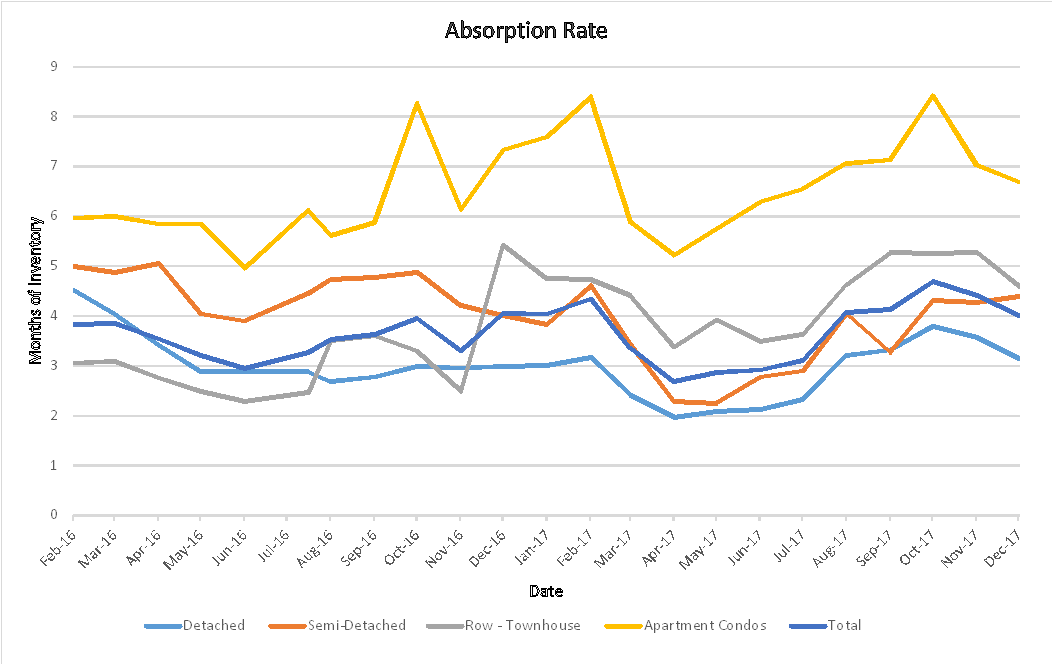
Current Absorption Rate
The Absorption rate for November decreased in all categories except Semi – Detached which rose a little. In my opinion this is mainly due to listings expiring and not due to sales. Either way this is good as it is keeping the market fairly balanced.
| Oct 2017 | Nov 2017 | Change | |
| Detached | 3.57 | 3.15 | -0.42 |
| Semi Detached | 4.27 | 4.40 | 0.13 |
| Attached – Row | 5.28 | 4.60 | -0.68 |
| Apartment | 7.03 | 6.69 | -0.35 |
| Total City | 4.41 | 4.01 | -0.39 |
Calgary Listing Inventory
In November all categories saw a decrease in the number of listings. This is normal for this time of year where people will let their listing expire and then put it back on in the new year.
| Inventory | Oct 2017 | Nov 2017 | Change |
| Detached | 3246 | 2758 | -488 |
| Semi Detached | 611 | 555 | -56 |
| Attached – Row | 967 | 861 | -106 |
| Apartment | 1639 | 1491 | -148 |
| Total City | 6463 | 5665 | -798 |
Calgary Sales:
Sales for November saw a small decrease overall. Attached Row homes are the only category to show an increase. Semi-Detached saw a rather large decrease and it’s my belief that this is simply listings expiring that will be relisted in January.
Of interest Calgary year to date sales are 15% above last year’s sales.
| Calgary Sales | Oct 2017 | Nov 2017 | Change | % Change |
| Detached | 908 | 875 | -33 | -3.63% |
| Semi Detached | 143 | 126 | -17 | -11.89% |
| Attached – Row | 183 | 187 | 4 | 2.19% |
| Apartment | 233 | 223 | -10 | -4.29% |
| Total City | 1467 | 1411 | -56 | -3.82% |
Calgary Real Estate Sales Prices:
Prices for November showed a slight decrease in Calgary. This in my opinion is mainly due to consumer confidence or lack of it.
| Sales Prices | Oct 2017 Benchmark Price | Nov 2017 Benchmark Price | Change |
| Detached | 506,200 | 504,000 | -2,200 |
| Semi Detached | 419,000 | 417,800 | -1,200 |
| Attached – Row | 305,000 | 303,100 | -1,900 |
| Apartment | 261,600 | 258,300 | -3,300 |
| Total City | 438,900 | 436,700 | -2,200 |
Sales Prices “Year to Date”
| Sales Prices | Jan 1, 2017 Benchmark Price | Nov 2017 Benchmark Price | Change
$ |
% Change |
| Detached | 498,700 | 504,000 | 5,300 | 1.06% |
| Semi Detached | 406,800 | 417,800 | 11,000 | 2.70% |
| Attached – Row | 302,600 | 303,100 | 500 | 0.17% |
| Apartment | 265,000 | 258,300 | -6,700 | -2.53% |
| Total City | 433,400 | 436,700 | 3,300 | 0.76% |
**Please note that these numbers include only Calgary homes and do change on a community basis and more so for towns. This report does not include rural properties. If you would like to find stats on your community just let me know.
Tags: Absorption Rate Calgary, Calgary House Prices, Calgary Housing Market, calgary real estate prices