What is really happening in the Calgary Real Estate Market?
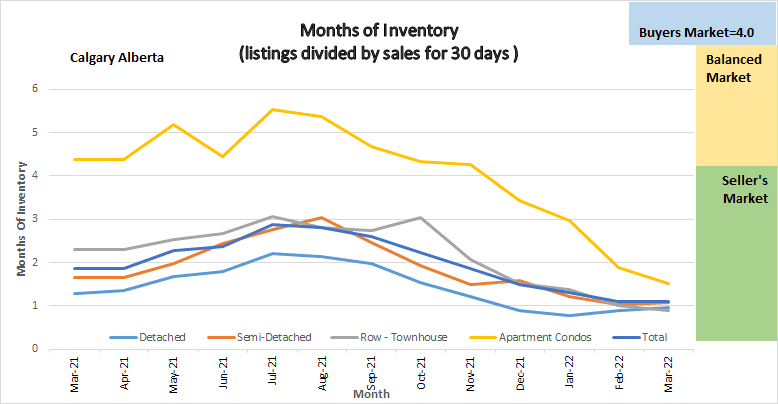
Following is a graph that shows the months of inventory for each housing sector. Looking at a one-year trendline gives you an indication of where things are really heading.
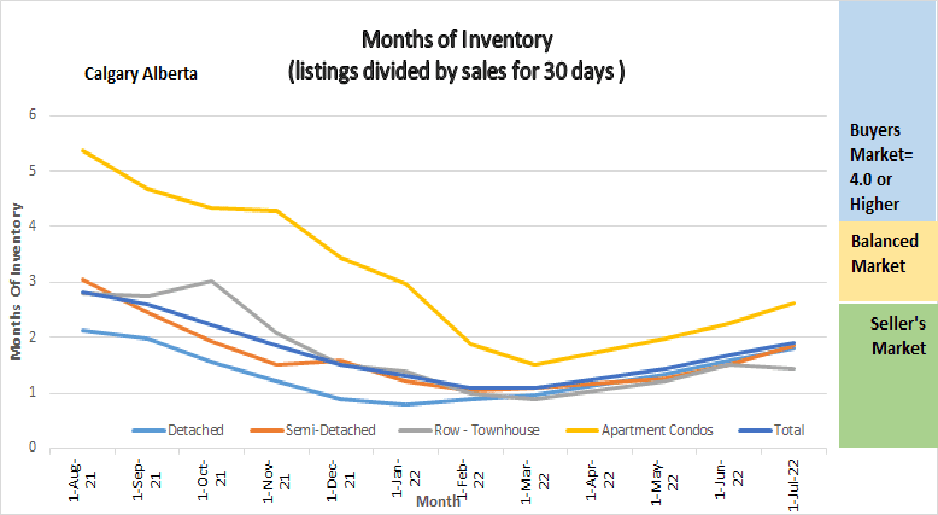
Months of Inventory
Gord’s commentary for the month (just my opinion).
June 2022 Highlights
- Inventory Increased marginally
- Sales decreased marginally
- All sectors are still in a seller’s market position except Apartment Condos which are in a balanced market position.
- Overall, we saw a marginal decrease in prices.
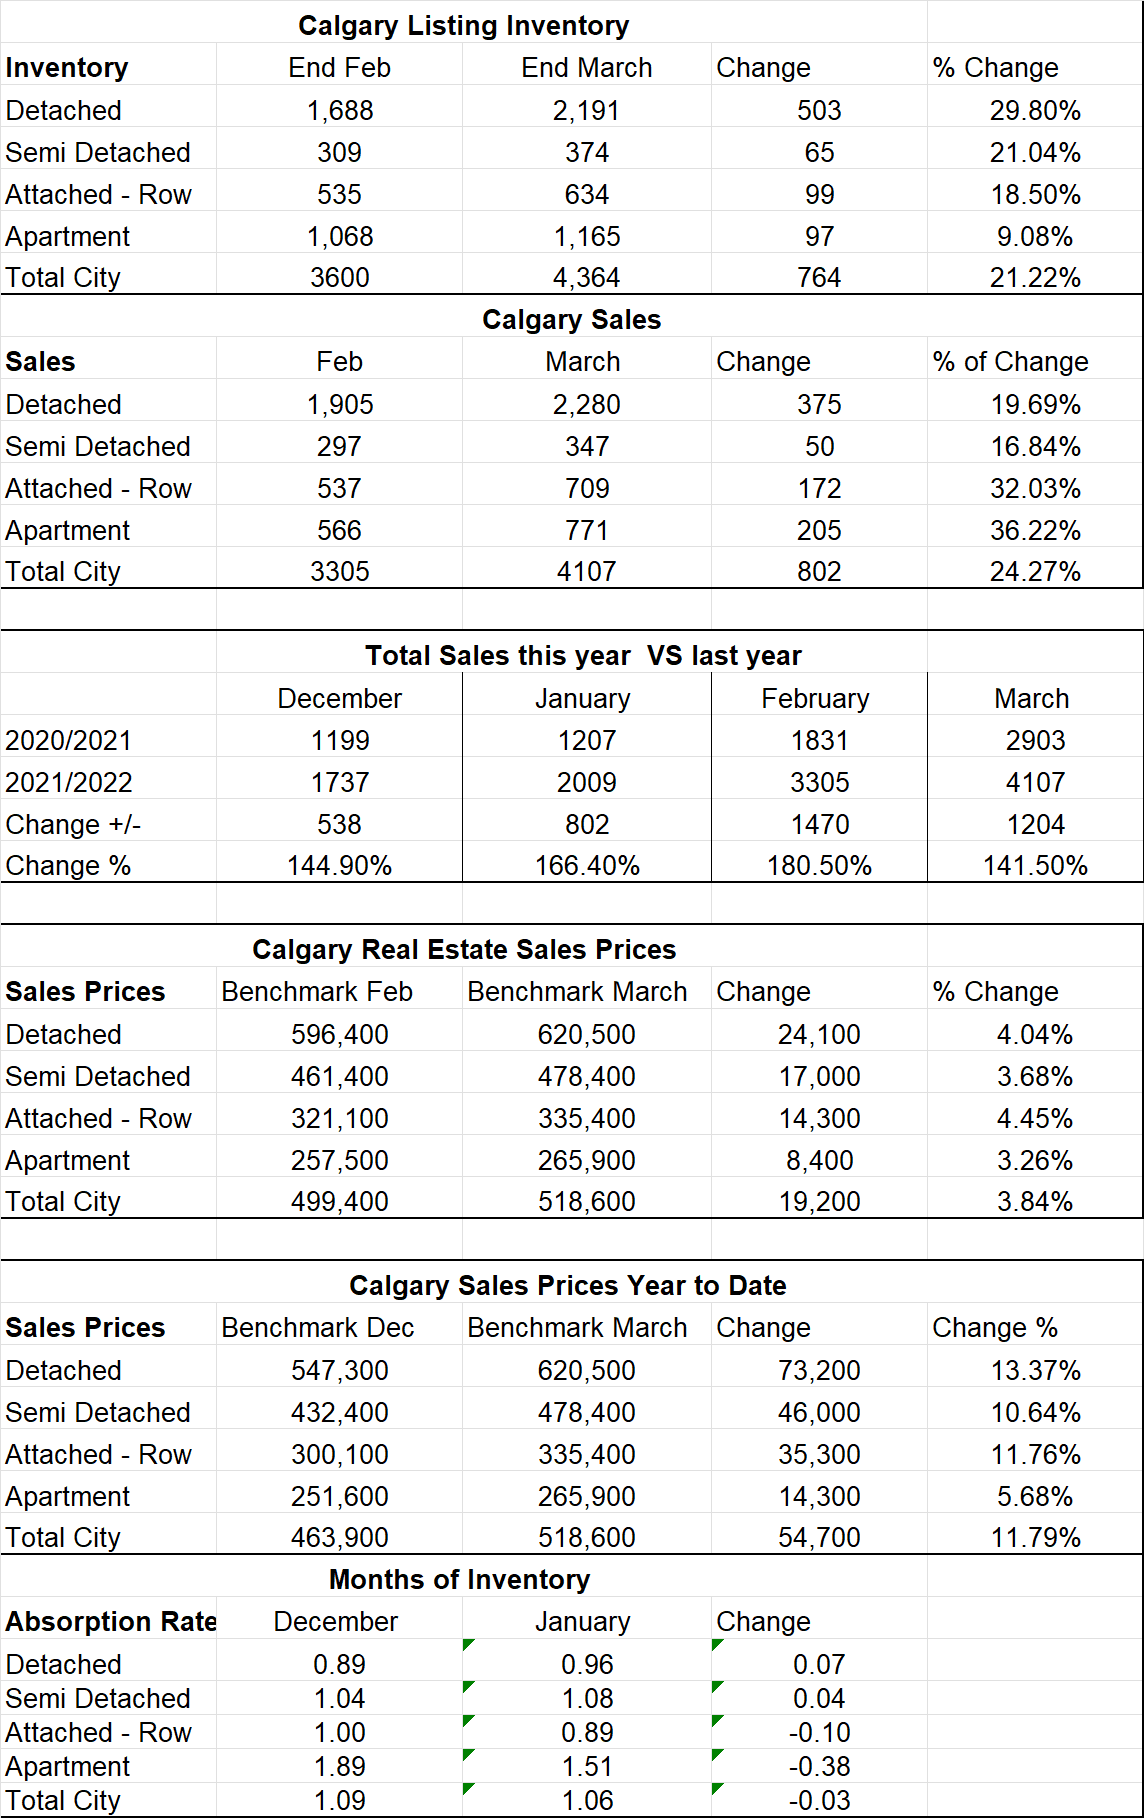
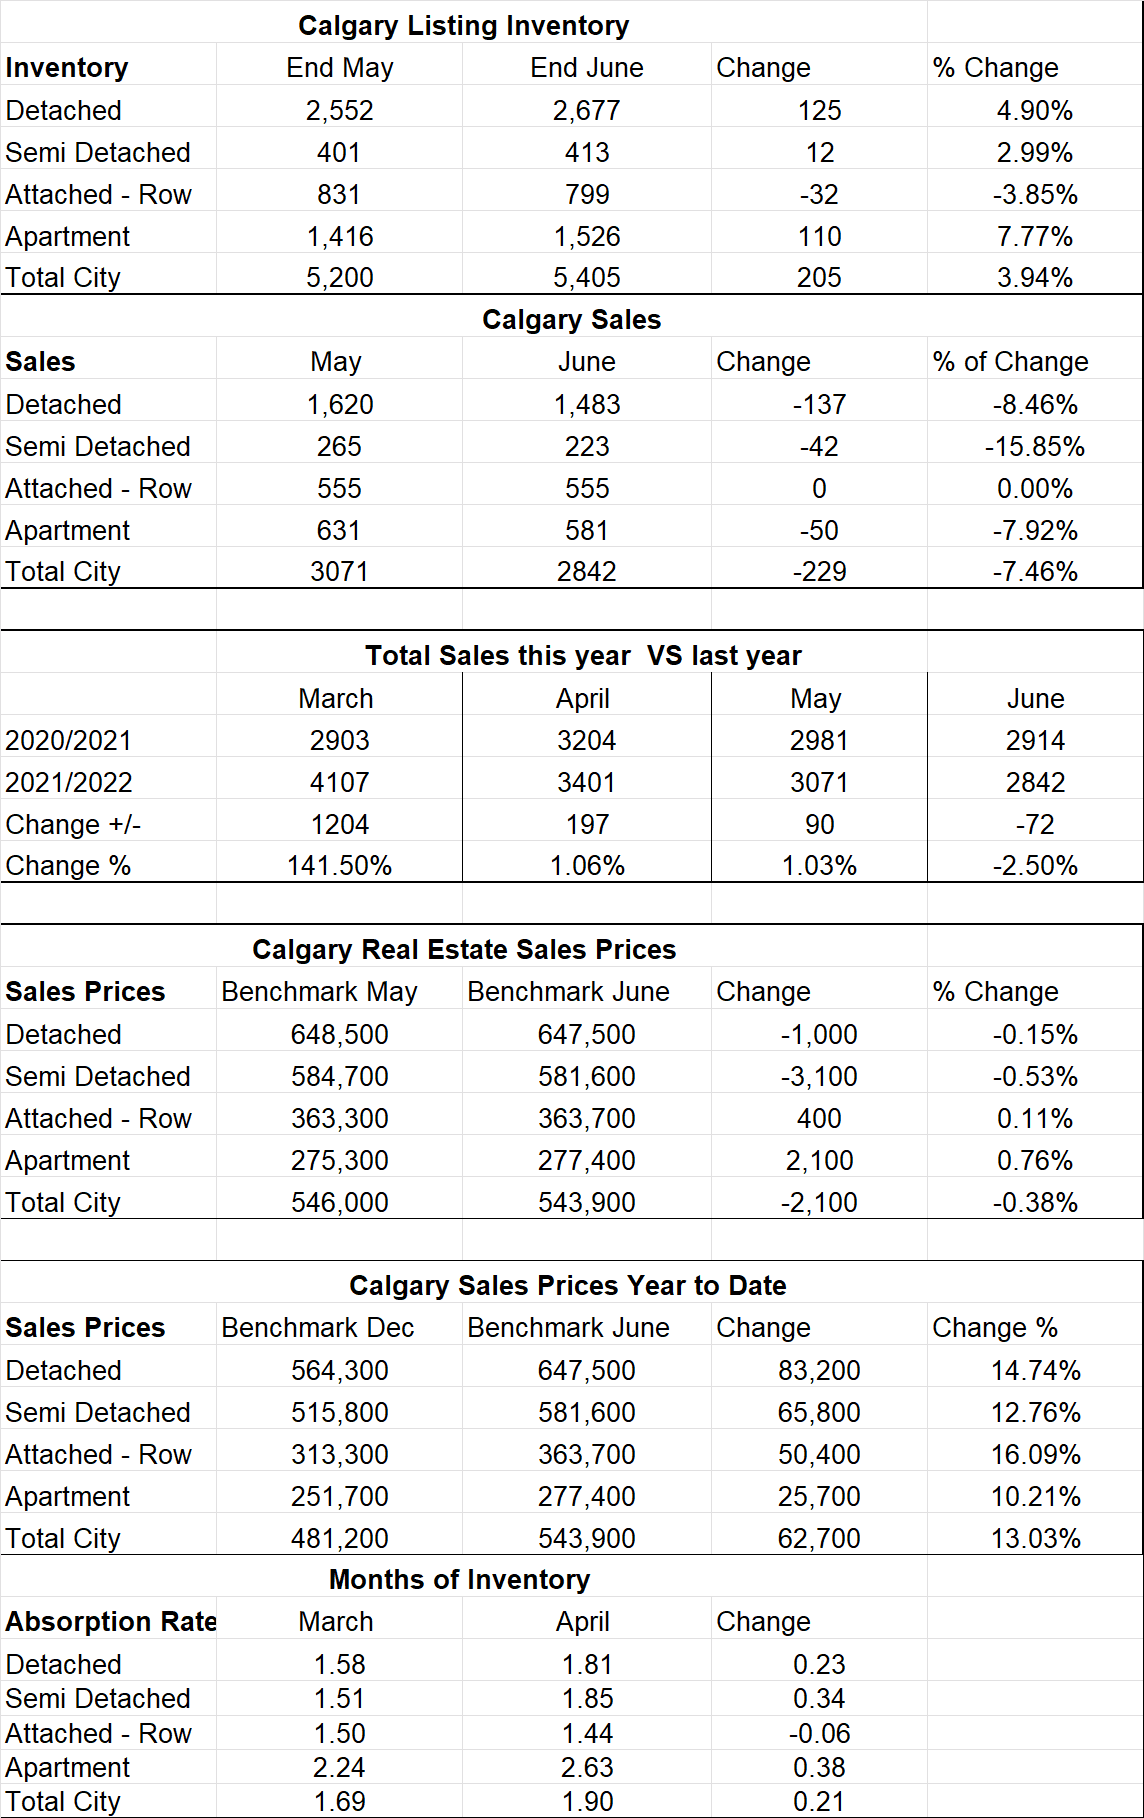
Calgary Listing Inventory
Listing inventory increased in all sectors combined by a total of 205 listings. Attached Row homes decreased by 32 while all other sectors increased.
Calgary Sales:
Sales in all categories decreased from May. The decrease for all sectors was only 229 less sales than May. The only sector that did not see a decrease is the Row Home sector and sales were even with last month.
Sales Compared to 2021:
Calgary home sales for June were just slightly lower than June of 2021. June sales this year were down by 72 over 2021 or 2.5%.
| Jan | Feb | Mar | Apr | May | June | July | |
| 2021 | 1207 | 1831 | 2903 | 3204 | 2981 | 2914 | |
| 2022 | 2009 | 3305 | 4107 | 3401 | 3071 | 2842 | |
| Change | + 802 | 1474 | +1204 | +197 | 90 | -72 | |
| % Change | + 66.4% | +180.5% | +141.5% | +1.06 | +1.03% | 2.5% |
| Aug | Sept | Oct | Nov | Dec | |
| 2020 | 1574 | 1702 | 1763 | 1438 | 1199 |
| 2021 | 2151 | 2162 | 2186 | 2110 | 1737 |
| Change | +577 | +456 | + 423 | +672 | +538 |
| % Change | 136.6% | 126.7% | 123.9% | 146.7% | 144.9% |
Calgary Real Estate Benchmark Sales Prices:
The benchmark price for all sectors combined decreased by $2100 for the month.
Calgary Real Estate Benchmark Year to Date Sales Price: See chart below.
Year to date all sectors have seen substantial increases with the highest increases being in the detached sector. See chart below for details.
Current Months of Inventory (Absorption Rate):
The months of continues to increase at a slow rate. Over all sectors, the months of Inventory increased by .21. The only sector bucking this trend is the Row House sector and it decreased marginally at .06.
What might the last half of 2022 bring: (again just my opinion)
Based on what I am seeing we are on our way towards a more balanced market. As noted above apartment condos have already entered balanced territory. If we keep up at the same pace, I estimate it will be September until we hit a balanced market position across the board. What is interesting is this is after mortgage rates went up which seems to be having little affect on the market so far. Time will tell, but Alberta’s economy seems to be doing much better and lots of people are moving to Calgary which may keep our market relatively strong compared to other parts of Canada.
Key Stats from the Calgary Real Estate Boards Stats Package.