Archive for the ‘Education’ Category

Calgary Real Estate Market Snapshot – Aug 1, 2023

Tuesday, August 1st, 2023

What is really happening in the Calgary Real Estate Market?


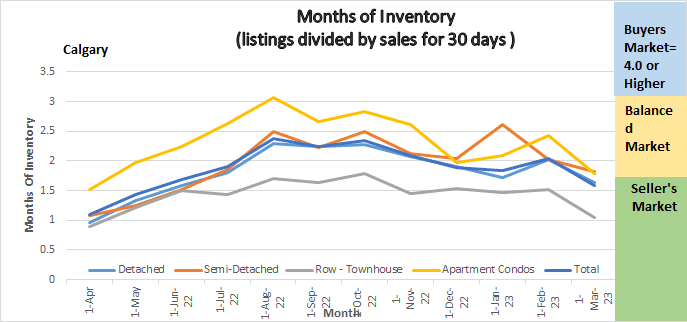
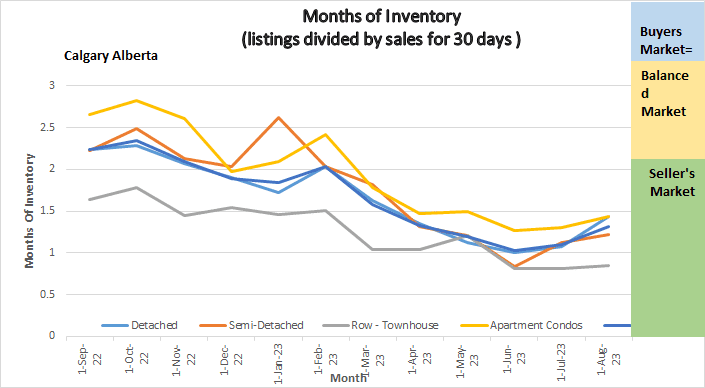
Following is a graph that shows the months of inventory for each housing sector. Looking at a one-year trendline gives you an indication of where things are really heading.

Months of Inventory


 Gord’s commentary for the month (just my opinion).

July 2023 Highlights

The Calgary Market is maintaining its strength, although there are signs of change on the horizon.

  • Sales were the strongest July on record.
  • Months of Inventory increased by .22 for the month.
  • We remain in a deep seller’s market.

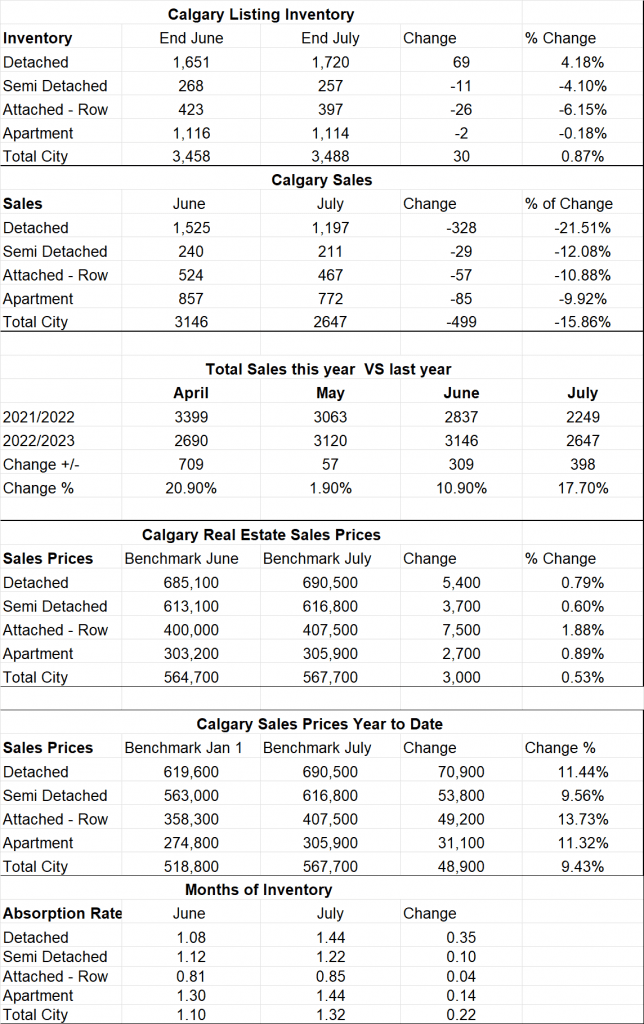
Calgary Listing Inventory

Our listing inventory remains very low with a total of 3488 listings on the market, an increase of 30 since July 1, 2023.  Its important to note that new listings are trending slightly up, but they are being absorbed so the inventory is not increasing at a pace we typically expect at this time of the year.

Calgary Sales:

Sales in July were 2647 making this the best July on record with the Calgary Real Estate Board.   Sales were down by 499 compared to June but it is normal that once we hit July sales decline every month until the end of the year.  What’s interesting is that sales were 309 higher than last year.


Sales Compared to 2022: 

It is also important to look at sales compared to the Previous year. Sales for April were 711 less than last year. Again, in my opinion this is simply due to not having enough Inventory on the market.

  Jan Feb Mar Apr May June July
2022 2004 3305 4091 3401 3071 2837 2249
2023 1199 1740 2432 2690 3120 3146 2647
Change -805 -1565 -1659 -711 +57 +309 +398
% Change -40.1% -47.4% -40.55% -20.9% +1.9% +10.9% +17.7%


Calgary Real Estate Benchmark Sales Prices:

The overall benchmark price continues to increase. The overall benchmark price increased by $3000 or .53%. The largest gain was in the Attached -Row sector with an increase of $7,500 which happens to be the same sector that saw the smallest increase in months of inventory.


Calgary Real Estate Benchmark Year to Date Sales Price:  See chart below.

For all of Calgary we have so far seen an increase in all sectors of 9.43% or $48,900. The lowest dollar increases so far has been apartment condos at $31,100 and the highest is Detached homes at $70,900.


Current Months of Inventory (Absorption Rate): 

Months of Inventory has increased for the second month in a row, which tells me that the direction is changing.  Our overall months of inventory is 1.32. Months of inventory below 2.5 indicates a seller’s market so we are still deep in a seller’s market.  The largest increase in Months of Inventory was in the Detached sector increasing by .35. Note the Attached-Row sector saw the smallest increase of .10.


My Prediction for what is ahead:  Based on what is driving demand (largely immigration) and I do not see that changing any time soon, I predict sales are going to remain strong and prices are going to continue to trend upwards although based on trends I see us slowly climbing out of the seller’s market.

*All numbers vary by community and price ranges, if you would like stats specifically for your neighbourhood, please contact us.

See Stats from the Calgary Real Estate Market Below
Calgary Real Estate Board Stats

Calgary Real Estate Market Snapshot for March 1, 2023

Wednesday, March 1st, 2023

What is really happening in the Calgary Real Estate Market?


Months of Inventory in the Calgary Real Estate Market

Months of Inventory in the Calgary Real Estate Market


Gord’s commentary for the month (just my opinion).

December 2022 Highlights

The Calgary Market is exploding again, as an agent I feel like I am reliving 2022!

  • Our inventory edged up slightly, yet it is still extremely low.
  • Multiple offers are being seen in all sectors with huge numbers of offers for Detached, Attached and Townhomes. Of course, they are selling well above list price.
  • Sales increased over January however if we had inventory sales would be much higher.


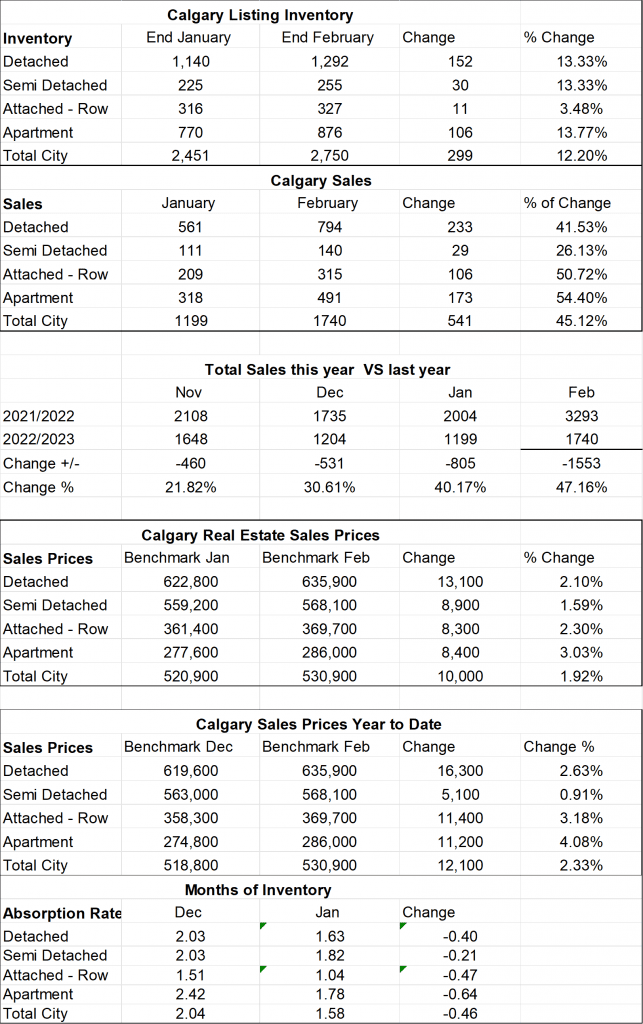
Calgary Listing Inventory

Listing inventory increase an overall of 12.2% in February.  Keep in mind that December is typically the lowest inventory months and the next several months you will see increases.


Calgary Sales:

Total Sale in February increased by 45.12% over January.  This is a substantial increase however it is also important to note that this increase is substantially higher that our inventory increase which is putting upward pressure on the market.


Sales Compared to 2022: 

It is also important to look at sales compared to the Previous year. Sales for February were down 47.4% when compared to last February of 2022. Although this looks like a substantial number, if we had more inventory sales would have been higher – it is a supply problem not low demand causing lower sales.


  Jan Feb Mar Apr May June July
2022 2004 3293 4107 3401 3071 2842 2254
2023 1199 1740
Change -805 -1553
% Change -40.1% -47.16%


Calgary Real Estate Benchmark Sales Prices:

The overall benchmark price increased by $1.92% in February.  The highest increase was in the Apartment Condo Sector, followed by the Attached Row Sector, Detached,

and then Semi Detached.


Calgary Real Estate Benchmark Year to Date Sales Price:  See chart below.

For all of Calgary we have so far seen an increase of 2.33% or $12,100.


Current Months of Inventory (Absorption Rate): 

The months of inventory decreased of.46 which is substantial.   This increase was about the same in all sectors except Semi-Detached homes which decreased by .21   Even with the slight increase every sector is currently in a seller’s market position with the Attached-Row sector being the lowest months of inventory at 1.04


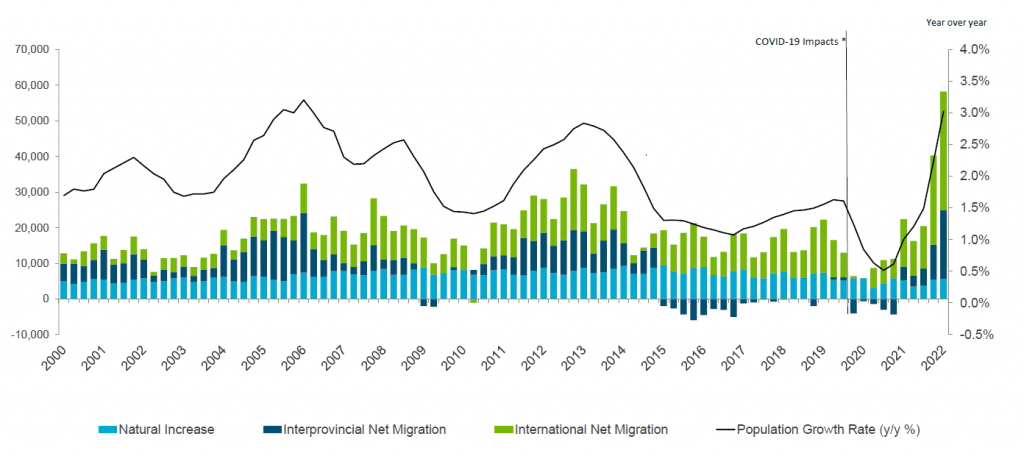
Question: Why is Calgary’s Real Estate Market so different from the rest of Canada.

Answer: Immigration

The number of people moving to Alberta is huge, here is a start from the Alberta Government.

Population

Below is a summary of numbers in chart form. All numbers are taken from the Calgary Real Estate Boards monthly Stats package.

All numbers vary by community and price ranges, if you would like stats specifically for your neighborhood, please contact us.

Calgary Real Estate Board Stats


Prevent Water Damage in your home!

Friday, September 2nd, 2022

In Real Estate, every day we run into Poly B Plumbing which was used in all homes built in Calgary between the early 1970’s and late 1990’s.  Poly B plumbing is proven to be prone to leaks.  It is interesting that some homes with Poly B plumbing leak and other homes with the same Poly B plumbing do not leak.  If you research Poly B plumbing you will find a huge number of opinion on why it is prone to leaking and what to do.

How do I know if I have Poly B in my Home

Poly B plumbing is easily identifiable. Go to either your furnace room or simply look under any one of your sinks.  Poly B plumbing is  grey in color. If any of your plumbing is grey you likely have Poly B plumbing.

What to do if I have Poly B?

Some people just decide to take the chance that theirs will not leak.  Others remove all the Poly B plumbing in their home and replace with the new standard of plumbing.  The cost to replace depends on the size and style of your home along with if the basement is developed or not.  Estimated I have heard go from $4000.00 to $15,000 and this is just the plumbing and does not include any holes you will need to repair in your drywall.

Another Solution

It is my understanding that leak prevention systems are now widely available.  The system connects close to the source (main water) and will detect if there is a leak. When a leak is detected it will shut off the water to your home preventing major water damage.  Your local plumber will be happy to install and they are relatively inexpensive.  If you have Poly B plumbing in your home I recommend you call your local plumber today and have one installed.


Calgary Real Estate Market Snapshot – April 1, 2022

Friday, April 1st, 2022

Another month of record sales and sharp price increases!

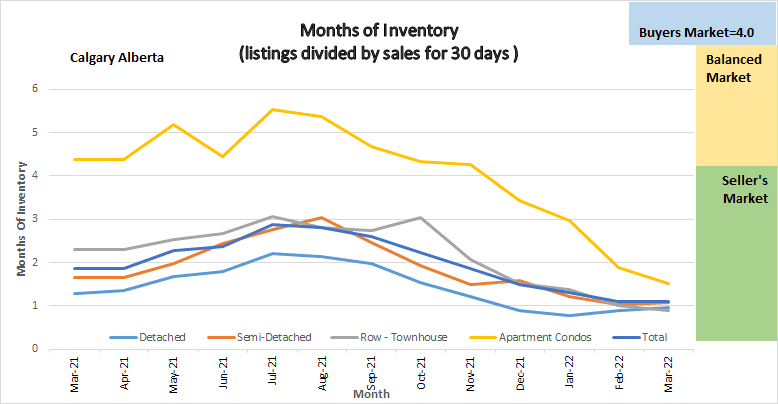
Following is a graph that shows the months of inventory for each housing sector. Looking at a one-year trendline gives you an indication of where things are really heading.

Months of Inventory

Graph shows the months of Inventory, for each sector in the Calgary Real Estate market for the last year so we can all see the trends.


Gord’s commentary for the month (just my opinion).

2022 Highlights

  • All Sectors of the Calgary Real Estate Market continue to be in a deep seller’s Market position
  • We continue to set monthly sales records.
  • Prices are going up, quickly
  • We are still running extremely low on Inventory
  • Although new listings were 24% higher than last year total inventory only increased by 759 or 21%.
  • All homes no matter what style are either going into multiple offers or are selling in a week.

Calgary Listing Inventory

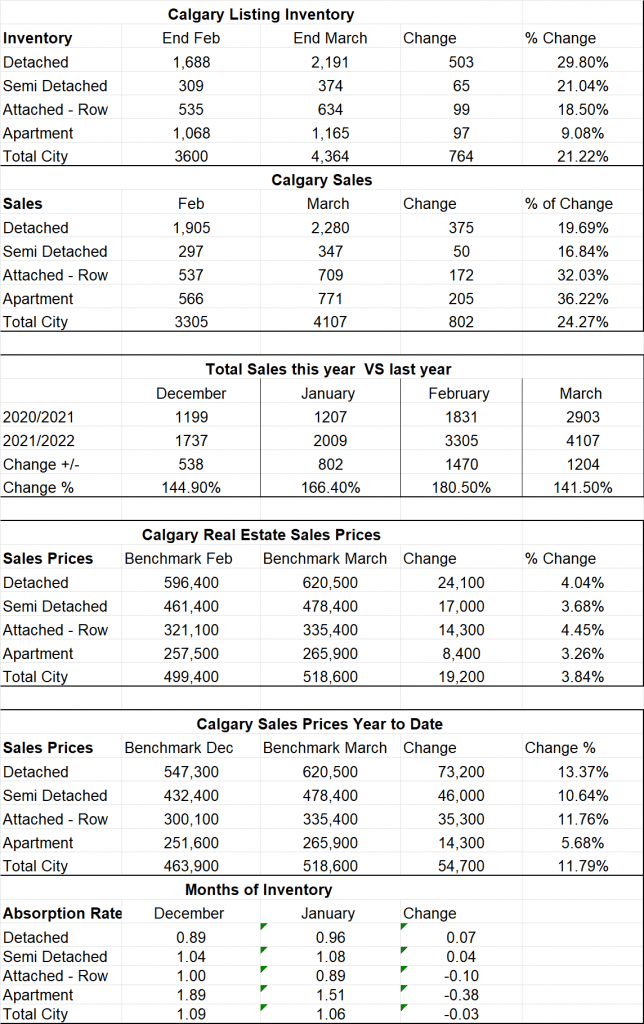
Listing inventory increased in all sectors combined by a total of 764. Apartment condominiums saw the lowest inventory increase at 9.1% while all other sectors were between 18.5% to 29.8%.

 Calgary Sales:

Overall sales were 24.3% higher than in February. For the second month in a row, sales activity not only reached a monthly high but also hit new record highs for any given month. Gains occurred across every property sector, and they all hit new record highs.

Sales Compared to 2021:  This puts things into Perspective

Calgary home sales for March were 41.5% higher than total sales in March of 2021.


  Jan Feb Mar Apr May June July
2021 1207 1831 2903
2022 2009 3305 4107
Change + 802 1474 +1204
% Change + 66.4% +180.5% +141.5%


  Aug Sept Oct Nov Dec Year to Date
2020 1574 1702 1763 1438 1199 16,149
2021 2151 2162 2186 2110 1737 27,686
Change +577 +456 + 423 +672 +538 11,537
% Change 136.6% 126.7% 123.9% 146.7% 144.9% 171.4%


Calgary Real Estate Benchmark Sales Prices:

The benchmark price for all sectors increased in February.

Detached home sector increased by $24,100 or 4.04%

Semi-detached increased by $17,000 or 3.68%

Attached Row increased by $14,300 or 4.45%

Apartment Condos increased by $8,400 or 3.26%%


Calgary Real Estate Benchmark Year to Date Sales Price:  See chart below.

Year to date all sectors combined have increased by $54,700 or 11.79%


Current Months of Inventory (Absorption Rate): 

The months of inventory in the detached sector increased marginally by .07 while the Semi-Detached sector increased by .04

The months of inventory decreased in the Attached -Row sector by .38 and in the Apartment sector by .03

The overall months of inventory decreased by .03 so this leaves the entire market in a Seller’s Market position.


What might 2022 bring: (again just my opinion) – The same as last month.

We are now very deep into a seller’s market. As inventory increases (which typically happens in Mar to may) I believe the market will soften but, in the meantime, I believe we will see more substantial price increases. Many people are asking me why this is all happening, and I have some thoughts:

  • Since 2015 sales have been low compared to the 10-year average so there is pent up demand
  • Alberta’s economy is showing signs of improvement
  • There are a substantial number of people moving here from Vancouver and Ontario

It is also important to note that these numbers vary by community, and by price range. If you would like numbers for your community, or more specific numbers for your home please  contact us.

Below is a summary of numbers in chart form. All numbers are taken from the Calgary Real Estate Boards monthly Stats package.

Stats from the Calgary Real Estate Board

This chart contains key numbers from the Calgary Real Estate Boards Stats package for Agents. Numbers include inventory, sales, months of inventory and prices for all sectors of the Calgary Real Estate market.

Just Listed: 3033 Edenwold Heights NW

Thursday, December 3rd, 2020

Outstanding opportunity in Edgecliffe Estates.  This top floor unit is priced to sell and is a great starter home or  investment.  Open Concept living, a corner kitchen with newer appliances. Living room features a gas fireplace and leads to your covered balcony that faces the mountains.  Bedroom is spacious.  Unit provides In Suite laundry with room for storage.  Complex offers great amenities including a pool, hot tub, exercise room and a social room with a pool table. Fantastic location just 2 minutes to Nose Hill Park, perfect for your outdoor exercise, close to U of C, Children’s hospital, Market mall.

MLS # A1052766

More Information Here 

Attention First Time Home Buyers & Investors

Calgary Real Estate Market Snapshot – Dec 1, 2020

Tuesday, December 1st, 2020

What is really happening in the Calgary Real Estate Market?

The market is simply a result of Supply and Demand therefore we look at both Supply (inventory) and Demand (Sales) and the relationship between the two.  We also update you on the current benchmark price for all housing sectors.

Following is a graph that shows the months of inventory for each housing sector.  Looking at a 2-year trendline gives you and indication of where things are really heading.

2 Year Graph showing months of Inventory.

Following is a summary of what I deem to be the most important numbers.  Again, we look at Total Inventory, Sales for the past 30 days, Months of Inventory and of course the benchmark price.  All numbers are taken from the Calgary Real Estate boards monthly stats package.

Calgary Real Estate Board Stats


Gord’s commentary for the month (just my opinion).

Calgary Listing Inventory

Our total listing inventory dropped in all sectors with inventory decreasing by 805 listings or a 13.8% drop from October. This is simply a normal seasonal adjustment and we can expect listings to drop further through December.

Calgary Sales:

November sales decreased in all sectors.  The largest drop was in detached homes and it dropped by 256 sales or 22.48% from October.  The total decrease was 327 sales less or a decrease of 18.54%.  As with inventory, sales declining in November is strictly a seasonal adjustment and we will see a further decline in December.

 Sales Compared to 2019:

It is critical to note that in all my other numbers I look at month over month.  This chart below shows us the numbers this year compared to last year.   Although November sales slowed, we were still 327 sales higher than last year or 25.4% higher.


  Jan Feb Mar Apr May June July Aug Sept Oct Nov Dec
2019 801 973 1327 1544 1915 1775 1642 1580 1365 1438 1146 858
2020 861 1195 1175 573 1080 1747 1835 80 1702 1764 1437  
Change +60 +222 -152 -971 -835 -28 +194 -7 337 +326 +327  
% change +7.49 +22.8 -11.4 -62.8 -45.5 -1.6 +11.82% N/A 24.87% +22.67% +25.4%  


Calgary Real Estate Benchmark Sales Prices:

For the 4th month in a row we saw the Benchmark Sales price in Calgary increase. The overall increase was $3,600.  All sectors except Apartment Condos increased.  Apartment Condo sector decreased by $3,200.


Calgary Real Estate Sales Prices Year to Date

Since the beginning of the year

Detached homes increased by $11,900

Semi-Detached homes increased by $1,000

Attached Row houses decreased by $800.

Apartment Condos decreased by $3,000


Current Months of Inventory (Absorption Rate): 

The months of Inventory decreased in Semi-detached homes by .24

Every other sector saw a small increase in the Months of Inventory.

It is also important to note that these numbers vary by community, and by price range.  If you would like numbers for your community contact us.   For example, many communities if I look at listings under $500,000. they are showing being in a Sellers Market position and are getting competing offers.

Calgary Real Estate Market Snapshot for June 2020

Thursday, July 2nd, 2020

What is really happening in the Calgary Real Estate Market?  Everything you need to know at a glance.

What is really happening in the Calgary Real Estate Market?

The market is simply a result of Supply and Demand therefore we look at both Supply (inventory) and Demand (Sales) and the relationship between the two.  We also update you on the current benchmark price for all housing sectors.

Following is a graph that shows the months of inventory for each Sector.  Looking at a 2-year trendline gives you and indication of where things are really heading.

2 year Market Trend


Following is a summary of what I deem to be the most important numbers.  Again, we look at Total Inventory, Sales for the past 30 days, Months of Inventory and of course the benchmark price.  All numbers are taken from the Calgary Real Estate boards monthly stats package.

A quick look at key numbers in the Calgary Real Estate Market.


Gord’s commentary for the month (just my opinion).

Much to everyone’s surprise the Calgary Real Estate market has come back as quickly as it declined with Covid-19.

Calgary Listing Inventory

Our listing inventory increased in all sectors.  The good news is that inventory increase less than sales.  Keeping our inventory in check is important in keeping balance in the market.

Calgary Sales:

June’s sales increased by a whopping 61.76% over may sales.  Again, this increase was in all sectors.  All sectors increases were in the 60% range except Semi Detached where the increase was less at 47.24%

Sales Compared to 2019:

It is critical to note that in all my other numbers I look at month over month.  This shows us the numbers this year compared too last year.  In June, our sales ended at 1.6% less than last year.   It is important to note that total sales in the first week of June were only at 301.  By the last full week of June we 492 sales so if all weeks were as strong as the last week we would have blown out last years sales.  Another interesting note is 492 is the highest number of sales in a week since June 2017.

One last mote on sales:  CMHC ( the government’s mortgage insurance company) changed the qualifying rules and the change came into effect as of July 1, 2020 so some people may have jumped into the market before this change came in.

  Jan Feb Mar Apr May June July Aug Sept Oct Nov Dec
2019 801 973 1327 1544 1915 1775 1642 1574 1365 1440 1146 858
2020 861 1195 1175 573 1080 1747
Change +60 +222 -152 -971 -835 -28
% change +7.49 +22.8 -11.4 -62.8 -45.5 -1.6


Calgary Real Estate Sales Prices:  In my opinion fairly good considering Covid.

Detached homes increased by $500.

Semi-Detached decreased by $1,800

Attached Row increased by $100

Apartment Condos Decreased by $1,700

Total Market decreased by $300


Calgary Real Estate Sales Prices Year to Date

Sorry to report that all sectors have declined in year to date pricing. The lowest decline is in Semi-Detached at .62%  The largest decrease was in Apartment Condos and they lost 3.18%

 Current Months of Inventory (Absorption Rate): 

At the end of June all sectors except apartment condo are less than 4.0 months of Inventory so all are in a balanced market. Apartment condos were a 6.79 which is a good improvement from 10.13 at the end of May.

It is also important to note that these numbers vary by community, and by price range.  If you would like numbers for your community contact us.


Relocating to a Different Town or City

Tuesday, June 16th, 2020

Moving around the corner or even across town is relatively simple because you are likely familiar with the various neighborhood’s and you can access them anytime. If there’s a listed home you want to view, you can simply go see it. Relocating to a different town or city, however, is much more challenging. It may not be possible for you to make multiple visits to see homes for sale. You may also be unfamiliar with the various neighborhood’s.  So what do you do if you want to move out-of-town or need to relocate due to work?

Your first step is to get the information you need.

  • You’ll want up-to-date data on the neighborhood’s so you can pinpoint the ones that are the best fit for your needs and lifestyle.
  • You’ll also want to get a sense of the types of homes for sale in those neighborhoods — style, size, features, listing price, etc.
  • A conversation with a Local agent can be a wealth or information.
  • Once you have an idea of area’s of interest have your agent set you up on a listing’s search – If you have time do this 3 -6 months early so you get a sense of prices in neighborhoods.

Your next step is to schedule a day (or more)  to view homes.  Remember buying a home is a huge investment so its wise to not rush the process. This visit must be carefully planned so you only see those properties that are likely to be of interest. You don’t want to travel all that way only to end up seeing properties you wouldn’t likely buy. What a waste of time!

So, if you’re relocating, you’ll need help. Give me a call. I can help make the relocation go smoothly for you.

When a Home Inspector Finds an Issue!

Saturday, April 25th, 2020

Imagine you’ve found the perfect home. You love it. You’ve made an offer that’s been accepted. So far so good! The only catch? You’ve wisely made the offer conditional on passing a professional home inspection. What happens if that home inspection reveals a major issue? First, you should know that, depending on the age of the property, a home inspection will typically turn up at least a few areas of concern. The inspector might find loose insulation in the attic that is thinning out or roofing shingles that will need replacing in two or three years. Issues like those are not usually deal-breakers. However, if the home inspector finds a major issue — such as old wiring that’s worn and presents a safety concern — then you’re facing a potentially high cost of repair should the deal go through. In a situation like that, as your real estate agent, I will address the issue with the seller,  through the seller’s agent. Since neither of you will want to lose the deal, the seller often agrees to get the repair done at his own expense or, have some or all of the estimated repair cost deducted from the sale price. Will the deal be in jeopardy? Usually not. In most cases, if you have a real estate agent like me working in your best interests, it all works out.

Just Listed 301, 823 19 Avenue SW Calgary T2T 0H6

Wednesday, March 18th, 2020

Just listed this awesome  2 bed condo in Lower Mount Royal

MLS: C4291694

View our Video Tour @ https://youtu.be/Ehvkwy_Xy9A

Welcome to Larch Manor, a quiet, concrete building on a beautiful tree-lined street in desirable Lower Mount Royal. Enjoy the walkability (walk score of 89) and convenience of all the shops, restaurants and nightlife of 17th Avenue. This renovated 2-bedroom unit offers an open floor plan, spacious bedrooms, large closets, a kitchen with granite countertops, and plenty of cabinet space along with a breakfast bar and dining area. The living room features updated laminate flooring and access to your balcony for those beautiful summer evenings. Some unique features include an in-unit storage room with a combo washer/dryer and a mostly covered parking stall. The condo is professionally managed, pet friendly and offers bike storage inside on the main level. Recent building upgrades include new roof (2015) and new flooring and paint in all common areas. Book your viewing today!