What is really happening in the Calgary Real Estate Market?
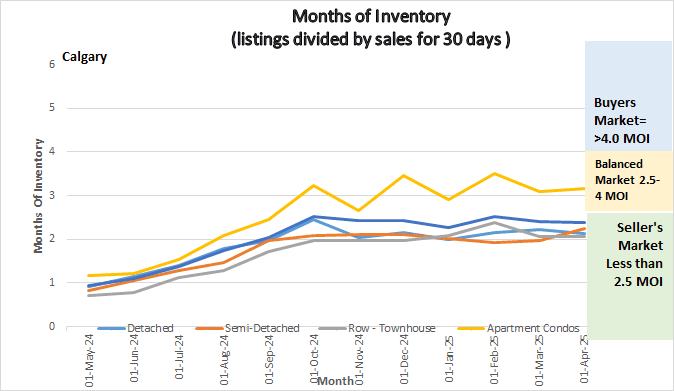
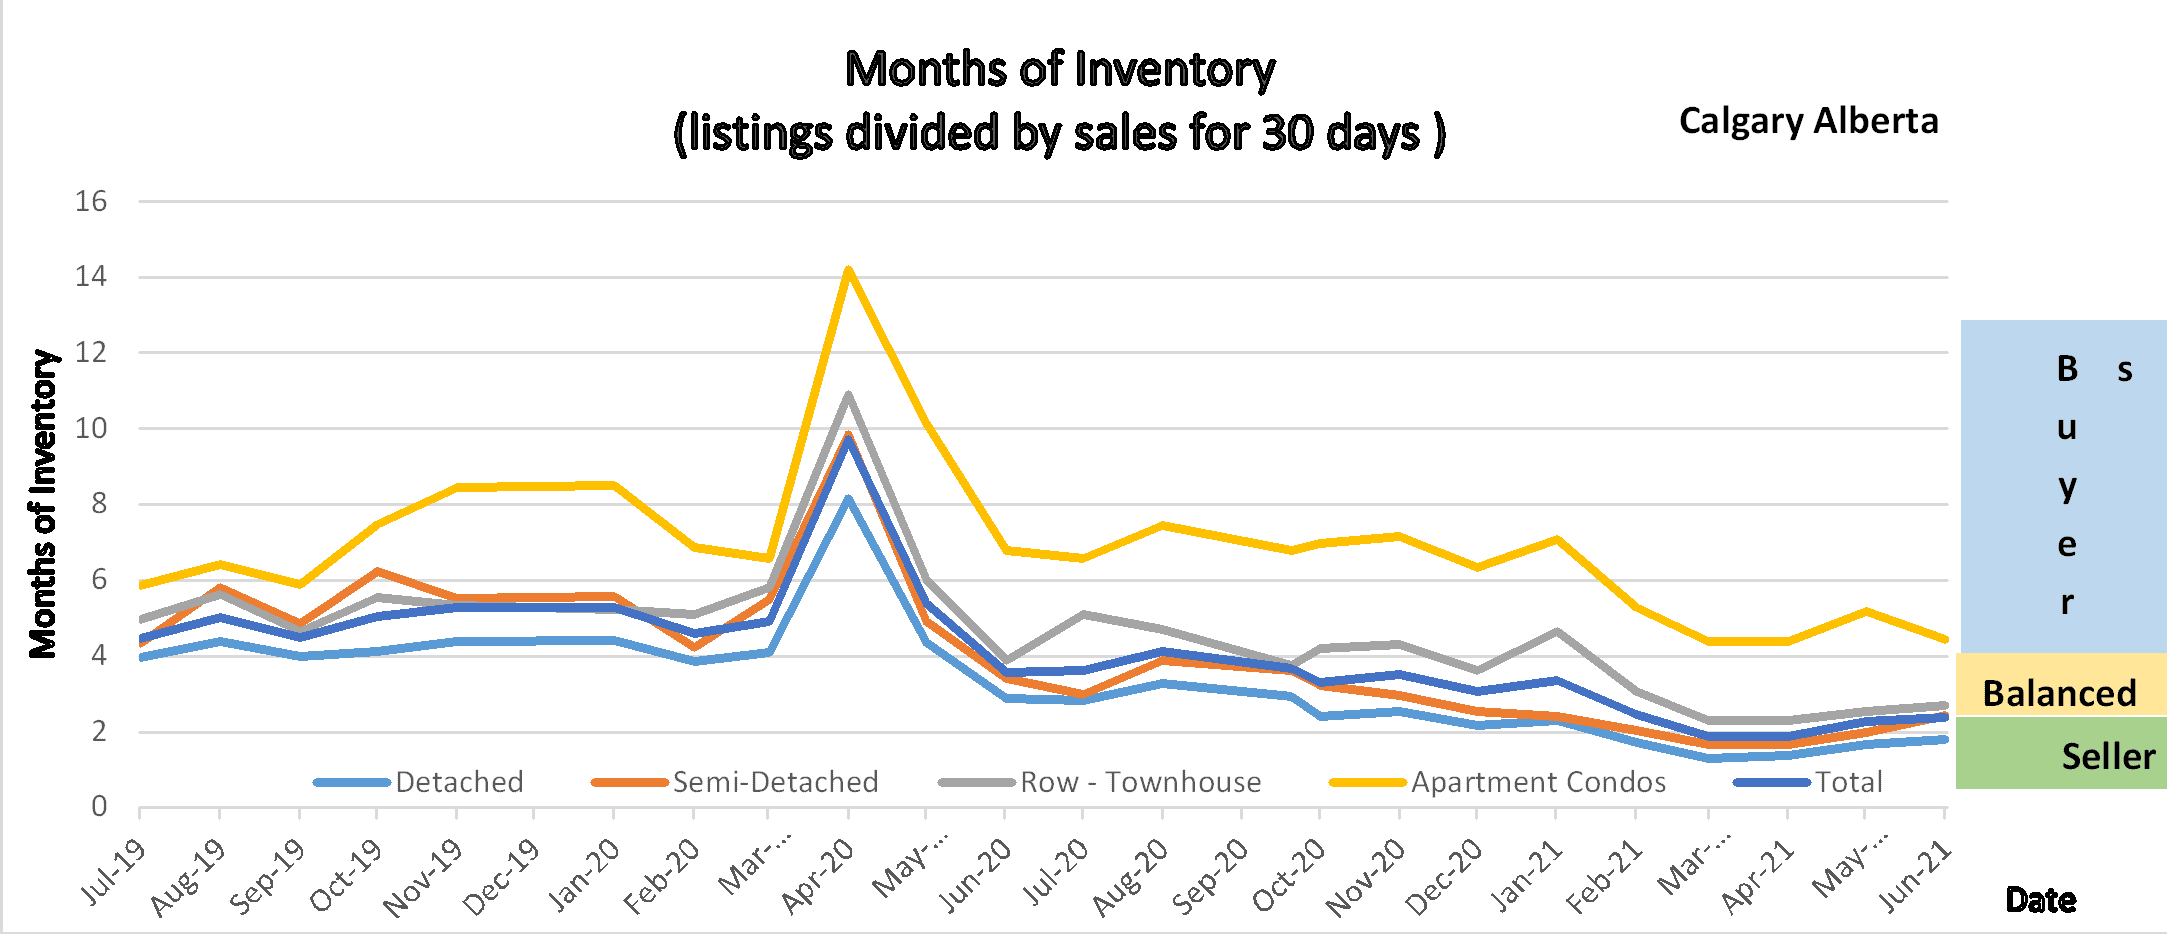
The following graph shows the months of inventory for each housing sector. Looking at a one-year trendline gives you an indication of where things are really heading. Notice the trend for Apartment Condos – Yellow line.
Graph shows the months of inventory for all sectors in the Calgary Real Estate Market
Gord’s commentary for the month (just my opinion).
October 1, 2025, Highlights
The cooling trend continues with inventory up and sales down. Of course, this leads to a higher Months of Inventory and price decreases across all Sectors.
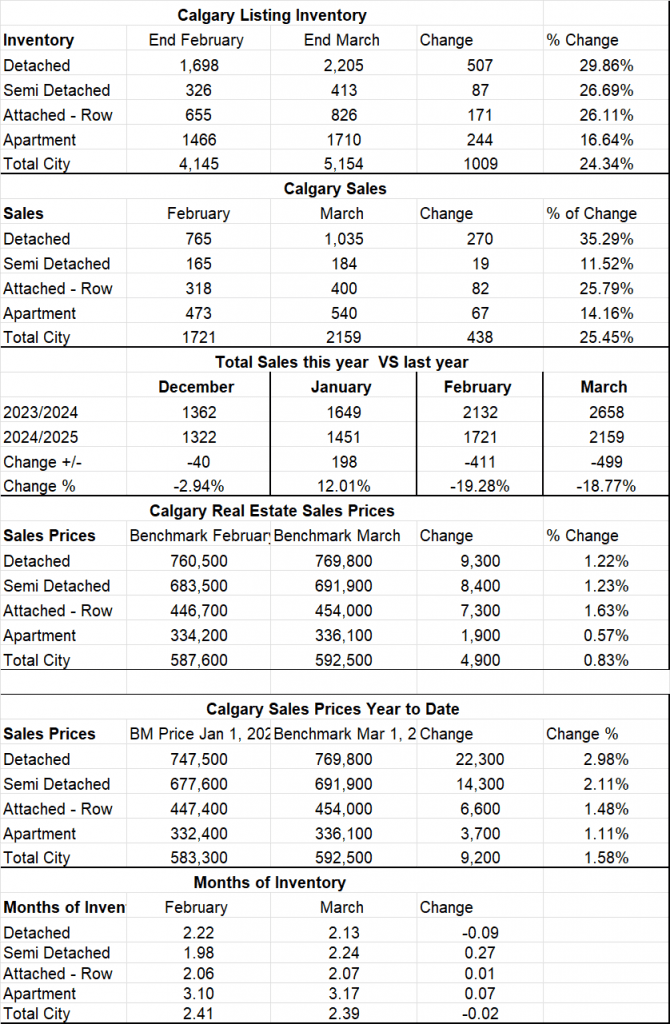
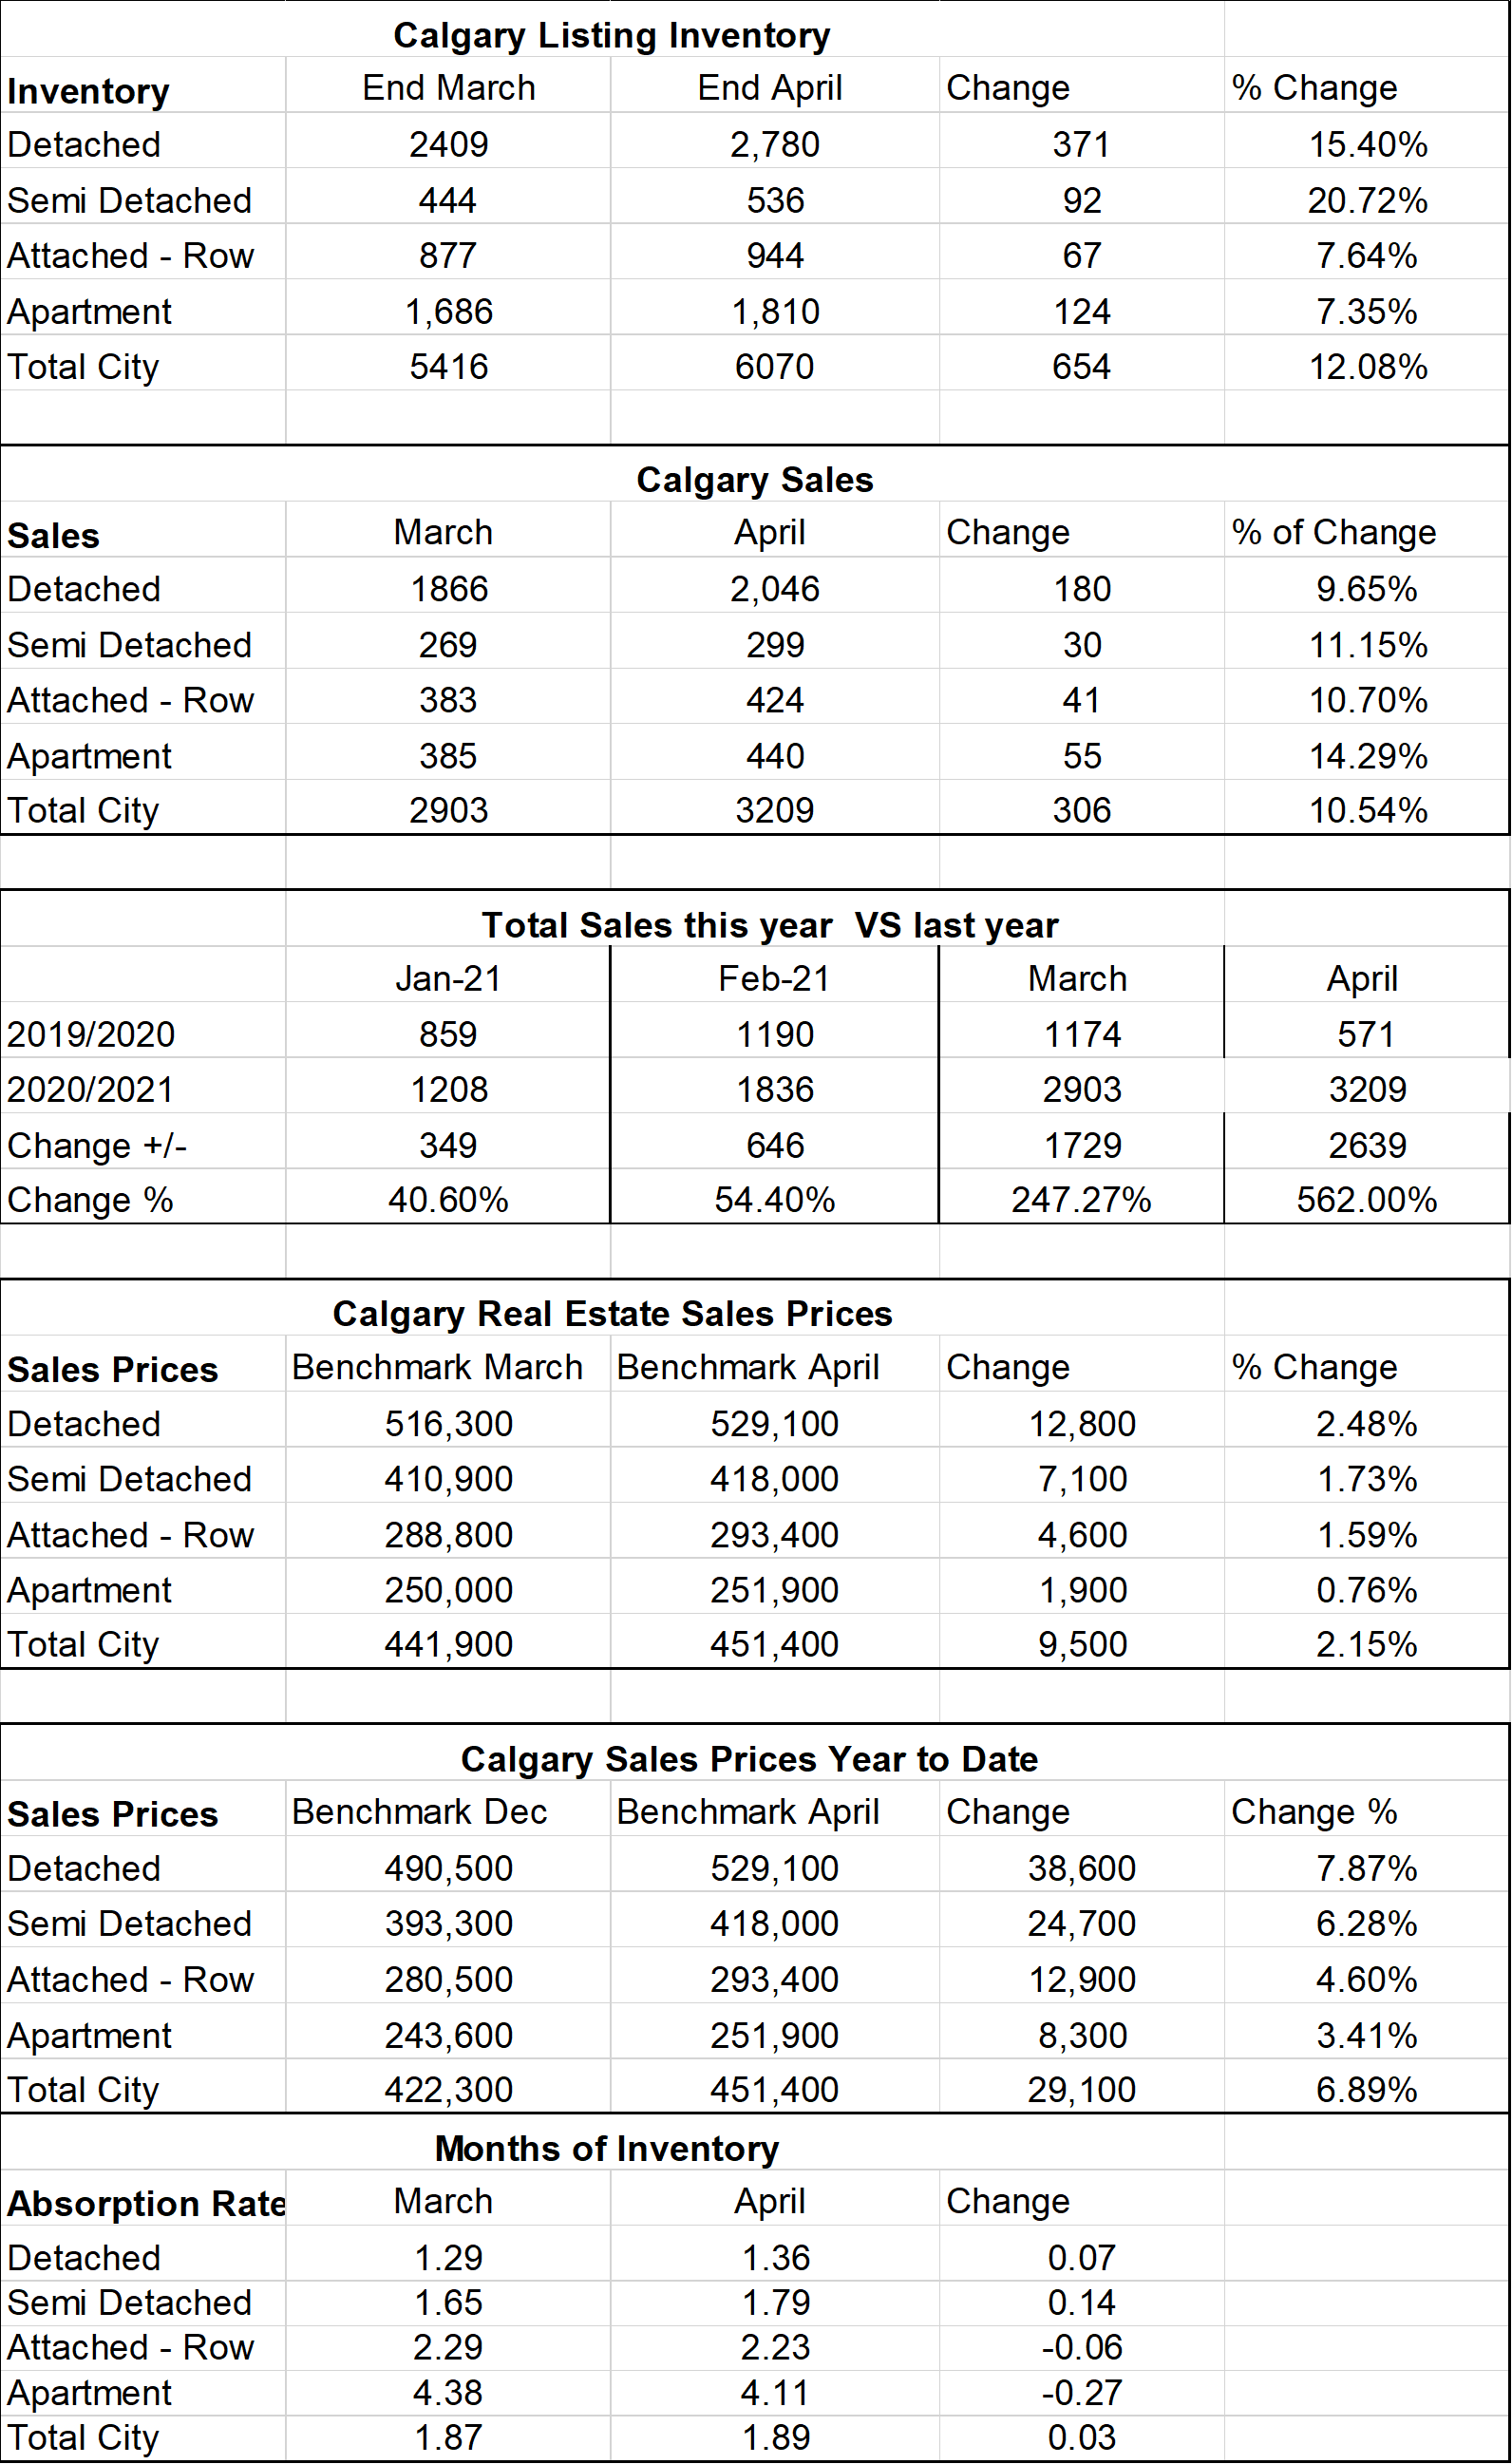
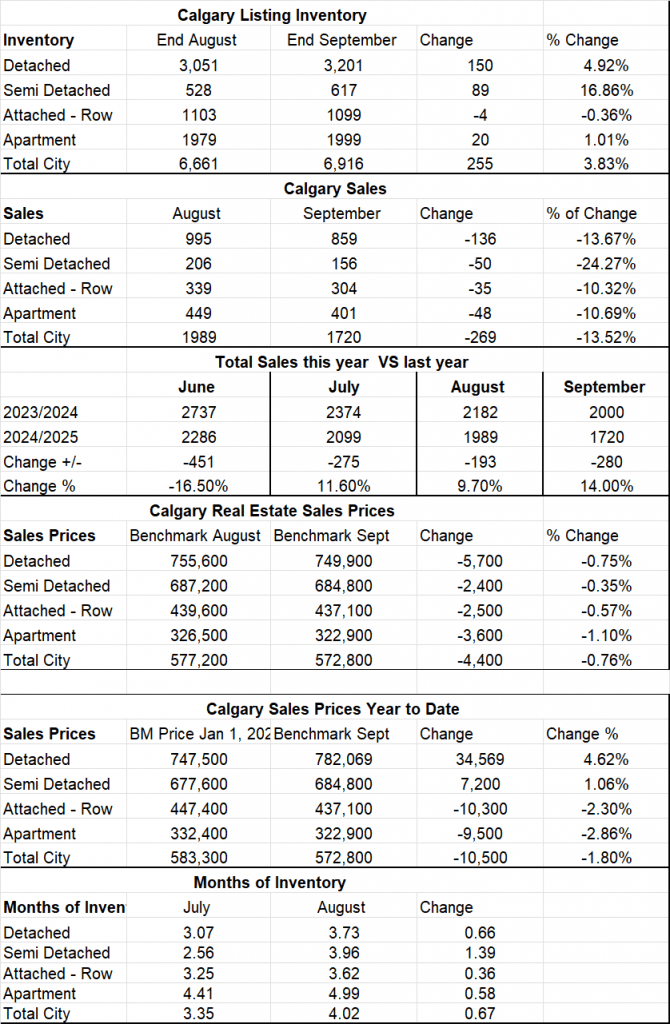
Calgary Listing Inventory
In September, our listing inventory increased marginally by 3.83% or 255 listings. The largest increase was in detached homes (4.92% and Semi-Detached (16.86%). The only sector to decrease was Attached Row Homes by four listings.
Calgary Sales
August reported a decline of 13.52% in sales from August. A portion of this is normal as sales always decline as we near the end of the year however this is a significant decline, and it put us under the long-term average for the first time in a long time.
Sales Compared to 2024:
September saw a decline in sales from August (14%.). This is higher than the last 3 months of 9.7%, 11.6% showing that the market continues to cool.
| April | May | June | July | August | Sept | |
| 2024 | 2876 | 3090 | 2374 | 2374 | 2182 | 2000 |
| 2025 | 2236 | 2568 | 2286 | 2099 | 1989 | 1720 |
| Change | -640 | -522 | 88 | -275 | -193 | -280 |
| % Change | -22.25% | -16.89 | -.04 | -11.6% | -9.7% | -14. % |
Calgary Real Estate Benchmark Sales Prices:
The overall Benchmark price for August decreased by .76% The lowest decrease was in the Semi-Detached sector at .35% and the highest price decline was in the Apartment Condo sector at -1.1%.
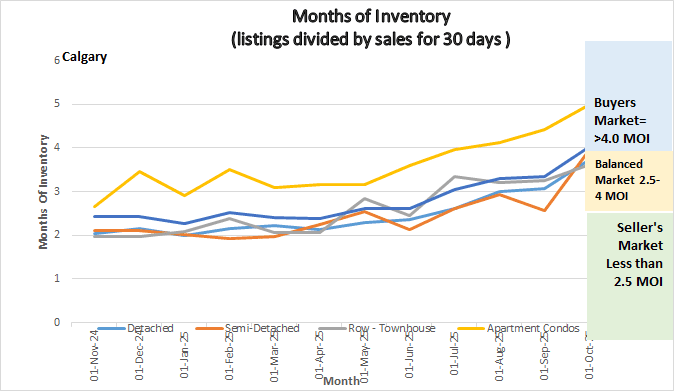
Current Months of Inventory (Absorption Rate):
The total months of Inventory from Sept 1 to Oct 1 climbed by .67 This puts the entire market in a buyer’s market position. The smallest increase was in the Attached Row sector (.36), and the highest change was in the Semi-Detached sector (1.39)
My Prediction for what is ahead:
In the short term (3-6 months), I believe, based on our trend is that we will continue to see our months of Inventory increase slightly every month which will put the entire market into a more balanced territory with prices decreasing slightly. What is interesting is when you look at specific communities some are up, and some are down. It is important to note that the Apartment Condo sector now has Months of Inventory at almost five which is the highest we have seen in a couple of years.
*Below is a summary of numbers in chart form. All numbers are taken from the Calgary Real Estate Boards monthly Stats package.
* All numbers vary by community and price ranges, if you would like stats specifically for your neighbourhood, please contact us.
A Summary of the Calgary Real Estate Board Realtors Stats