What is really happening in the Calgary Real Estate Market?
Following is a graph that shows the months of inventory for each housing sector. Looking at a one-year trendline gives you an indication of where things are really heading.
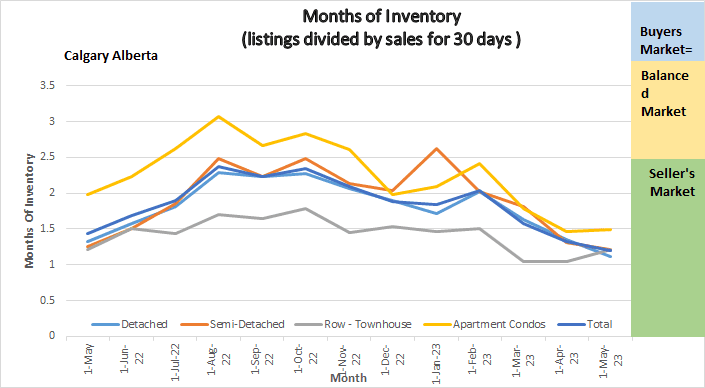
Months of Inventory
Gord’s commentary for the month (just my opinion)
April 2023 Highlights
The Calgary Market is continuing at a blistering pace!
- New listings declined again. We had 3183 compared to 4885 last year.
- Inventory is still Low – We are at our lowest inventory level since 2007.
- Benchmark prices increased in all sectors for a total of $9,000.
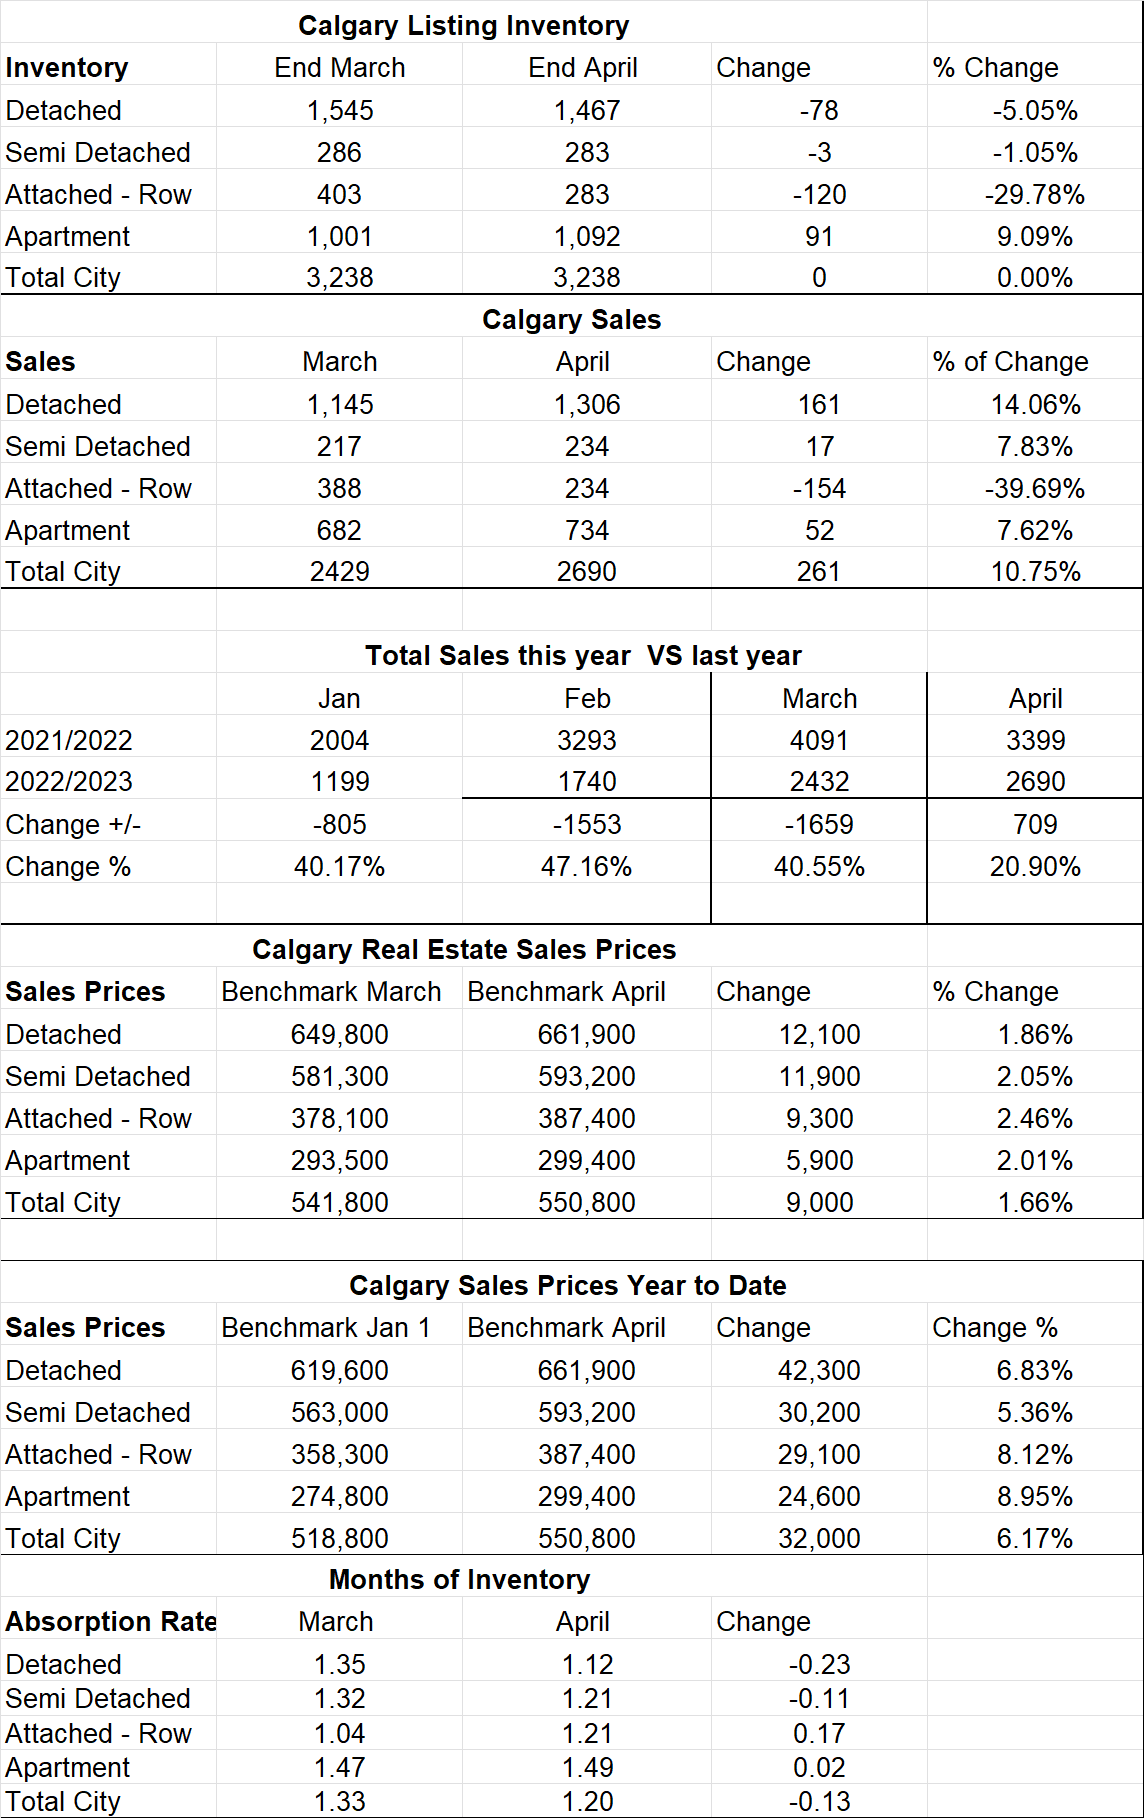
Calgary Listing Inventory
Listing Inventory is identical to last month, this is concerning as normally at this time of year our listing inventory increases and this year it is remaining flat. It seems like everything we list is getting sold almost immediately.
Calgary Sales:
Sales increased over last year by 261 this month. Sales for Attached Row homes declined by 154 (again this is due to having no listings to sell). All other sectors increased marginally.
Sales Compared to 2022:
It is also important to look at sales compared to the Previous year. Sales for April were 711 less than last year. Again, in my opinion this is simply due to not having enough Inventory on the market.
| |
Jan |
Feb |
Mar |
Apr |
May |
June |
July |
| 2022 |
2004 |
3305 |
4091 |
3401 |
3071 |
2842 |
2254 |
| 2023 |
1199 |
1740 |
2432 |
2690 |
|
|
|
| Change |
-805 |
-1565 |
-1659 |
-711 |
|
|
|
| % Change |
-40.1% |
-47.4% |
-40.55% |
-20.9% |
|
|
|
Calgary Real Estate Benchmark Sales Prices:
The overall benchmark price increased in all sectors with the overall increase being $9,000 or 1.66%. The increase was similar in all sectors. It is my opinion that until our Inventory situation changes, we will continue to see increases like this.
Calgary Real Estate Benchmark Year to Date Sales Price: See chart below.
For all of Calgary we have so far seen an increase of 6.17% or $32,000. The lowest dollar increase so far has been apartment condos at $24,600 and the highest is Detached homes at $42,300.
Current Months of Inventory (Absorption Rate):
Months of Inventory decreased in the Detached and Semi-Detached sectors and increased slightly in the Attached-Row and Apartment sectors.
My Prediction for what is ahead: Being that we are in a deep Sellers Market, we will continue to see prices increasing. As we have seen all new inventory get sold right away and no net gain, I have to predict this trend is going to continue for the next several months.
All numbers vary by community and price ranges, if you would like stats specifically for your neighbourhood, please contact us.
Below is a summary of numbers in chart form. All numbers are taken from the Calgary Real Estate Boards monthly Stats package.

Calgary Real Estate Stats May 1, 2023