What is really happening in the Calgary Real Estate Market?
The market is a result of Supply and Demand therefore we look at both Supply (inventory) and Demand (Sales) and the relationship between the two. We also update you on the current benchmark price for all housing sectors.
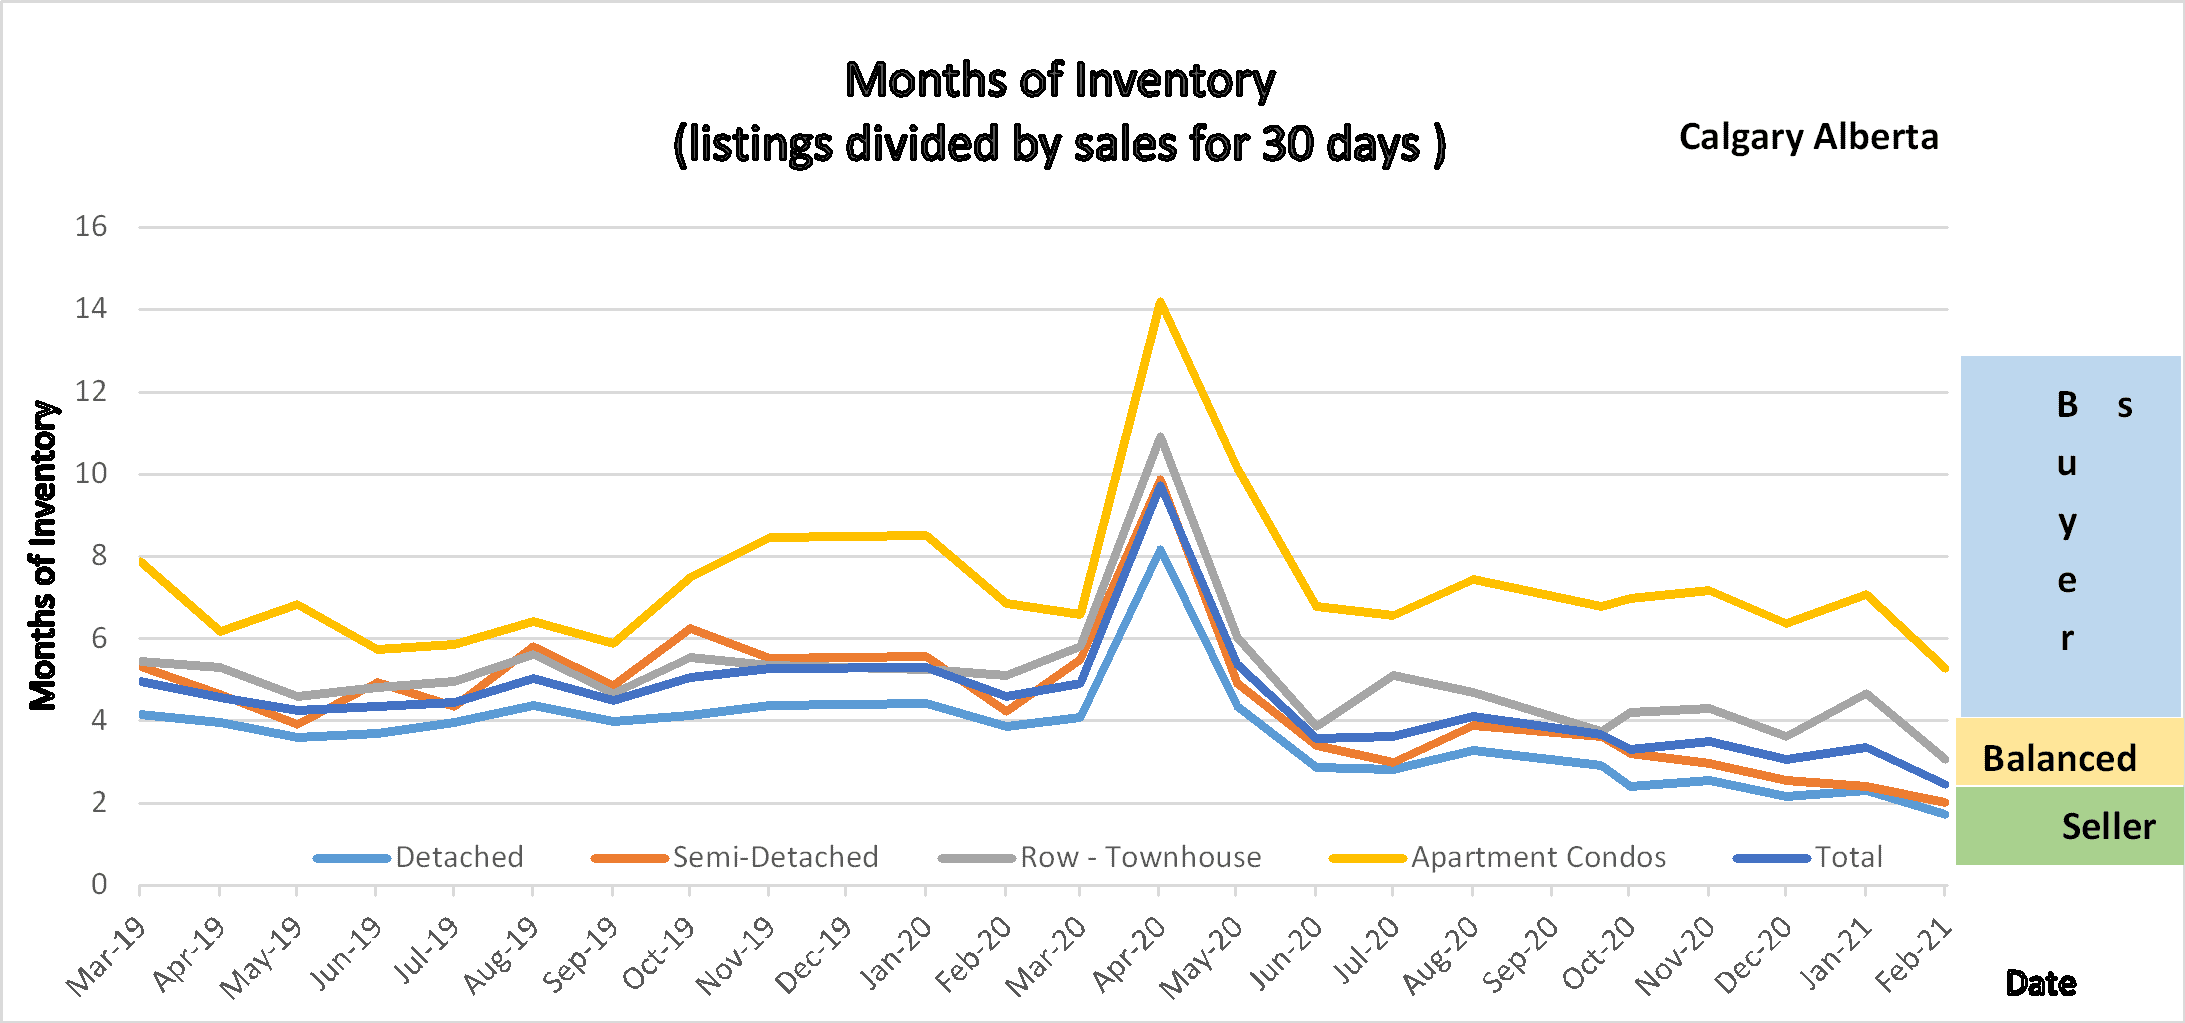
Following is a graph that shows the months of inventory for each housing sector. Looking at a 2-year trendline gives you an indication of where things are really heading.
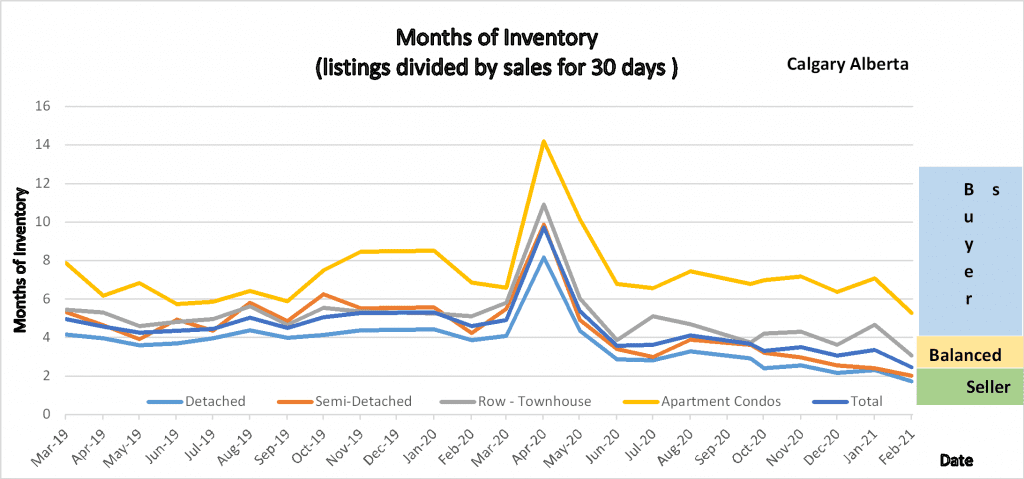
2 year trend of Months of Inventory for the Calgary Real Estate market for all Housing Sectors.
Gord’s commentary for the month (just my opinion).
With Detached homes setting the pace the Calgary Real Estate Market is seeing sales numbers we have not seen since 2014. I have had a lot of people ask the question WHY?
Following are just my thoughts on the why:
- Low-Interest Rates According to Rate Hub a 5-year mortgage can be had at 1.64% – Crazy Low.
- According to data from ATB the Job losses Alberta has seen have been in the lower wage groups. Higher wage jobs are in positive territory compared to a year ago.
- There has recently been some positive news in the Oil & Gas Sector.
- With Vaccine’s coming there is a little more of a positive vibe out there.
Calgary Listing Inventory
We saw an increase in all Sectors in listing inventory. This is very normal and as we approach spring the listing inventory will continue to rise.
Calgary Sales:
Calgary Sales were the highest they have been since 2014. The highest increases were in
Attached Rowhomes: 73.33% increase over last February.
Detached homes 53.63% increase over last February.
Apartment Condo: 46.24% Increase over last February
Sales Compared to 2020:
This is where it gets interesting. As you can see sales in February 2021 beat sales in February 2020 by 54.4%
| |
Jan |
Feb |
Mar |
Apr |
May |
June |
July |
Aug |
Sept |
Oct |
Nov |
Dec |
| 2020 |
861 |
1190 |
1175 |
573 |
1080 |
1747 |
1835 |
80 |
1702 |
1764 |
1437 |
1199 |
| 2021 |
1208 |
1836 |
|
|
|
|
|
|
|
|
|
|
| Change |
+347 |
+646 |
|
|
|
|
|
|
|
|
|
|
| % change |
+7.49 |
+54.4 |
|
|
|
|
|
|
|
|
|
|
Calgary Real Estate Benchmark Sales Prices:
Overall, the Benchmark Price for all sectors increased by $8,800. Detached homes increased by $12,000 (the largest) and the smallest which was Apartment Condos which still increased by $2,899.
Current Months of Inventory (Absorption Rate):
The months of inventory decreased in all housing sectors. From the smallest to largest decrease the change was:
Semi-Detached -.38 Now in Seller Market Territory
Detached -.59 Now in Seller Market Territory
Attached Row: -1.6 Now in Balanced market territory.
Apartment: – 1.81 Still in Buyer’s market territory
Sales compared to last February are up by 54.4% so even though inventory is rising the increase in sales is much higher than the increase in listings pushing us to lower months of inventory and into a seller’s market for some sectors.
It is also important to note that these numbers vary by community, and by price range. If you would like numbers for your community contact us.
Below is a summary of numbers in chart form. All numbers are taken from the Calgary Real Estate Boars monthly Stats package.
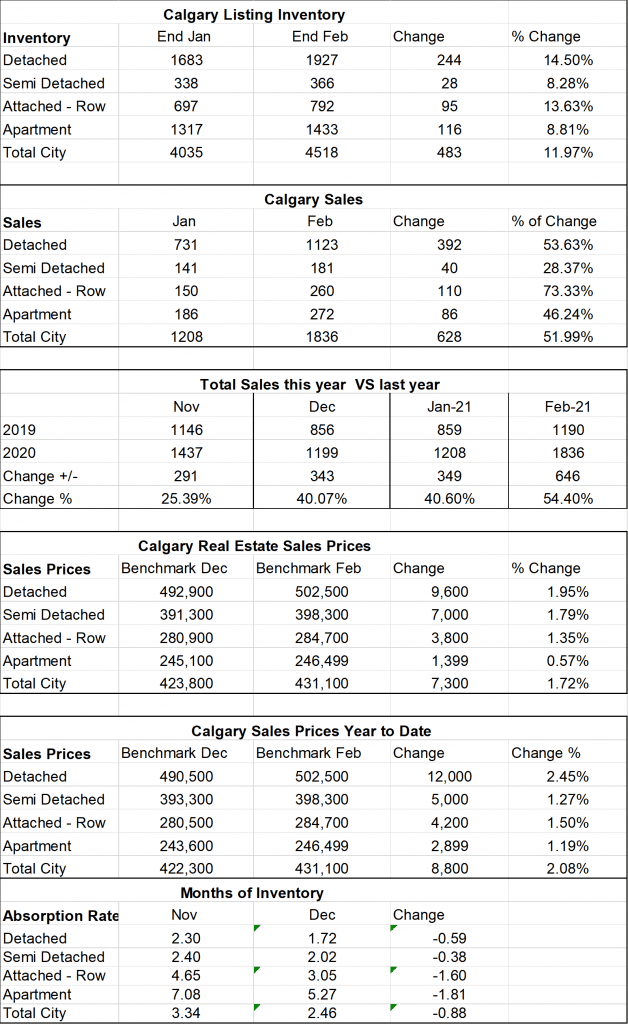
Stats from the Calgary Real Estate Board’s Monthly Stats package for February 2021