Archive for December, 2021

Reasons for a move to Calgary, Alberta

Friday, December 31st, 2021

Peace Bridge - Downtown


 Calgary general info

  • The current metro area of Calgary population of Calgary in 2021 is 1,581,000 a 2.2% increase from 2020
  • In 1988 Calgary Hosted the Olympics
  • Home of the world-famous Calgary Stampede
  • Calgary is a very cultural diverse City,  approximately one in 3 people living in Calgary were born outside of Canada


Top Reasons why people choose to move to Calgary

1. Calgary is only a one-hour drive to the Rocky Mountains

Banff National Park

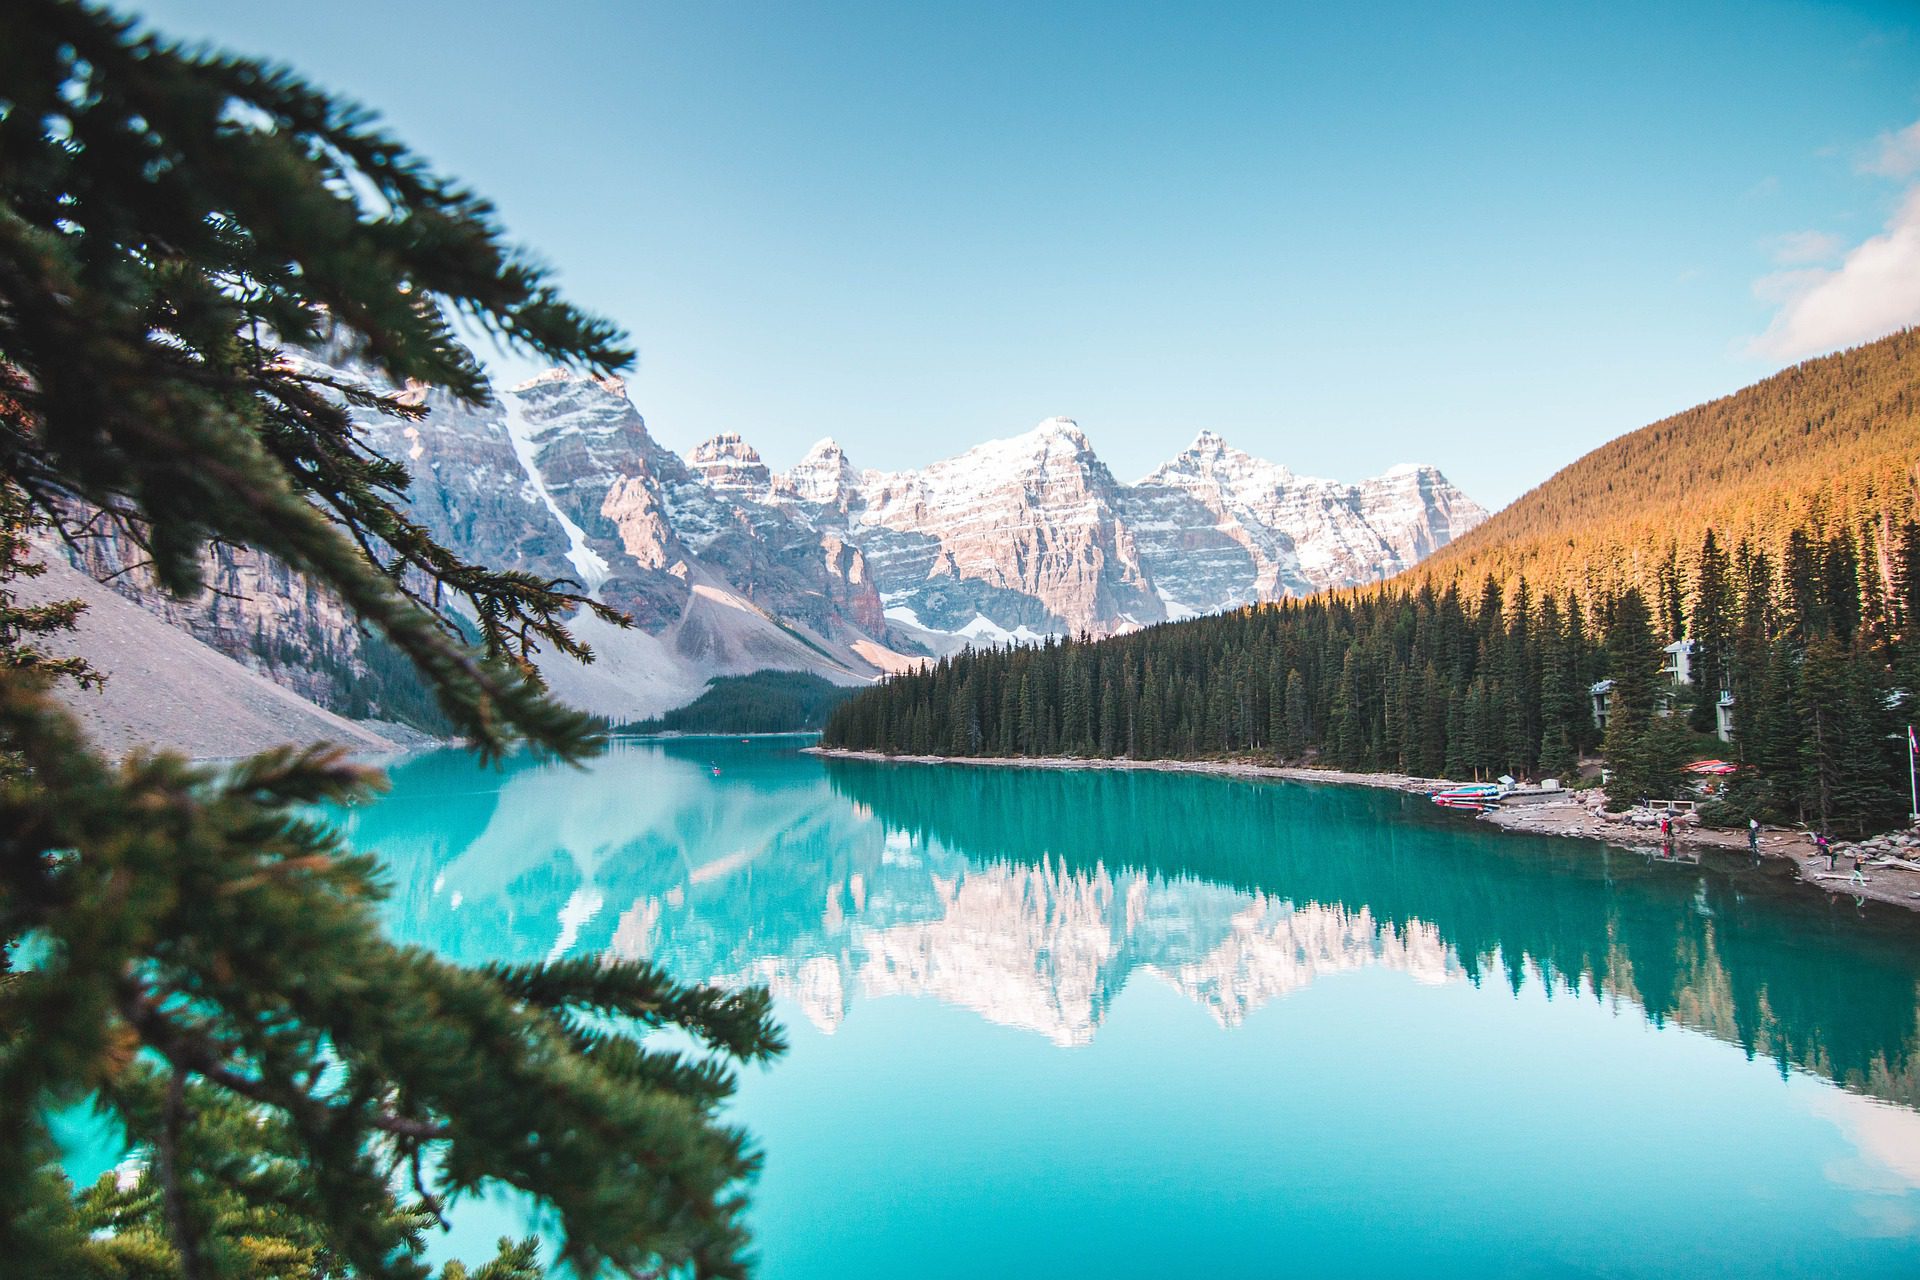
The Rocky Mountains provide days of adventure including Skiing, Snowshoeing, mountain climbing, hiking, golfing, or simply a nice stroll down Banff Avenue.

2. Pathways and Trails

Calgary communities, parks, and natural areas are connected by an extensive network of multi-use pathways.  The City maintains the most extensive urban pathway and bike network in North America with approximately 1000 km of regional pathways and 96 Km of trails.

3. Global Livability Ranking 

The Global Livability Ranking is a yearly assessment published by the Economist Intelligence Unit,  ranking 140 global cities for their urban quality of life based on assessments of stability,  healthcare, culture and environment, education, and infrastructure.  In 2019 Calgary ranked 5th with a livability score of 97.5

4. Canada’s Sunniest city

Calgary is the sunniest of Canada’s large cities, enjoying an average of 2396 hours of bright sun each year, spread over 333 days. That amounts to just over half of Calgary’s daylight hours.

5.  Key points from Calgary Economic & Development 

  • Calgary has more than 100 corporate head offices, the most per capita of any Canadian city, and is home to more than 700 startups, many in tech.
  • At 8% Alberta has the lowest income tax rate in Canada

6.  Among the Lowest Taxes in Canada

Alberta has some of the lowest taxes in North America — with no provincial sales tax, no payroll tax, no health care premiums, and some of the lowest corporate income taxes in Canada.

7. Affordable Housing 

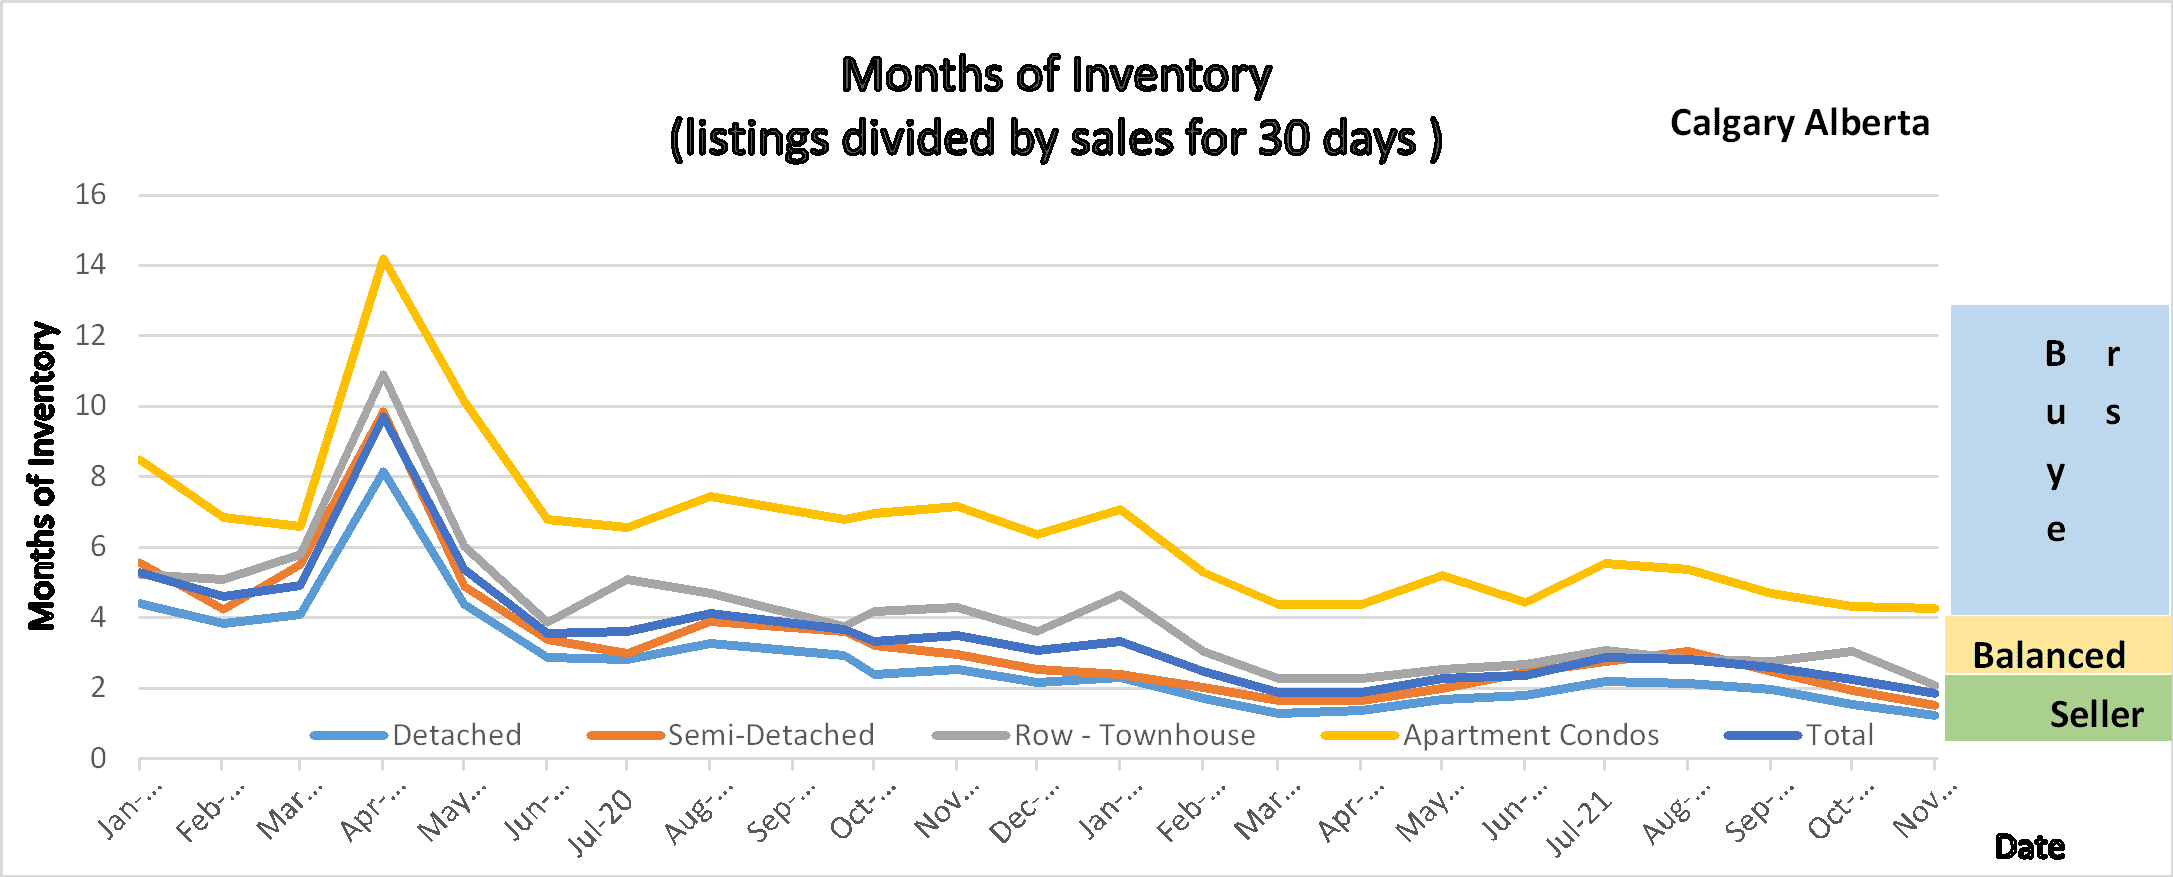
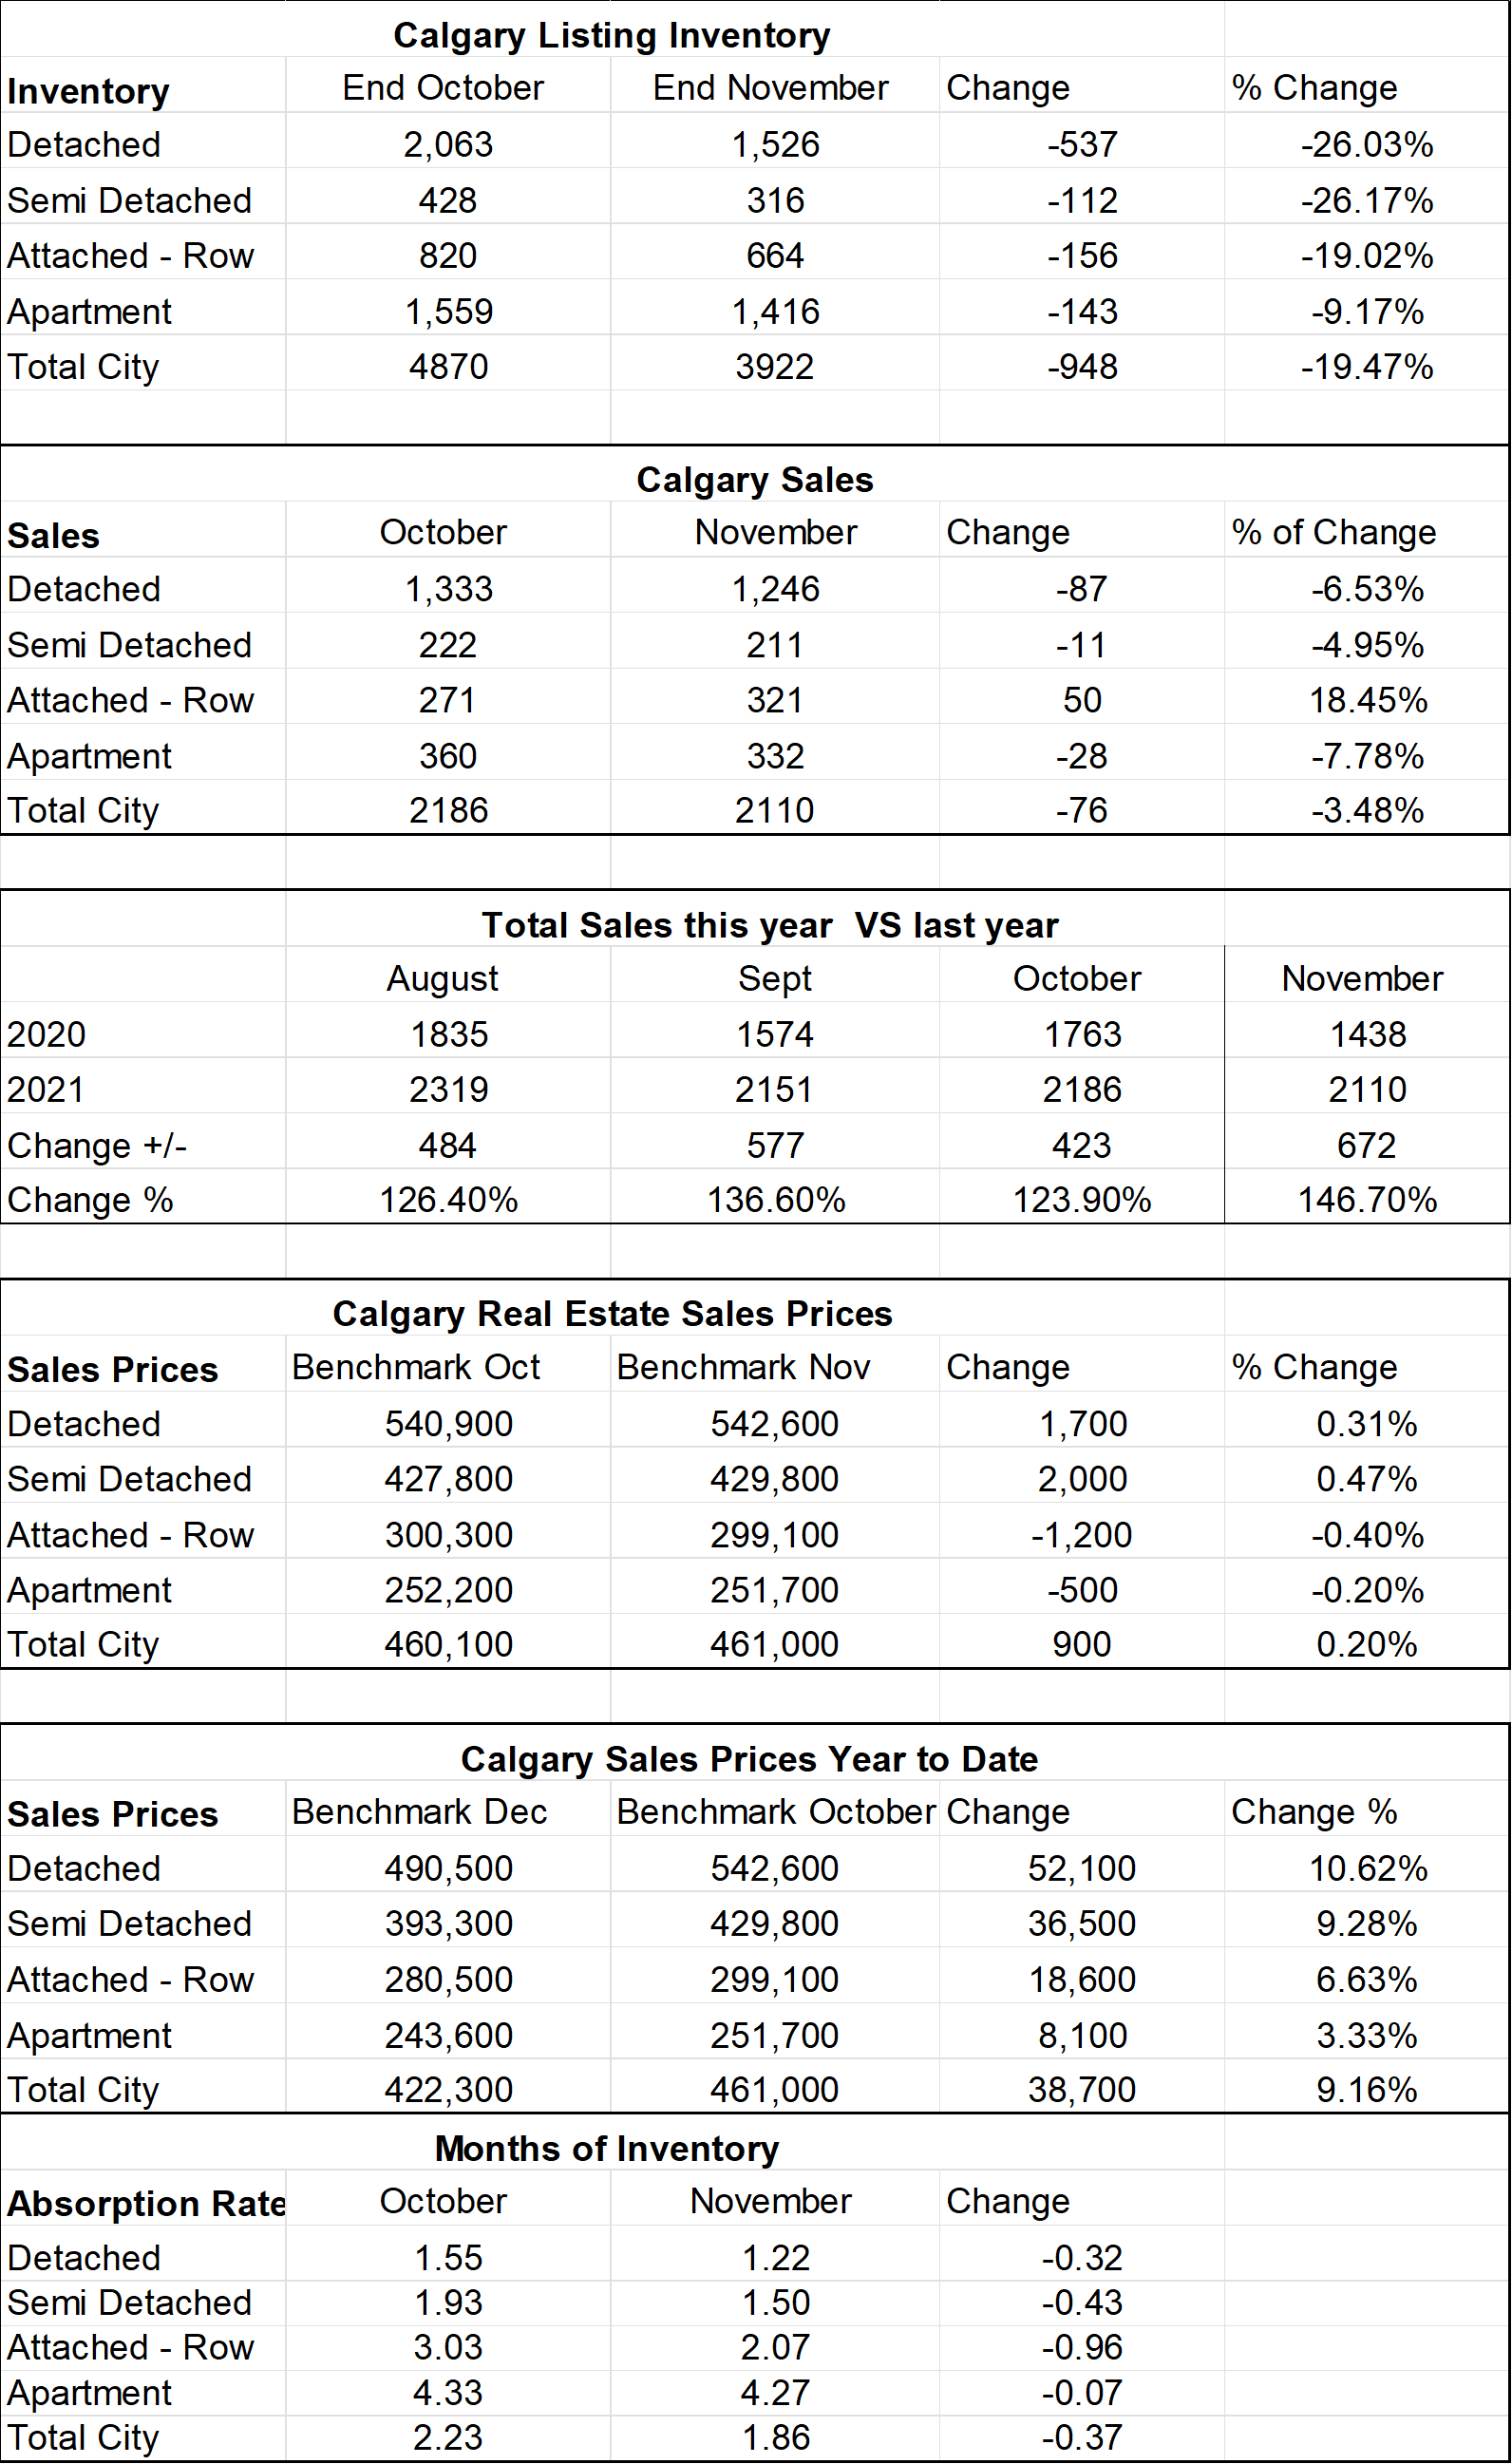
While Calgary is not the least expensive city to purchase a home in, Calgary is substantially cheaper than Toronto or Vancouver.  Calgary’s Median price currently sits at $530,000 for a detached single-family home.


Attractions

Whether visiting or living in Calgary here are some attractions you may want to put on your list to see

  • Calgary Exhibition and Stampede:  A 10-day event that starts the first Friday of July
  • Heritage Park 
  • Olympic Plazza
  • Saddledome with the Calgary Flames (NHL) 
  • 17th Avenue Retail & Entertainment district 
  • Eau Claire Market 
  • Princes Island Park 
  • Calgary Zoo 
  • Telus Convention Centre 
  • Calgary Tower  (once Calgary’s tallest structure) 
  • Telus Spark 
  • Calgary’s new Central Library 
  • Canada Olympic Park 


If you are considering making a move to Calgary TSW Real Estate Group can be a resource you can count on.  Being a native Calgarian I have a vast knowledge of Calgary Communities and the housing market.   There are many other valuable things we can provide to help you make a decision if Calgary is right for you.  Contact us here


Dec 1, 2021 Calgary Real Estate Market Snapshot

Thursday, December 2nd, 2021

What is really happening in the Calgary Real Estate Market?

The market is a result of Supply and Demand therefore we look at both Supply (inventory) and Demand (Sales) and the relationship between the two. We also update you on the current benchmark price for all housing sectors.

Following is a graph that shows the months of inventory for each housing sector. Looking at a 2-year trendline gives you an indication of where things are really heading.

Months of Inventory

Months of Inventory for the Calgary Real Estate Board

Gord’s commentary for the month (just my opinion).

Typically, we see a steady decline in sales from October through December, and then once we hit mid-January sales start to increase again and peak around June. This year is far from typical.  Sales are booming and our Inventory is decreasing pushing us into an even stronger Seller’s Market. It has to the point (in the detached home sector) where if a new listing is priced at market value there will be competing offers and it will sell in the same day, typically above list price.  It is common to see 6-10 offers on homes.

Calgary Listing Inventory

Listing inventory in all sectors declined again this month. Detached homes showed the largest decline of 537 listings with a total decline in inventory of 948 listings in all sectors. This works out to a decrease in inventory of 19.47%. Seeing a decline in inventory is quite typical of this time of year but the decline this year is higher. Last year our decline was 733 in November.

Calgary Sales:

Sales in all sectors (except Attached Row Homes) were down slightly from last month by a total of seventy-six sales less.  Attached Row homes sales increased by fifty sales.  To put this in perspective sales in November were 146.7% of sales from last November so a large increase.  What makes this interesting is that if we had more inventory our sales would be higher as there are many buyers out there who are trying but have not successfully bought a home due to the lack of supply.

Sales Compared to 2020:

As you can see below October 2021 Sales were higher than October 2020. As noted above this is due to pent up demand and a lack of supply making people search longer to find their home. The other factor here is people taking advantage of the low-interest rates.


  Jan Feb Mar Apr May June
2020 861 1190 1175 573 1080 1763
2021 1208 1836 2903 3209 2989 2915
Change +347 +646 +1729 +2639 1,911 1,152
% Change +7.49 +54.4 247% +562% 277.3% 165.3%


  July Aug Sept Oct Nov Dec
2020 1835 1574 1702 1763 1438 1199
2021 2319 2151 2162 2186 2110  
Change +484 +577 +456 + 423 +672  
% Change 126.4% 136.6% 126.7% 123.9% 146.7%  


Calgary Real Estate Benchmark Sales Prices:

Overall, the benchmark price increased for the Detached and Semi-Detached Sectors while the Townhouse and Apartment Condo sectors saw a small decline this month ((see chartbelow).  With the Months of Inventory where it is I anticipate further price increases in the coming months.

Calgary Real Estate Benchmark Year to Date Sales Price:  See chart below.

Year to date every sector has seen an increase in the Benchmark price.  Overall we are at a 9.16% increase so far and I anticipate further gains this month.


Current Months of Inventory (Absorption Rate): 

The Months of inventory decreased in all sectors this month. As of today, here is where we sit:

Sellers Market: Detached, Semi-Detached, and Attached- Rowhomes

Buyers Market: Apartment Condos

Overall, we are in a Sellers’s Market.

It is also important to note that these numbers vary by community, and by price range. If you would like numbers for your community, or more specific numbers for your home please contact us.

Below is a summary of numbers in chart form. All numbers are taken from the Calgary Real Estate Boards monthly Stats package.

Stats from the Calgary Real Estate Board

This photo shows Key Numbers from the Calgary Real Estate Board including sales, inventory, and Benchmark Price for each sector of the market.