What is really happening in the Calgary Real Estate Market?
The market is a result of Supply and Demand therefore we look at both Supply (inventory) and Demand (Sales) and the relationship between the two. We also update you on the current benchmark price for all housing sectors.
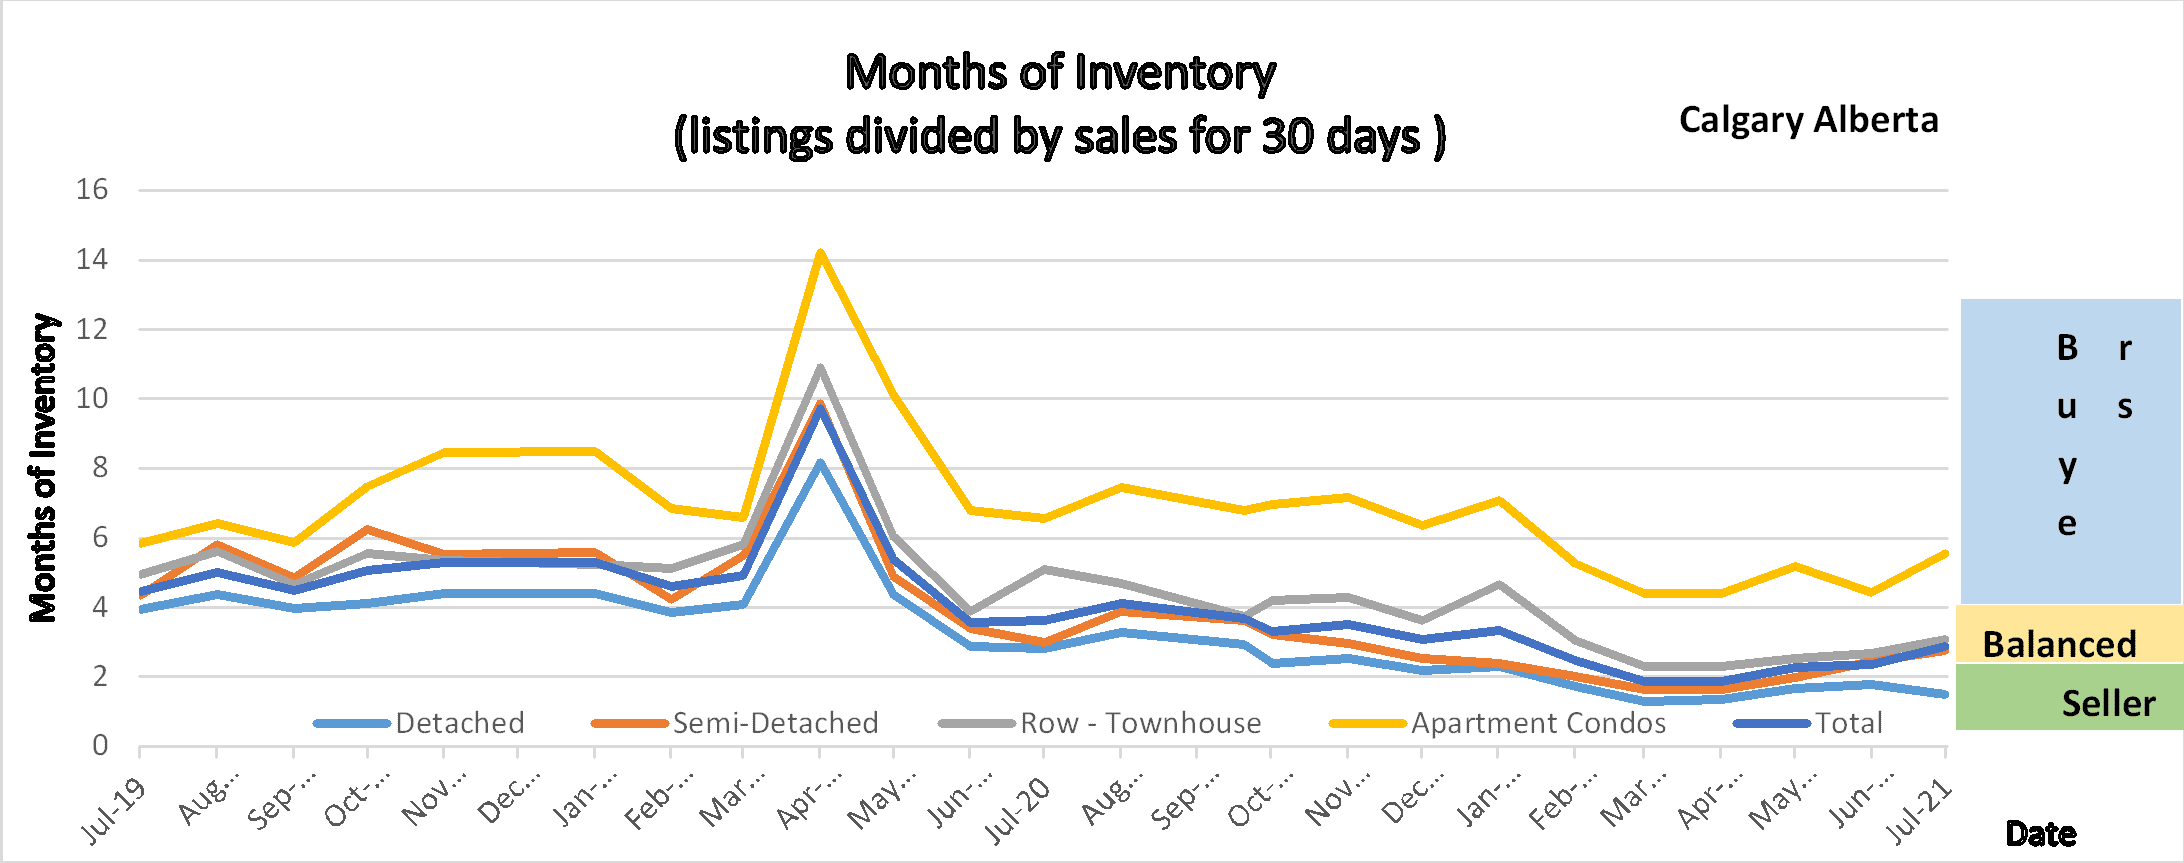
Following is a graph that shows the months of inventory for each housing sector. Looking at a 2-year trendline gives you an indication of where things are really heading.
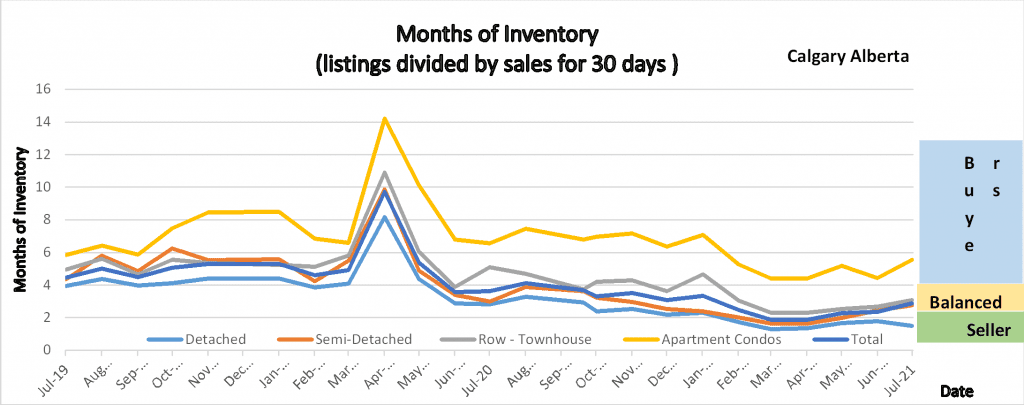
The graph shows the 2-year trend of months of inventory for all sectors of the Calgary Real Estate Market.
Gord’s commentary for the month (just my opinion).
Another record: Sales in July were 2319, the highest July on record!
Sales declined from last month but so did the number of listings on the market. The sales decline was slightly greater than the listings decline, pushing up the months of inventory on the market.
Calgary Listing Inventory
While inventory typically starts rising in July, our inventory declined by 240 listings. The decrease in inventory was consistent across all sectors. I believe there is still a pent-up demand, if listings are priced right then they are selling very quickly. Some listings I am seeing are substantially overpriced and these are sitting on the market.
Calgary Sales:
Another record: Sales in July were 2319, the highest July on record!
Compared to June sales dropped by 20.3% This is very typical as once we hit July people are focused on summer vacations and such. The decrease in sales was consistent across all sectors.
Sales Compared to 2020:
Normally this is a good category to watch however we are now comparing sales this year to when we were in a slower market due to Covid. As you can see sales in July were 126.4% above last July’s sales. As you can also see every month the sales over last years are declining.
| |
Jan |
Feb |
Mar |
Apr |
May |
June |
| 2020 |
861 |
1190 |
1175 |
573 |
1080 |
1763 |
| 2021 |
1208 |
1836 |
2903 |
3209 |
2989 |
2915 |
| Change |
+347 |
+646 |
+1729 |
+2639 |
1,911 |
1,152 |
| % Change |
+7.49 |
+54.4 |
247% |
+562% |
277.3% |
165.3% |
| |
July |
Aug |
Sept |
Oct |
Nov |
Dec |
| 2020 |
1835 |
1574 |
1702 |
1764 |
1437 |
1199 |
| 2021 |
2319 |
|
|
|
|
|
| Change |
+484 |
|
|
|
|
|
| % Change |
126.4% |
|
|
|
|
|
Calgary Real Estate Benchmark Sales Prices:
Overall, the benchmark price in Calgary increased again in June by $1,800
All Sectors showed price gains in July. The highest gains were in Detached homes at +$2,700 and the lowest gain was $300 in the Attached-Row sector which makes total sense based on Months of Inventory. I am a little surprised that the Apartment sector increased by $1,100 even though that sector is still showing 5.54 months of Inventory (indicating a buyer’s market).
Calgary Real Estate Benchmark Sales Price: See chart below.
Current Months of Inventory (Absorption Rate):
Once again, our months of inventory gained slightly in all sectors. The highest gain is in the Apartment Condo sector at 1.1 Every other sector was in the .4 to .5 increase range.
Detached homes are still sitting in a seller’s market.
Semi-Detached, Attached-Row homes are sitting in a balanced market position.
Apartment Condos are sitting in a buyer’s market position.
It is also important to note that these numbers vary by community, and by price range. This month I sold an apartment condo in the SW and the months of inventory for that community was only 1.55 compared to a 5.54 in Calgary.
If you would like numbers for your community, or more specific numbers for your home please contact us.
Below is a summary of numbers in chart form. All numbers are taken from the Calgary Real Estate Boards monthly Stats package.