What is really happening in the Calgary Real Estate Market?
Following is a graph that shows the months of inventory for each housing sector. Looking at a one-year trendline gives you an indication of where things are really heading.
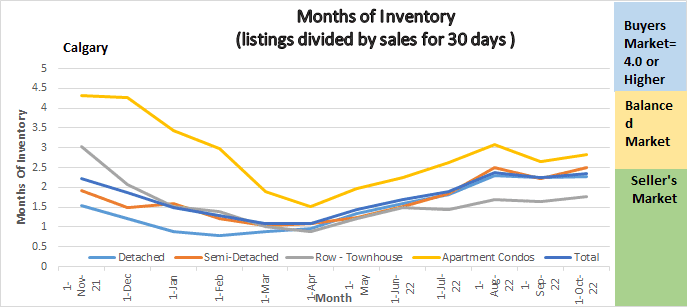
Chart shows the months of Inventory for all sectors of the Calgary Real Estate Market for the last year.
Gord’s commentary for the month (just my opinion).
October 2022 Highlights
The Calgary Market continues to stay strong!
- Inventory Declined substantially
- Sales declined
- Benchmark price declined slightly
- Months of Inventory decreased a little.
- Overall, still a great market, especially for sellers.
Calgary Listing Inventory
Listing Inventory in all sectors declined this month by 12.7% overall. The largest decline was in the detached sector (-272) followed by the Apartment Condo Sector (-133) and Attached- Row-Homes (-117). It is very normal for sales to decline in Oct and will likely continue to do so until the new year.
Calgary Sales:
All sectors saw a decrease of sales in September. The total decrease in sales was only 2.31% and was spread equally between sectors. My sense is most of the decrease is due to seasonal trends and a shortage of inventory on the market.
Sales Compared to 2021:
It is also important to look at sales compared to the Previous year. Sales for October were down 17.6% when compared to last October. Sales compared to long term trends are still on the high side.
| Jan | Feb | Mar | Apr | May | June | July | |
| 2021 | 1207 | 1831 | 2903 | 3204 | 2981 | 2914 | 2314 |
| 2022 | 2009 | 3305 | 4107 | 3401 | 3071 | 2842 | 2254 |
| Change | + 802 | 1474 | +1204 | +197 | 90 | -72 | -60 |
| % Change | + 66.4% | +180.5% | +141.5% | +1.06 | +1.03% | 2.5% | 2.7% |
| Aug | Sept | Oct | Nov | Dec | |
| 2021 | 2146 | 2157 | 2184 | ||
| 2022 | 2136 | 1901 | 1857 | ||
| Change | -10 | -256 | -327 | ||
| % Change | -.5% | -11.9% | -17.6% |
Calgary Real Estate Benchmark Sales Prices:
The benchmark price for all sectors combined decreased by $3,500 for the month. Detached and Semi-Detached homes lost $4,100 and $3,700, respectively. Attached Row Homes decreased by $1,100, and Apartment condos decreased by $100
Calgary Real Estate Benchmark Year to Date Sales Price: See chart below.
Year to date the Calgary market has increased by 8.87%. See stats below for sector breakdowns.
Current Months of Inventory (Absorption Rate):
The months of inventory took a turn this month and, in all Sectors, decreased marginally. When a market goes up like it has in Calgary it then typically goes down and then will go up and down until it settles, I believe we have now had the down cycle and we are going up to find the new normal.
What might the last quarter of 2022 bring: (again just my opinion)
Based on what I am seeing with the Inventory, my prediction is that we are going to be in a tight market for the next few months. I personally have several buyers who are just waiting for something to come on the market that fits their criteria. I see this trend continuing and therefore prices are likely to increase again.
Below is a summary of numbers in chart form. All numbers are taken from the Calgary Real Estate Boards monthly Stats package.
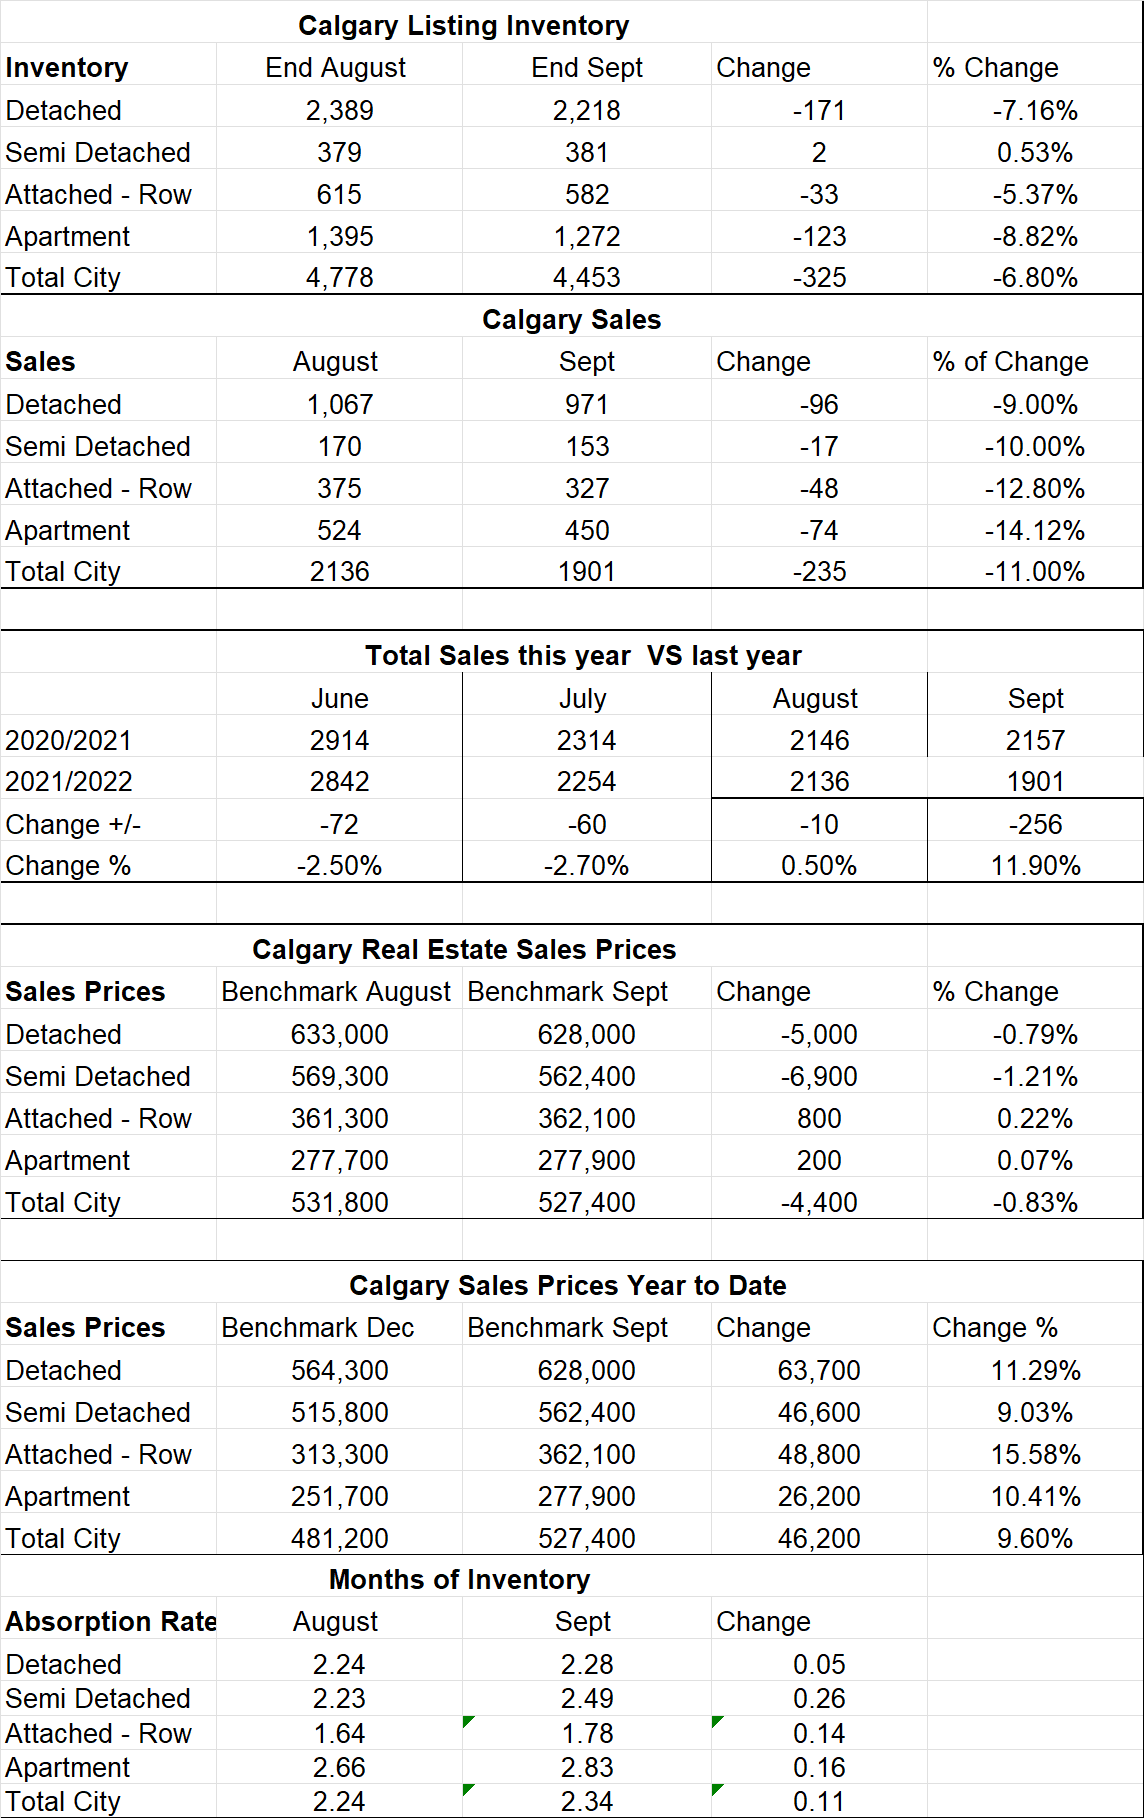
Key Stats from the Calgary Real Estate Boards Stats Package.