What is really happening in the Calgary Real Estate Market?
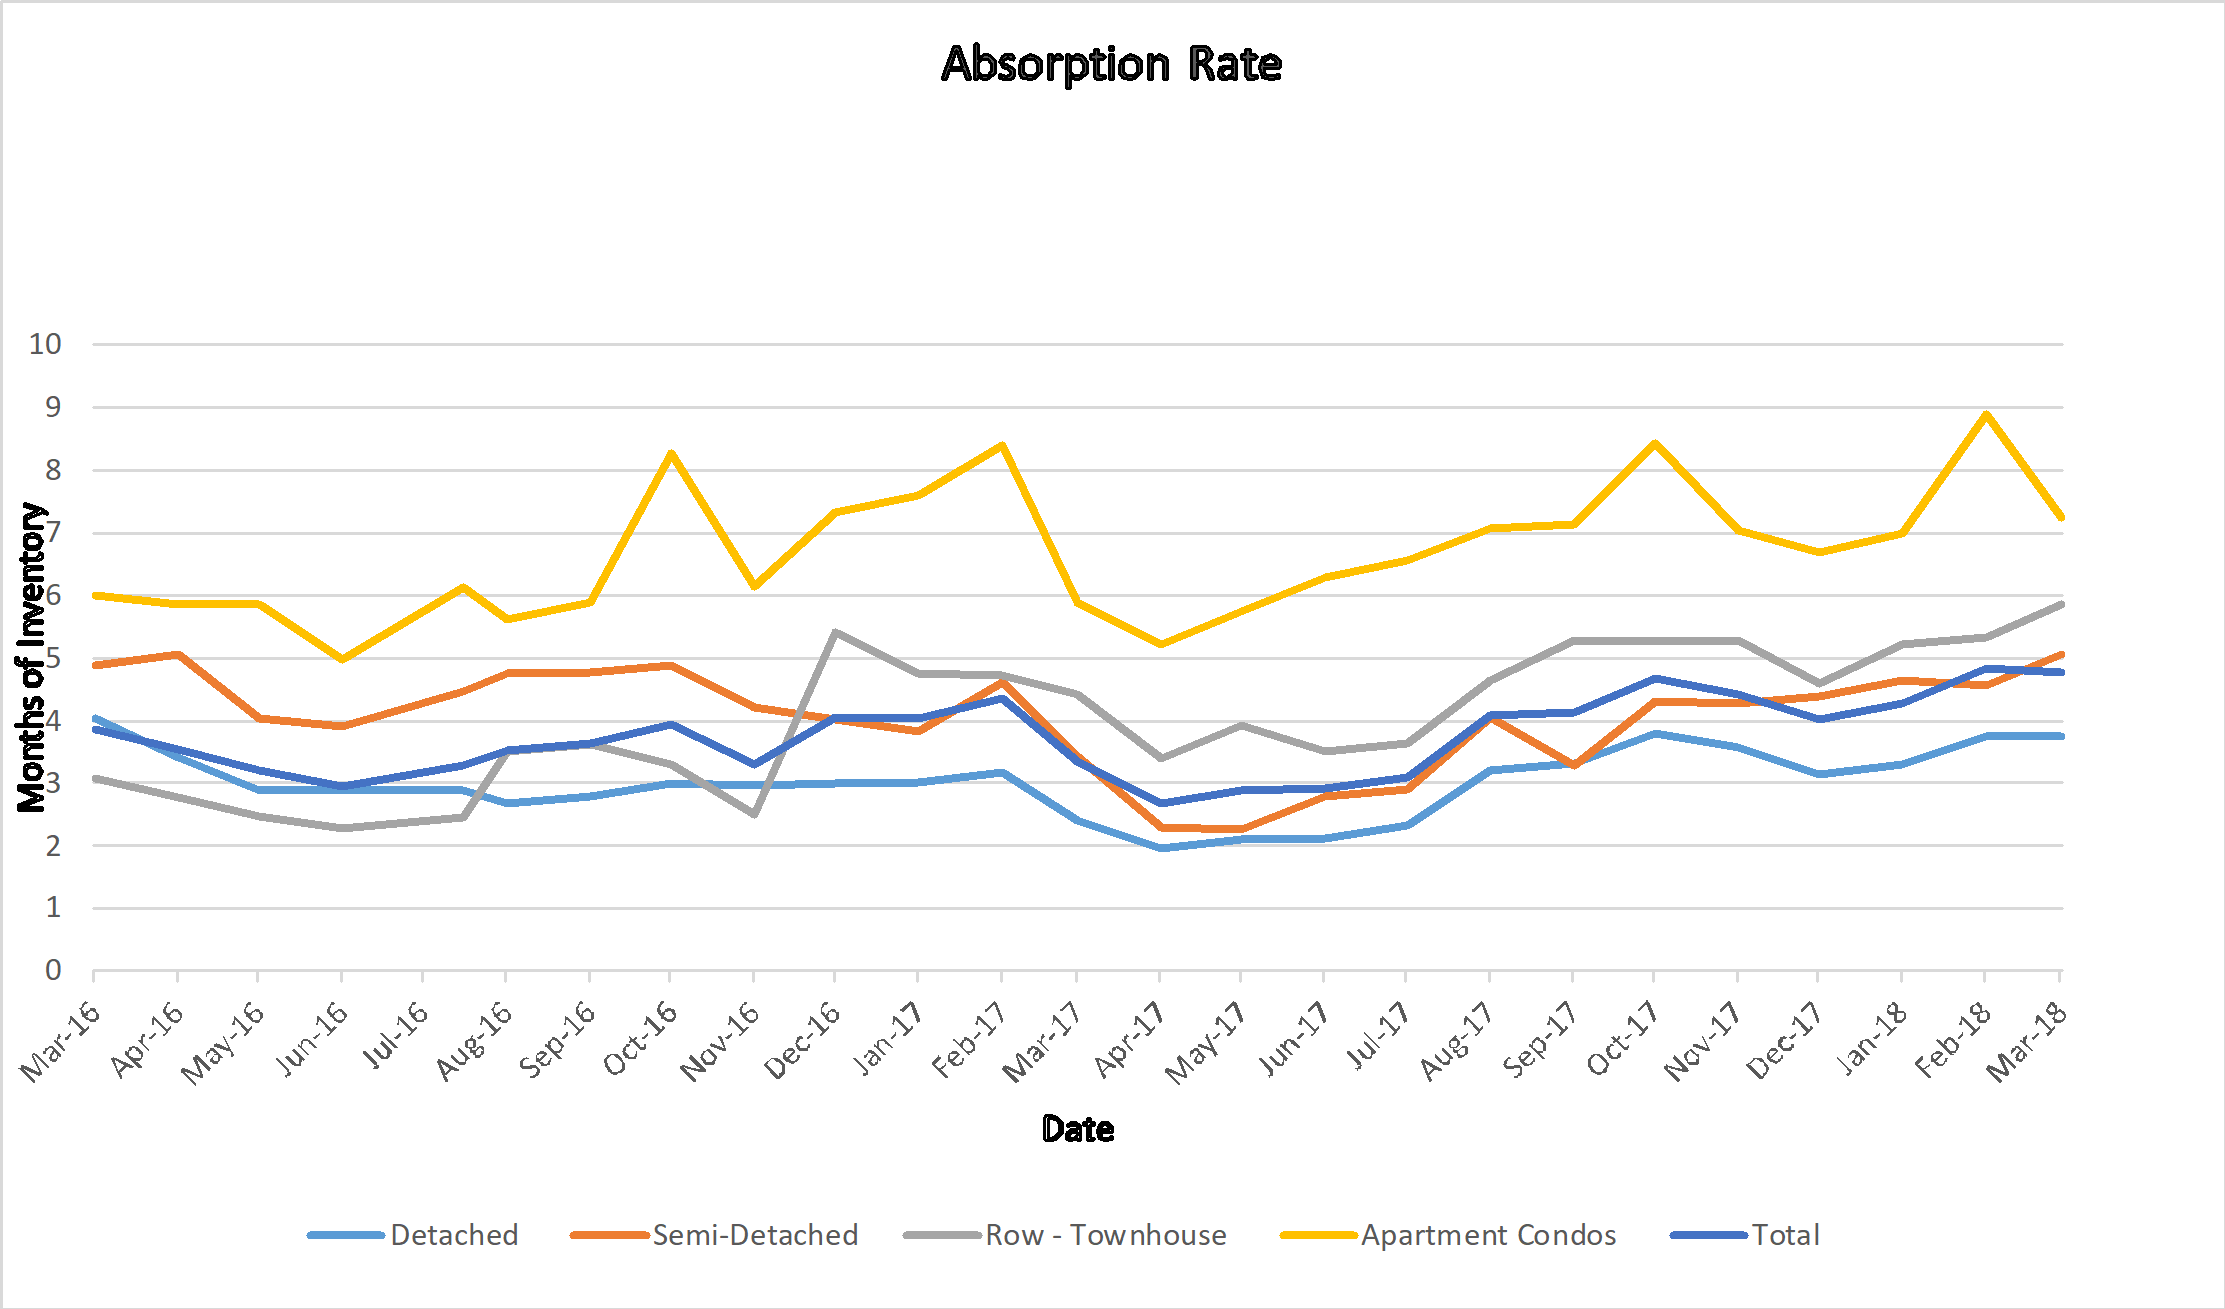
Calgary Real Estate Absorption Rate
Stay ahead of everyone else by following our Monthly Market Snapshot of the Calgary Real Estate Market, This shows what’s really happening! The market is driven by supply and demand so here we show the inventory (supply) and sales (demand) and most importantly the relationship between the two and how it affects the price of Calgary Real Estate. A simple way to keep up to date with how the market is trending and to stay ahead of most! All numbers are taken from the Calgary Real Estate Boards Stats package for Realtors. I have also included some general comments which are simply my opinion.
Absorption Rate (Months of Inventory – the inventory divided by the number of sales in the last month). What does this mean you might ask?
| Buyer’s Market | >4.0 | Drives prices down |
| Balanced Market | Between 2.4 to 4.0 | Prices typically remain stable |
| Seller’s Market | <2.4 | Drives prices up |
Current Absorption Rate
The Absorption rate for Detached homes and apartment condos decreased from January while Semi-detached and Row homes increased. Most of the changes are small except there was a large decrease for apartment condos, this decrease is simply offsetting last months spike.
| End of | Jan 2018 | Feb 2018 | Change |
| Detached | 3.77 | 3.74 | -0.03 |
| Semi Detached | 4.51 | 5.05 | 0.54 |
| Attached – Row | 5.34 | 5.86 | 0.52 |
| Apartment | 8.77 | 7.24 | -1.53 |
| Total City | 4.84 | 4.76 | -0.08 |
Calgary Listing Inventory
In February, our inventory increased in all Sectors. This is totally expected at this time of year. This trend is anticipated for the next few months.
| Inventory | Jan 2018 | Feb 2018 | Change |
| Detached | 2199 | 2456 | 257 |
| Semi Detached | 451 | 540 | 89 |
| Attached – Row | 699 | 779 | 80 |
| Apartment | 1289 | 1427 | 138 |
| Total City | 4638 | 5202 | 564 |
Calgary Sales: Sales numbers all increased for February. What you cannot see here is that sales decreased 18% from February of last year. I believe this decrease is due in part to the weather we have had, but more because of the new mortgage rules. I believe it will take another couple of months for the sales to come back to a more normal level.
| Calgary Sales | Jan 2018 | Feb 2018 | Change | % Change |
| Detached | 583 | 657 | 74 | 12.69% |
| Semi Detached | 100 | 107 | 7 | 7.00% |
| Attached – Row | 131 | 133 | 2 | 1.53% |
| Apartment | 147 | 197 | 50 | 34.01% |
| Total City | 959 | 1094 | 135 | 14.08% |
Calgary Real Estate Sales Prices:
Prices in February showed an increase in Detached and Semi-Detached sectors, a tiny increase in Apartment condos and a decrease in Attached-Row homes.
| Sales Prices | Jan 2017 Benchmark Price | Feb 2018 Benchmark Price | Change |
| Detached | 499,400 | 502,800 | 3,400 |
| Semi Detached | 415,800 | 418,800 | 3,000 |
| Attached – Row | 296,700 | 295,400 | -1,300 |
| Apartment | 256,200 | 256,400 | 200 |
| Total City | 432,300 | 434,300 | 2,000 |
Sales Prices “Year to Date”
Same as monthly number
| Sales Prices | Jan 1, 2018 Benchmark Price | Feb 2018 Benchmark Price | Change
$ |
% Change |
| Detached | 499,600 | 502,800 | -200 | -0.04% |
| Semi Detached | 416,600 | 418,800 | -800 | -0.19% |
| Attached – Row | 299,500 | 295,400 | -2,800 | -0.93% |
| Apartment | 257,700 | 256,400 | -1,500 | -0.58% |
| Total City | 433,200 | 432,300 | -900 | -0.21% |
**Please note that these numbers include only Calgary homes and do change on a community basis and more so for towns. This report does not include rural properties. If you would like to find stats on your community just let me know. If you have any questions about this summary or about Real Estate in general, please feel free to contact us.