What is really happening in the Calgary Real Estate Market?
The market is a result of Supply and Demand therefore we look at both Supply (inventory) and Demand (Sales) and the relationship between the two. We also update you on the current benchmark price for all housing sectors.
Following is a graph that shows the months of inventory for each housing sector. Looking at a 2-year trendline gives you an indication of where things are really heading. As you can see at a glance all sectors except apartment condos are in a Seller’s market position.
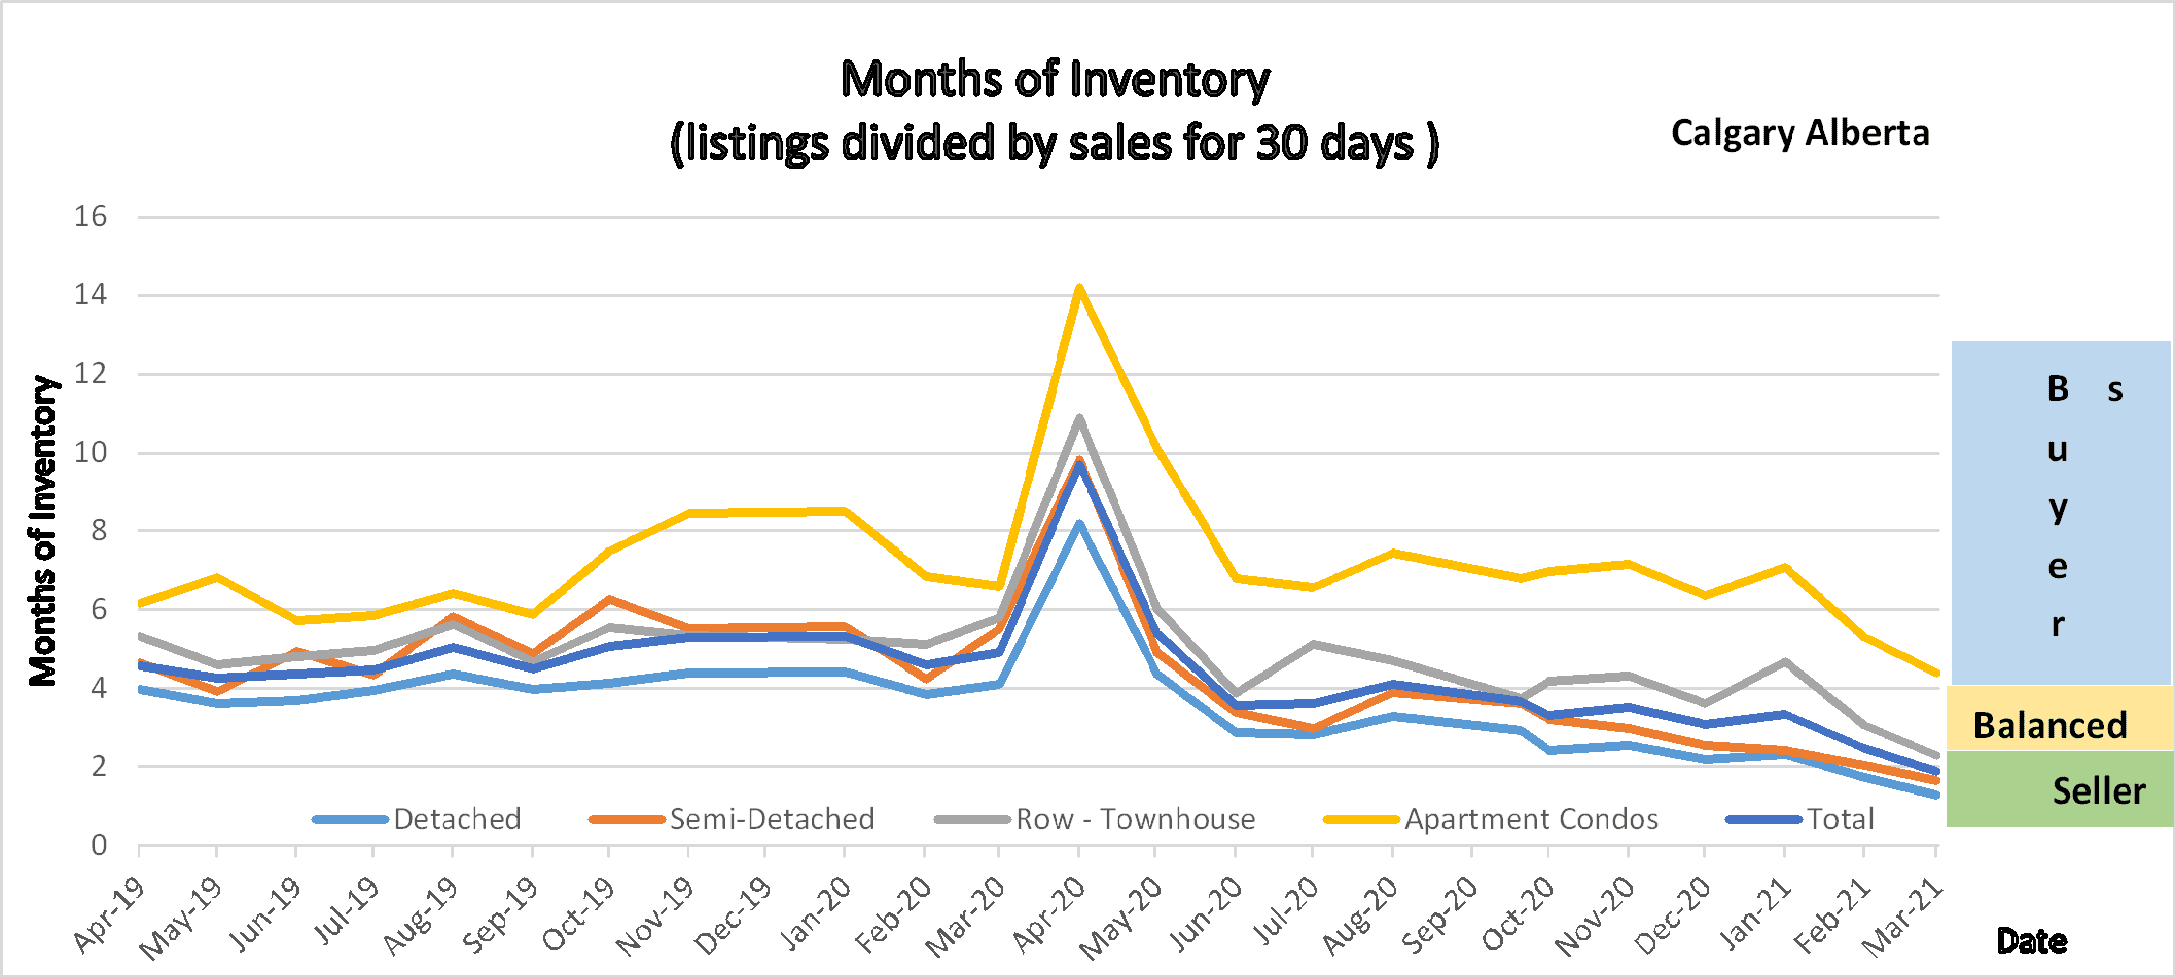
2 Year Trendline
Gord’s commentary for the month (just my opinion).
The Calgary Real Estate Market continues to outpace last month and last year by hugh numbers. Up until March the sales increases were mostly in the detached sector but that is now creeping into other sectors as well.
Following are just my thoughts on the why:
- Low-Interest Rates According to Rate Hub a 5-year mortgage can be had at 1.74% – Crazy Low.
- According to data from ATB the Job losses have been in the lower wage groups. Higher wage jobs are in positive territory compared to a year ago.
- There has recently been some positive news in the Oil & Gas Sector.
- With Vaccine’s coming there is a little more of a positive vibe out there.
Calgary Listing Inventory
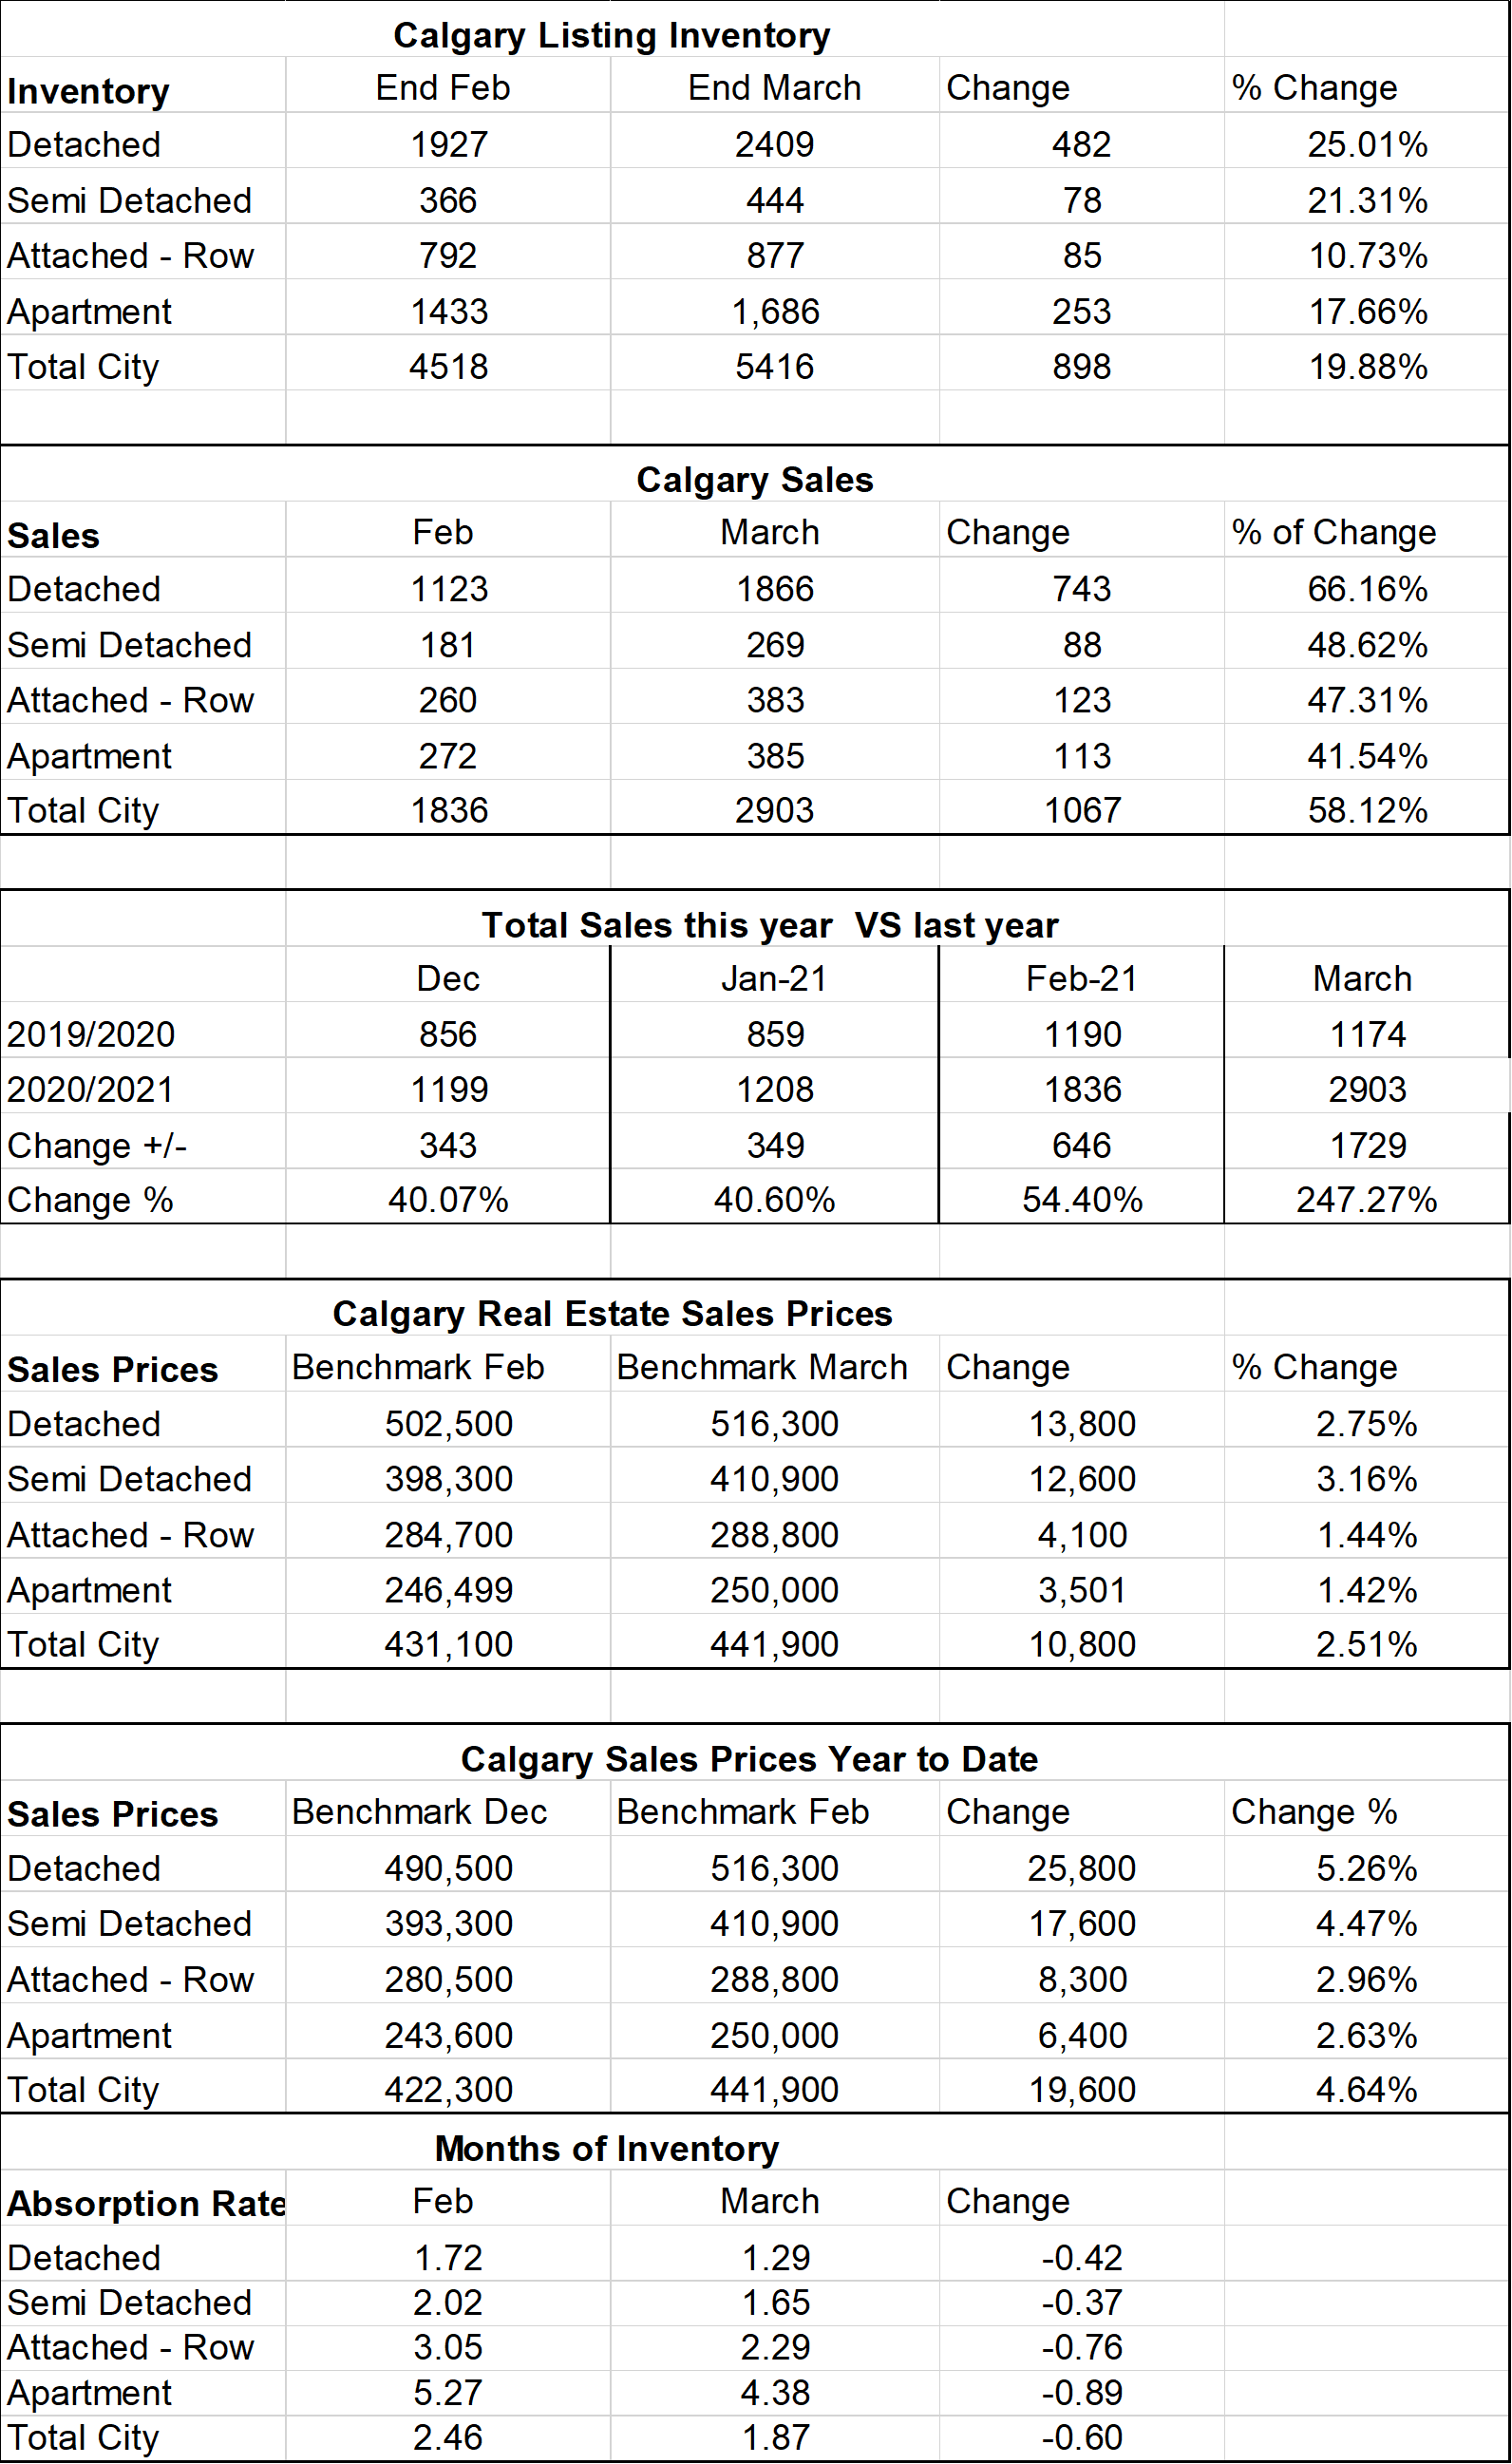
In March we saw the inventory for homes in all sectors increase marginally.
Calgary Sales:
Calgary Sales were the highest they have been since 2007. When compared to last month all sectors were up with detached homes leading the way at 66.16% increase. Semi-detached was 48.62%, Attached Row was 47.31% and Apartment Condos trailed at a 41.54%increase – which is still huge.
Sales Compared to 2020:
This is where it gets interesting. As you can see sales in March 2021 beat sales in March 2020 by 247.3%
Of course, we have to keep in mind that March 2020 we just started to see sales decreased due to covid.
| Jan | Feb | Mar | Apr | May | June | July | Aug | Sept | Oct | Nov | Dec | |
| 2020 | 861 | 1190 | 1175 | 573 | 1080 | 1747 | 1835 | 80 | 1702 | 1764 | 1437 | 1199 |
| 2021 | 1208 | 1836 | 2903 | |||||||||
| Change | +347 | +646 | +1729 | |||||||||
| % change | +7.49 | +54.4 | 247.3% |
Calgary Real Estate Benchmark Sales Prices:
Overall, the Benchmark Price for all sectors increased by $10,800. Detached homes increased by $13,800 (the largest) and the smallest which was Apartment Condos which still increased by $3,501. Detached homes year to date increased by 25,800 or 5.26%
Current Months of Inventory (Absorption Rate):
This is the key number, which determines what type of market we are currently in.
The months of inventory decreased in all housing sectors. From the smallest to largest decrease the change was:
Semi-Detached -.37 Sellers Market Territory
Detached – .42 Continues to be in Sellers Market Territory
Attached Row: -.76 Now in Sellers Market territory at 2.29 Months of Inventory
Apartment: – .89 Still in Buyer’s market territory
With the months of Inventory where they are, I can only predict that prices will continue to increase with possibly the exception of Apartment Condos.
It is also important to note that these numbers vary by community, and by price range. If you would like numbers for your community, or more specific numbers for your home please contact us.
Below is a summary of numbers in chart form. All numbers are taken from the Calgary Real Estate Boars monthly Stats package.
All numbers are taken from the Calgary Real Estate Boards monthly Stats package for Realtors.