Aborsption Rate Trend – Supply Vs Demand
What is really happening in the Calgary Real Estate Market?
Stay ahead of everyone else by following our Monthly Market Snapshot of the Calgary Real Estate Market This shows what’s really happening! The market is driven by supply and demand so here we show the inventory (supply) and sales (demand) and most importantly the relationship between the two and how it affects the price of Calgary Real Estate. A simple way to keep up to date with how the market is trending and to stay ahead of most! All numbers are taken from the Calgary Real Estate Boards Stats package for Realtors. I have also included some general comments which are simply my opinion.
Absorption Rate’s Explained (Months of Inventory) (the inventory divided by the number of sales in the last month). What does this mean you might ask?
| Buyer’s Market | >4.0 | Drives prices down |
| Balanced Market | Between 2.4 to 4.0 | Prices typically remain stable |
| Seller’s Market | <2.4 | Drives prices up |
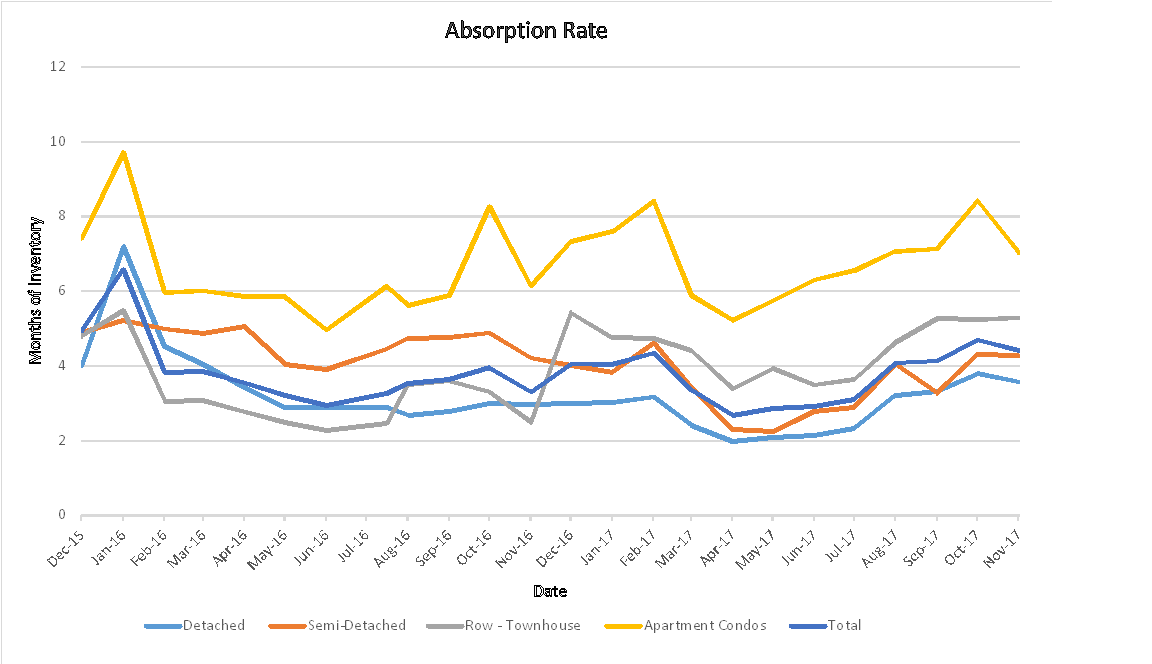
Current Absorption Rate
The Absorption rate for October stayed almost flat with the exception of Apartment Condos which decreased by 1.38 which is the first sizable decrease we have seen in this sector in a while. It’s important to note that last month went up by 1.29 so part of this can be just timing of listing coming on and off the market.
| Sept 2017 | Oct 2017 | Change | |
| Detached | 3.79 | 3.57 | -0.21 |
| Semi Detached | 4.31 | 4.27 | -0.04 |
| Attached – Row | 5.25 | 5.28 | 0.03 |
| Apartment | 8.42 | 7.03 | -1.38 |
| Total City | 4.69 | 4.41 | -0.29 |
Calgary Listing Inventory
In October all categories stayed flat except for detached homes which saw an decrease of 233 listings and apartment condos which decreased by 129 listings.
| Inventory | Sept 2017 | Oct 2017 | Change |
| Detached | 3479 | 3246 | -233 |
| Semi Detached | 621 | 611 | -10 |
| Attached – Row | 993 | 967 | -26 |
| Apartment | 1768 | 1639 | -129 |
| Total City | 6861 | 6463 | -398 |
Calgary Sales:
Sales for October were almost identical to September. Last year sales from Sept to Oct increased by 168 so were a little behind last year.
| Calgary Sales | Sept 2017 | Oct 2017 | Change | % Change |
| Detached | 919 | 908 | -11 | -1.20% |
| Semi Detached | 144 | 143 | -1 | -0.69% |
| Attached – Row | 189 | 183 | -6 | -3.17% |
| Apartment | 210 | 233 | 23 | 10.95% |
| Total City | 1462 | 1467 | 5 | 0.34% |
Calgary Real Estate Sales Prices:
I find these numbers interesting as again if in a balanced market prices should remain fairly stable. In reality every sector showed a slight decrease. One variable that these numbers do not show is consumer confidence and I think this may have something to do with prices holding.
| Sales Prices | Sept 2017 Benchmark Price | Oct 2017 Benchmark Price | Change |
| Detached | 508,900 | 506,200 | -2,700 |
| Semi Detached | 419,400 | 419,000 | -400 |
| Attached – Row | 306,900 | 305,000 | -1,900 |
| Apartment | 263,700 | 261,600 | -2,100 |
| Total City | 441,500 | 438,900 | -2,600 |
Sales Prices “Year to Date”
Our Year to date numbers are very in alignment with the absorption rate changes.
| Sales Prices | Jan 1, 2017 Benchmark Price | Oct 2017 Benchmark Price | Change
$ |
% Change |
| Detached | 498,700 | 506,200 | 7,500 | 1.50% |
| Semi Detached | 406,800 | 419,000 | 12,200 | 3.00% |
| Attached – Row | 302,600 | 305,000 | 2,400 | 0.79% |
| Apartment | 265,000 | 261,600 | -3,400 | -1.28% |
| Total City | 433,400 | 438,900 | 5,500 | 1.27% |
Looking Forward – Again just Gord’s opinion.
Based on the absorption rate we should see stability in the Detached & Semi Detached sectors while we may seem more losses in the Row House & Apartment sectors
However
You may have heard by now that the Fed’s are changing mortgage qualifying rules as of Jan 1, 2018. This can cause a wide range of changes.
- In the short term it can push people to buy before the end of the year.
- When they changed the qualifying process for insured mortgages we saw little change in sales numbers.
- I heard from one mortgage broker that most banks are already doing this for many types of mortgages so again the impact may be smaller than what some expect
- If there is an impact and people are able to qualify for less, then this may push some people from detached homes to attached homes and from row housing to the apartment condo sector which in Calgary could bring more balance to our market.
- Really only time will tell the whole story
**Please note that these numbers include only Calgary homes and do change on a community basis and more so for towns. This report does not include rural properties. If you would like to find stats on your community just let us know. If you have any questions about this summary or Real Estate questions please feel free to contact us.