What is really happening in the Calgary Real Estate Market?
The market is a result of Supply and Demand therefore we look at both Supply (inventory) and Demand (Sales) and the relationship between the two. We also update you on the current benchmark price for all housing sectors.
Following is a graph that shows the months of inventory for each housing sector. Looking at a 2-year trendline gives you an indication of where things are really heading.
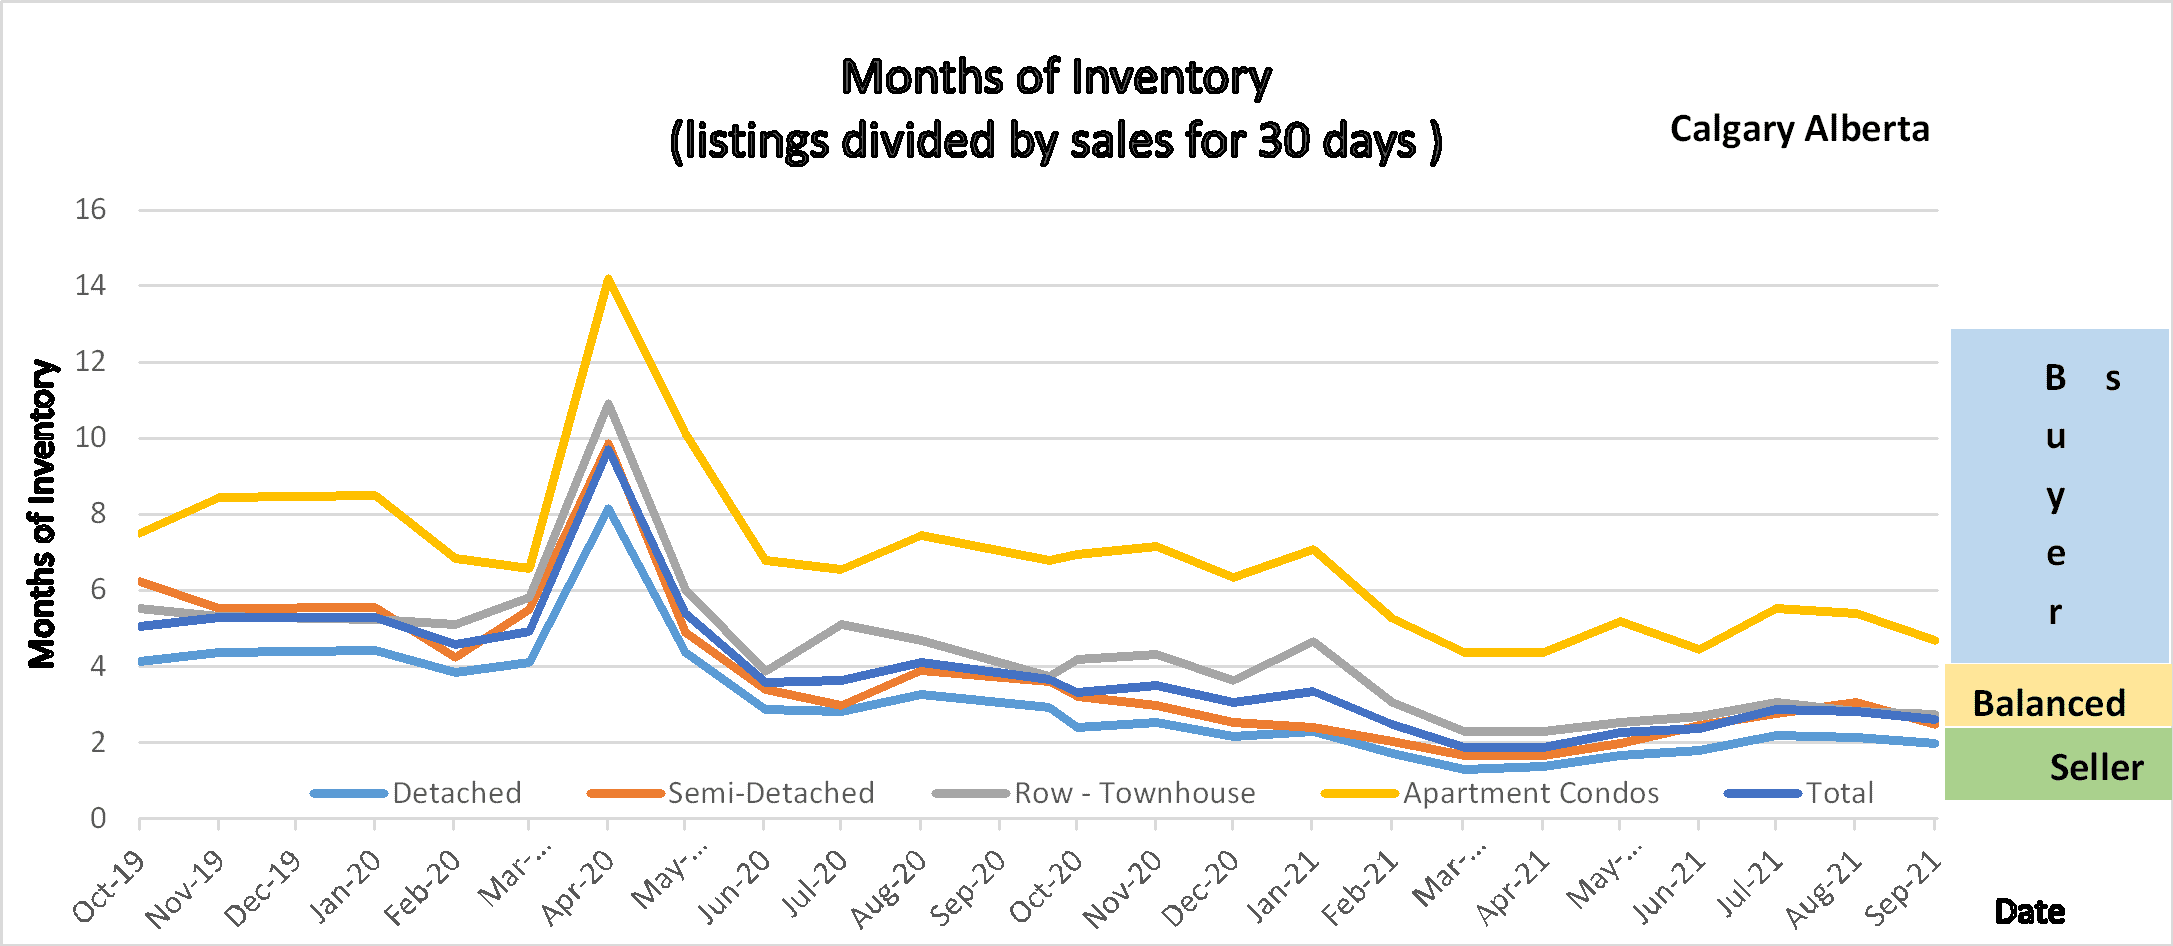
The graph shows 2 years of Months of Inventory for every sector in the Calgary housing market.
Gord’s commentary for the month (just my opinion).
September saw a decline in inventory and a marginal increase in Sales moving the months of inventory even lower.
Calgary Listing Inventory
Typically, at this time of year, we see our inventory start to climb. This year that is still not the case as our overall inventory declined by 446 listings. Inventory declined in all housing sectors with the largest decrease in Detached homes at 9.89% decline and the lowest in the apartment condo sector at 3.81%
Calgary Sales:
Overall sales in Sept were 11 more than in August. Traditionally we see sales dropping in September, so this is not all that normal. I believe that this is mainly due to pent-up demand and a lack of supply making people search longer to find their home.
Sales Compared to 2020:
Total sales were up by 26.7% over last year. As you can see in my chart the last 3 months have all been over last year by between 24.4% to 36.6%. As noted above I believe that this is mainly due to pent-up demand and a lack of supply making people search longer to find their home.
| Jan | Feb | Mar | Apr | May | June | |
| 2020 | 861 | 1190 | 1175 | 573 | 1080 | 1763 |
| 2021 | 1208 | 1836 | 2903 | 3209 | 2989 | 2915 |
| Change | +347 | +646 | +1729 | +2639 | 1,911 | 1,152 |
| % Change | +7.49 | +54.4 | 247% | +562% | 277.3% | 165.3% |
| July | Aug | Sept | Oct | Nov | Dec | |
| 2020 | 1835 | 1574 | 1702 | 1764 | 1437 | 1199 |
| 2021 | 2319 | 2151 | 2162 | |||
| Change | +484 | +577 | +456 | |||
| % Change | 126.4% | 136.6% | 126.7% |
Calgary Real Estate Benchmark Sales Prices:
Overall, the benchmark price changed very little this month. The total change for all sectors was a decline of $1,700. I sense this is because earlier in the year we saw some large increases, mostly due to competing offers and bidding wars and people were bidding very high just to get a new home. There is still a lot of competing offers, but I am not seeing the offers coming in as high as there are fewer offers and I believe some people are just saying they will wait for the next one.
Calgary Real Estate Benchmark Sales Price: See chart below.
Current Months of Inventory (Absorption Rate):
The Months of inventory decreased in all sectors due to the declining inventory. Currently detached are still in a seller’s market position, Semi-detached and Row houses are in a balanced market position and Apartment Condos are in a buyer’s market position however getting close to balanced.
It is also important to note that these numbers vary by community, and by price range. If you would like numbers for your community, or more specific numbers for your home please contact us.
Below is a summary of numbers in chart form. All numbers are taken from the Calgary Real Estate Boards monthly Stats package.
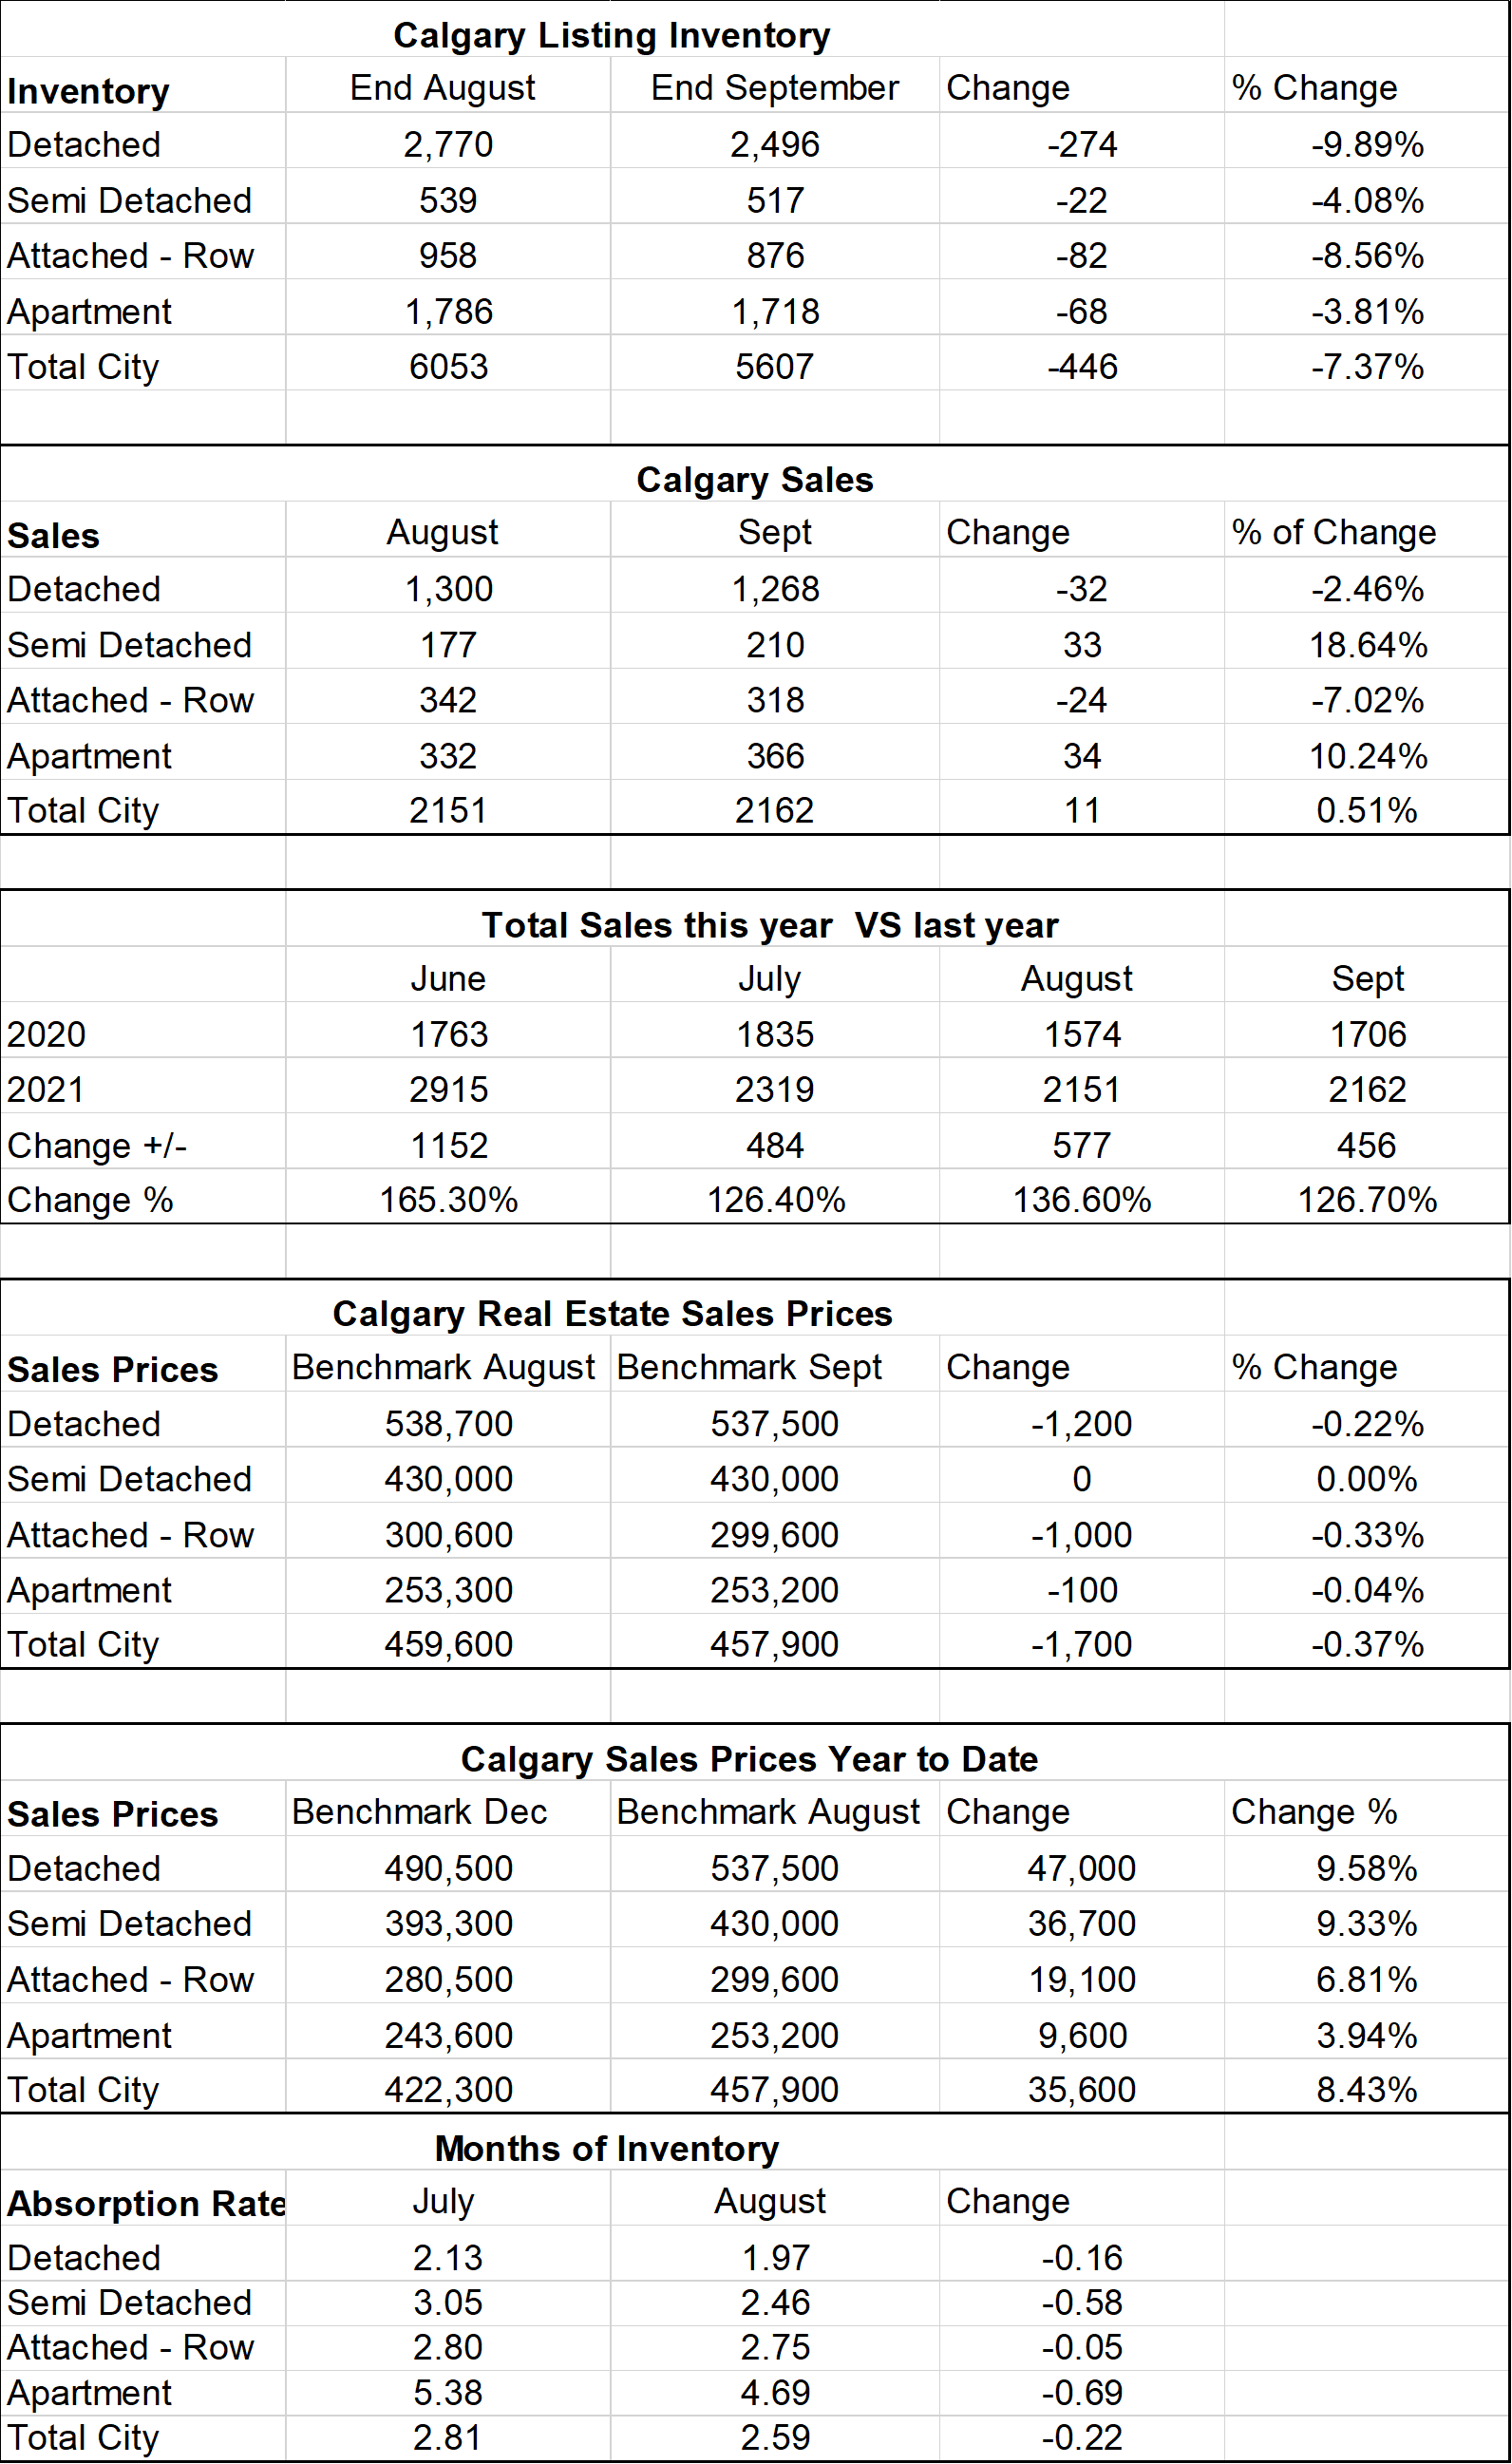
Chart shows inventory, sales, benchmark price and the months of inventory for all sectors of the Calgary housing market.