What is really happening in the Calgary Real Estate Market?
What is really happening in the Calgary Real estate Market
What is really happening in the Calgary Real Estate Market?
Stay ahead of everyone else by following our Monthly Market Snapshot of the Calgary Real Estate Market. This shows what’s really happening! The market is driven by supply and demand so here we show the inventory (supply) and sales (demand) and most importantly the relationship between the two and how it affects the price of Calgary Real Estate. A simple way to keep up to date with how the market is trending and to stay ahead of most! All numbers are taken from the Calgary Real Estate Boards Stats package for Realtors. I have also included some general comments which are simply my opinion.
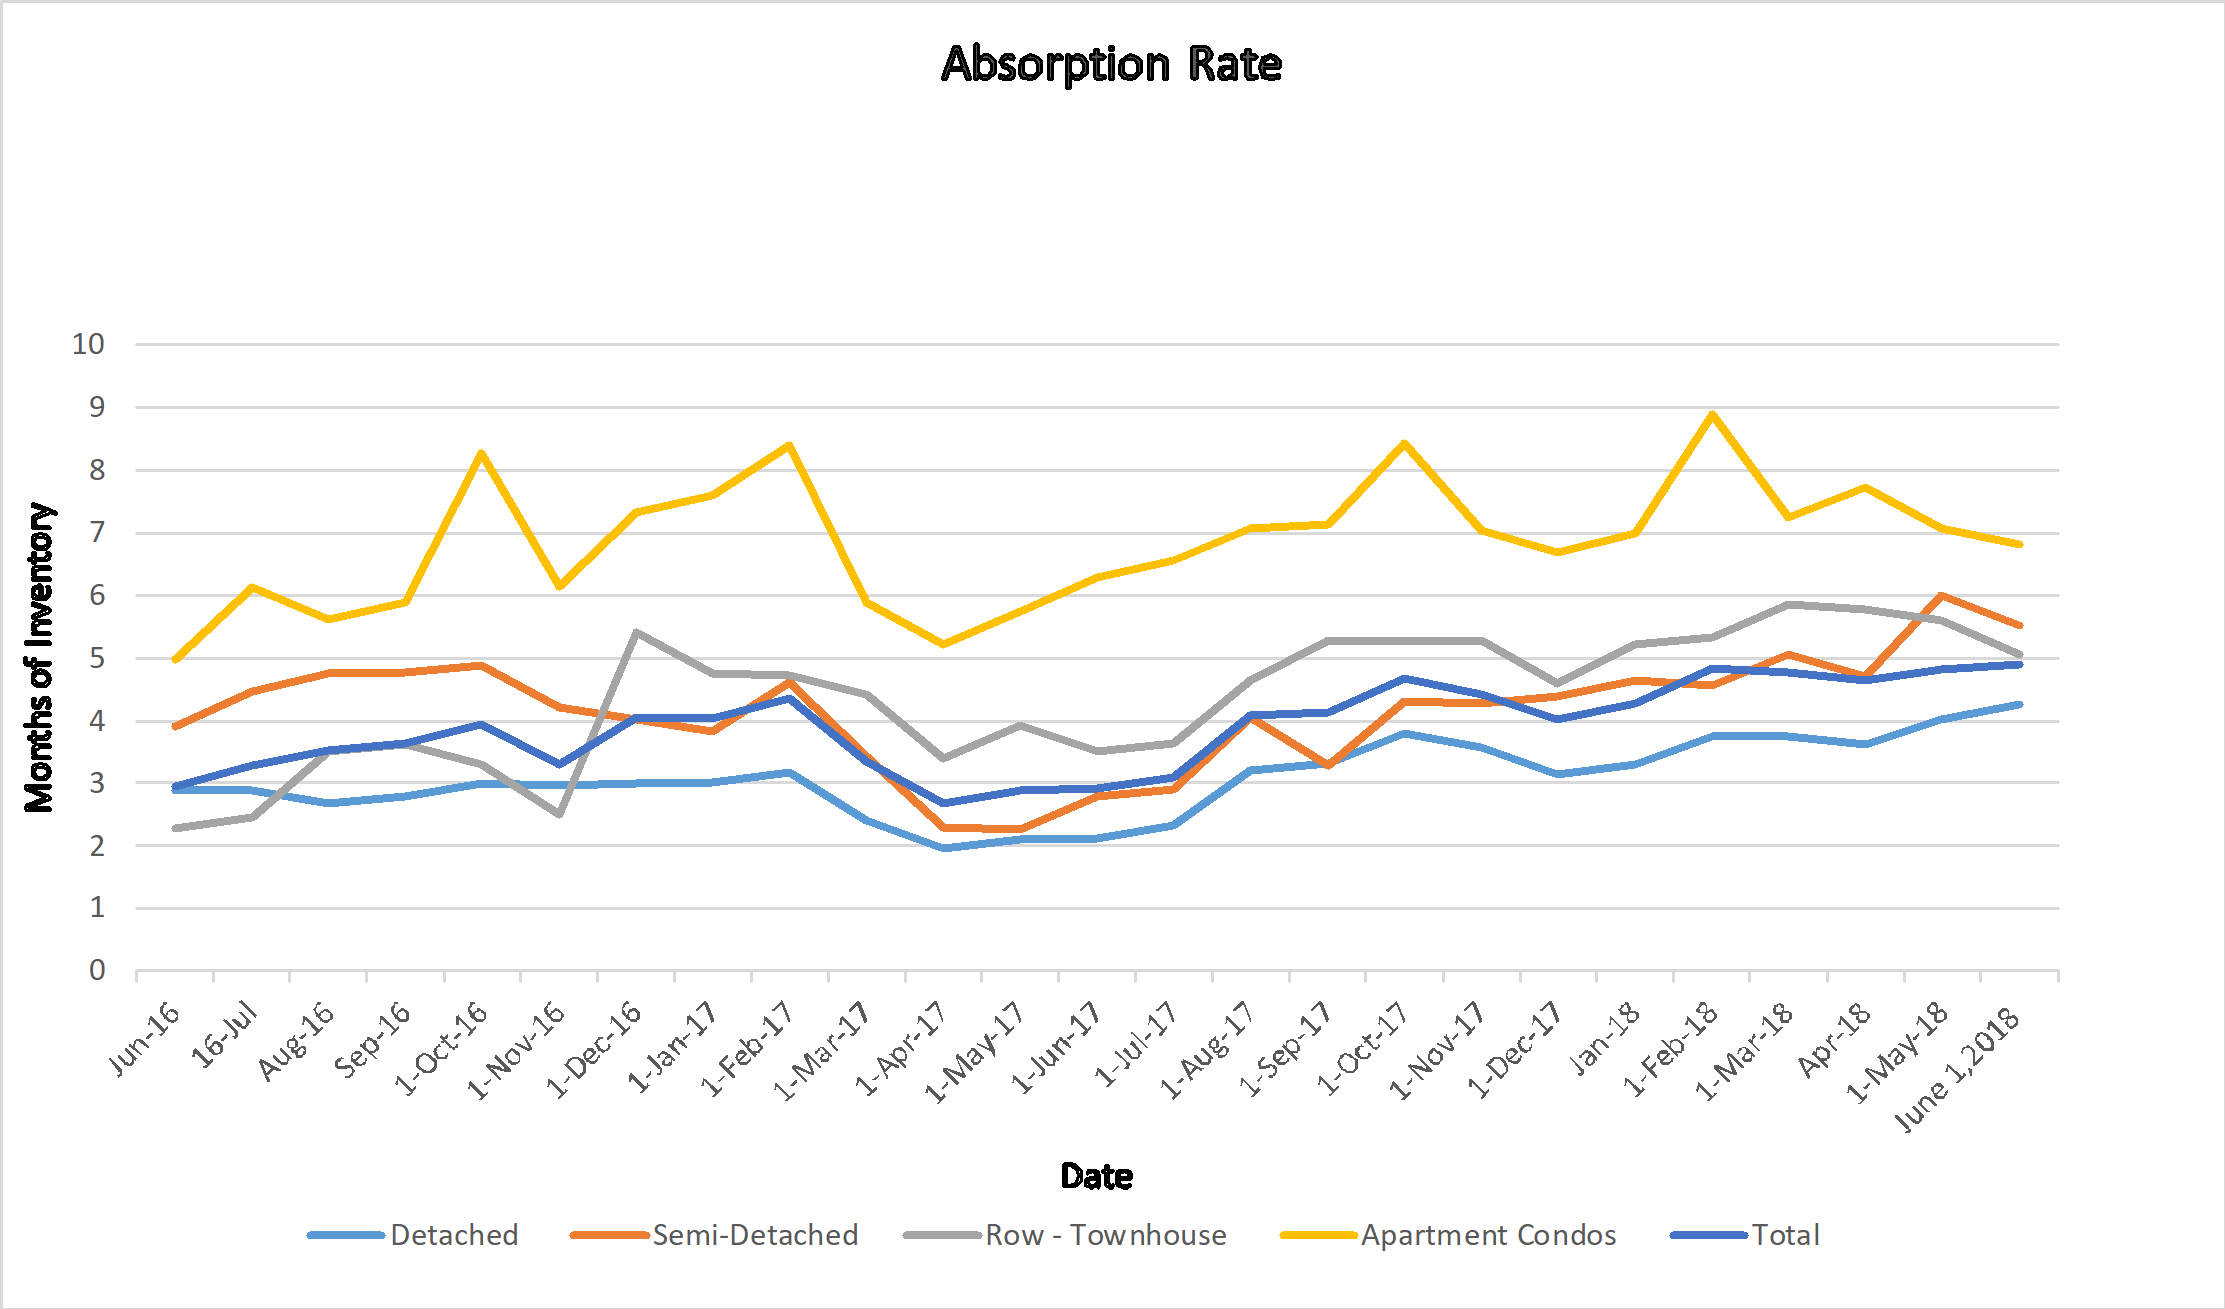
Absorption Rate (Months of Inventory) – the inventory divided by the number of sales in the last month). What does this mean you might ask?
| Buyer’s Market |
>4.0 |
Drives prices down |
| Balanced Market |
Between 2.4 to 4.0 |
Prices typically remain stable |
| Seller’s Market |
<2.4 |
Drives prices up |
Current Absorption Rate
No major fluctuations here this month. Detached homes went up a little while all other categories went down between .25 and .54
| End of |
Apr 2018 |
May 2018 |
Change |
| Detached |
4.01 |
4.26 |
0.25 |
| Semi Detached |
6.00 |
5.53 |
-0.47 |
| Attached – Row |
5.60 |
5.06 |
-0.54 |
| Apartment |
7.06 |
6.81 |
-0.25 |
| Total City |
4.82 |
4.90 |
0.07 |
Calgary Listing Inventory
In April, our inventory increased in all Sectors. This is totally expected at this time of year and we should expect this trend to continue for another month anyways.
| Inventory |
Apr 2018 |
May 2018 |
Change |
| Detached |
3642 |
4504 |
862 |
| Semi Detached |
756 |
862 |
106 |
| Attached – Row |
1075 |
1163 |
88 |
| Apartment |
1851 |
1921 |
70 |
| Total City |
7324 |
8450 |
1126 |
Calgary Sales:
The good news is that sales are up from last month in all categories. Looking at the bigger picture we are still substantially down from last year’s sales. May showed 18.4% less sales than May 2017. This however is an improvement as April sales were down 20.3% from last April.
| Calgary Sales |
Apr 2018 |
May 2018 |
Change |
% Change |
| Detached |
908 |
1058 |
150 |
16.52% |
| Semi Detached |
126 |
156 |
30 |
23.81% |
| Attached – Row |
192 |
230 |
38 |
19.79% |
| Apartment |
262 |
282 |
20 |
7.63% |
| Total City |
1518 |
1726 |
208 |
13.70% |
Calgary Real Estate Sales Prices:
Prices in April showed very little change. Attached-Row houses showed the largest gain of $3,200. while Semi-Detached homes showed the largest decrease of $1,000.
| Sales Prices |
Apr 2018 Benchmark Price |
May 2018 Benchmark Price |
Change |
| Detached |
504,500 |
504,500 |
0 |
| Semi Detached |
420,000 |
419,000 |
-1,000 |
| Attached – Row |
300,000 |
303,200 |
3,200 |
| Apartment |
256,700 |
256,200 |
-500 |
| Total City |
436,500 |
436,900 |
400 |
Sales Prices “Year to Date”
Same as monthly number
| Sales Prices |
Jan 1, 2018 Benchmark Price |
May 2018 Benchmark Price |
Change
$ |
% Change |
| Detached |
499,600 |
504,500 |
4,900 |
0.98% |
| Semi Detached |
416,600 |
419,000 |
2,400 |
0.58% |
| Attached – Row |
299,500 |
303,200 |
3,700 |
1.24% |
| Apartment |
257,700 |
256,200 |
-1,500 |
-0.58% |
| Total City |
433,200 |
436,900 |
3,700 |
0.85% |
**Please note that these numbers include only Calgary homes and do change on a community basis and more so for towns. This report does not include rural properties. If you would like to find stats on your community just let me know. If you have any questions about this summary or about Real Estate in general, please feel free to contact us.