What is really happening in the Calgary Real Estate Market?
Following is a graph that shows the months of inventory for each housing sector. Looking at a one-year trendline gives you an indication of where things are really heading.
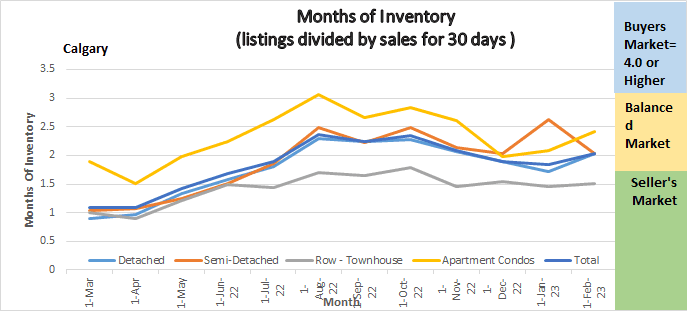
Months of Inventory Calgary Real Estate
Gord’s commentary for the month (just my opinion).
December 2022 Highlights
The Calgary Market is exploding again, as an agent I feel like I am reliving 2022!
- Our inventory edged up slightly.
- Demand for homes under the $600,000 price range has exploded, as long as listings are priced reasonably I am seeing between 5-15 offers on most listings, and of course they are selling well above list price.
- Sales increased marginally over December.
- Months of Inventory increased slightly.
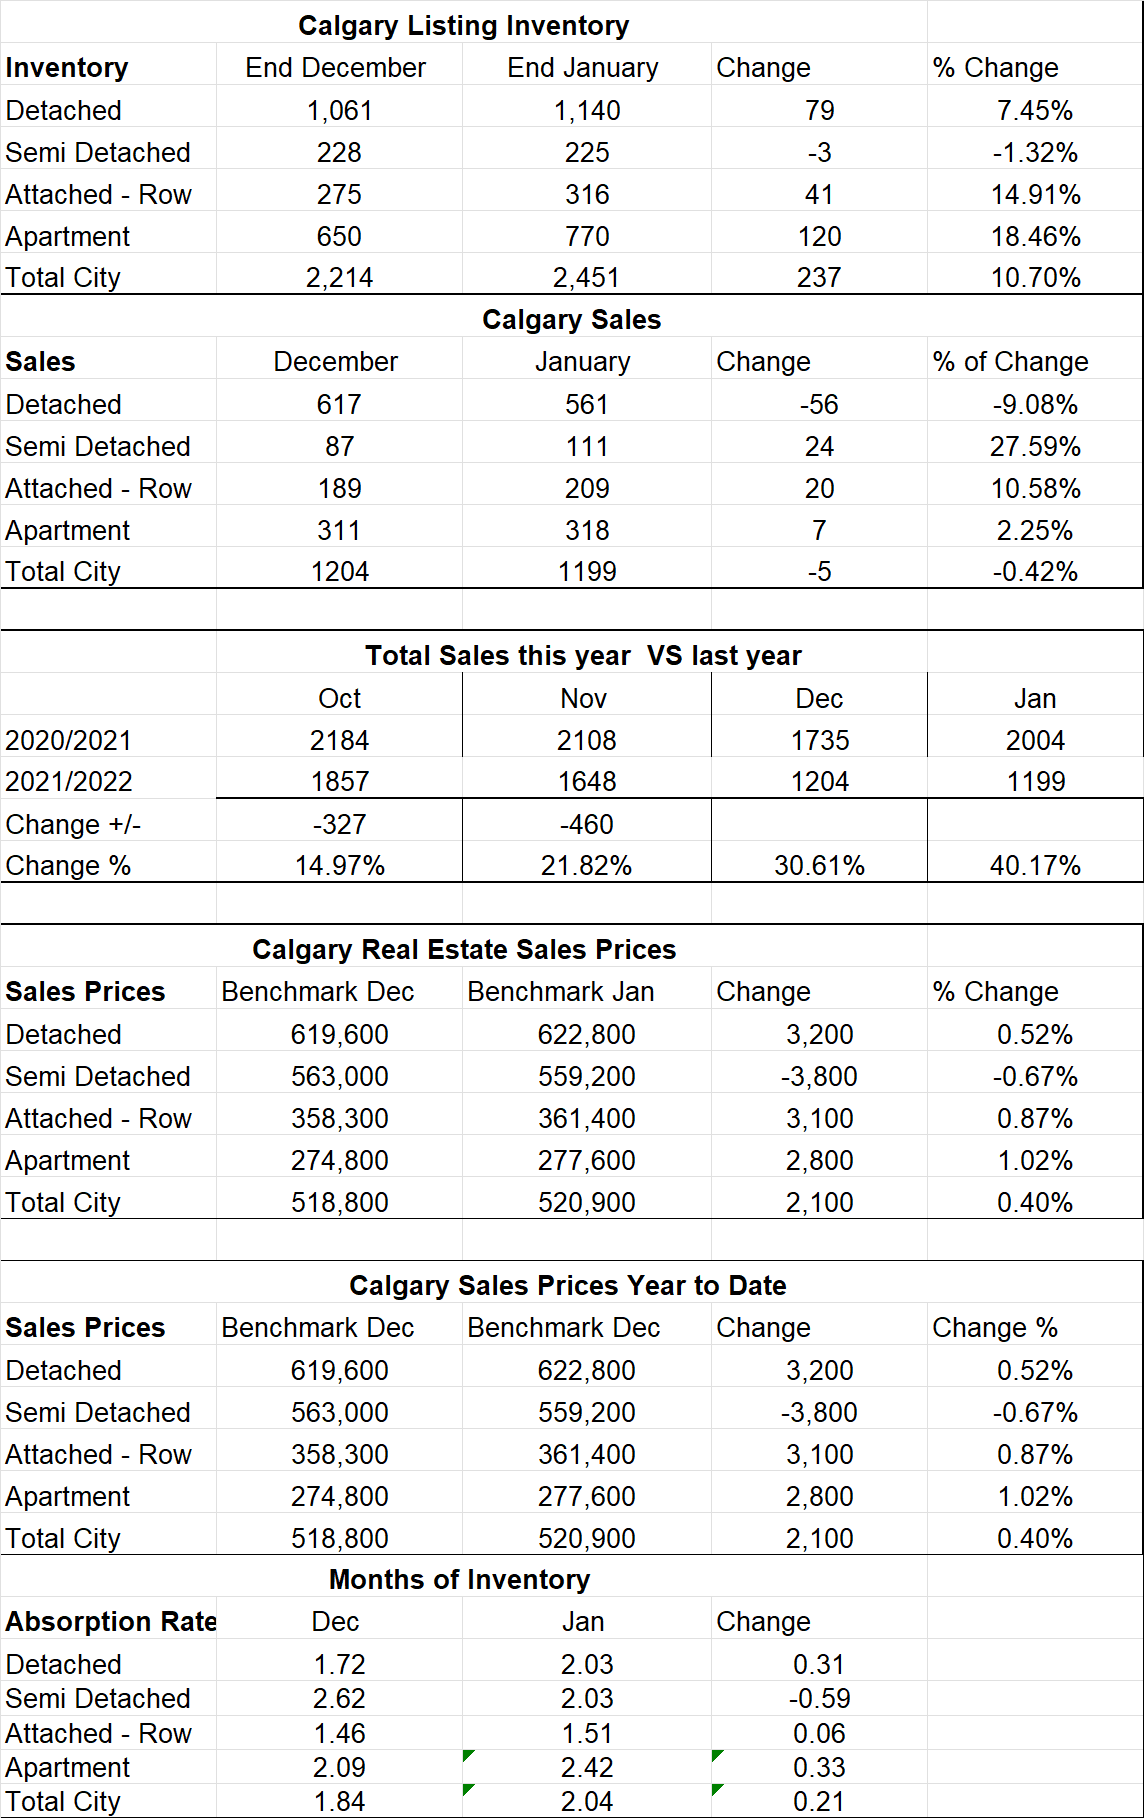
Calgary Listing Inventory
Listing inventory increase an overall of 10.7% this month. Keep in mind that December is typically the lowest inventory months and the next several months you will see increases. The economist for the Calgary Real Estate Board indicated that the level of new listings in January fell to the lowest level seen since the late 90s.
Calgary Sales:
Total Sale in January were 5 less than in December or down .42% It is critical to understand this is in no way a lack of demand, but a lack of supply (inventory).
Sales Compared to 2022:
It is also important to look at sales compared to the Previous year. Sales for December were down 40.1% when compared to last December of 2022. Although this looks like a substantial number, we also need to consider that last December is when things in the Calgary Real Estate Market started getting heated so not meeting last years sales does not concern me at all. As noted above if we had more inventory sales would have been higher – it is supply not demand causing lower sales.
| Jan | Feb | Mar | Apr | May | June | July | |
| 2022 | 2004 | 3305 | 4107 | 3401 | 3071 | 2842 | 2254 |
| 2023 | 1199 | ||||||
| Change | -805 | ||||||
| % Change | -40.1% |
Calgary Real Estate Benchmark Sales Prices:
The overall benchmark price increased by $2,100 for January. Increases were in all sectors except for Semi-Detached homes which saw a decrease of $3,800.
Calgary Real Estate Benchmark Year to Date Sales Price: See chart below.
Same as above.
Current Months of Inventory (Absorption Rate):
The months of inventory increased a total of .21. This increase was in all sectors except Semi-Detached homes which decreased by .59 Even with the slight increase every sector is currently in a seller’s market position.
Below is a summary of numbers in chart form. All numbers are taken from the Calgary Real Estate Boards monthly Stats package.
All numbers vary by community and price ranges, if you would like stat specifically for your neighborhood, please contact us.
Calgary Real Estate Stats for 2023 – Information from the Calgary Real Estate Board
Calgary Real Estate Stats