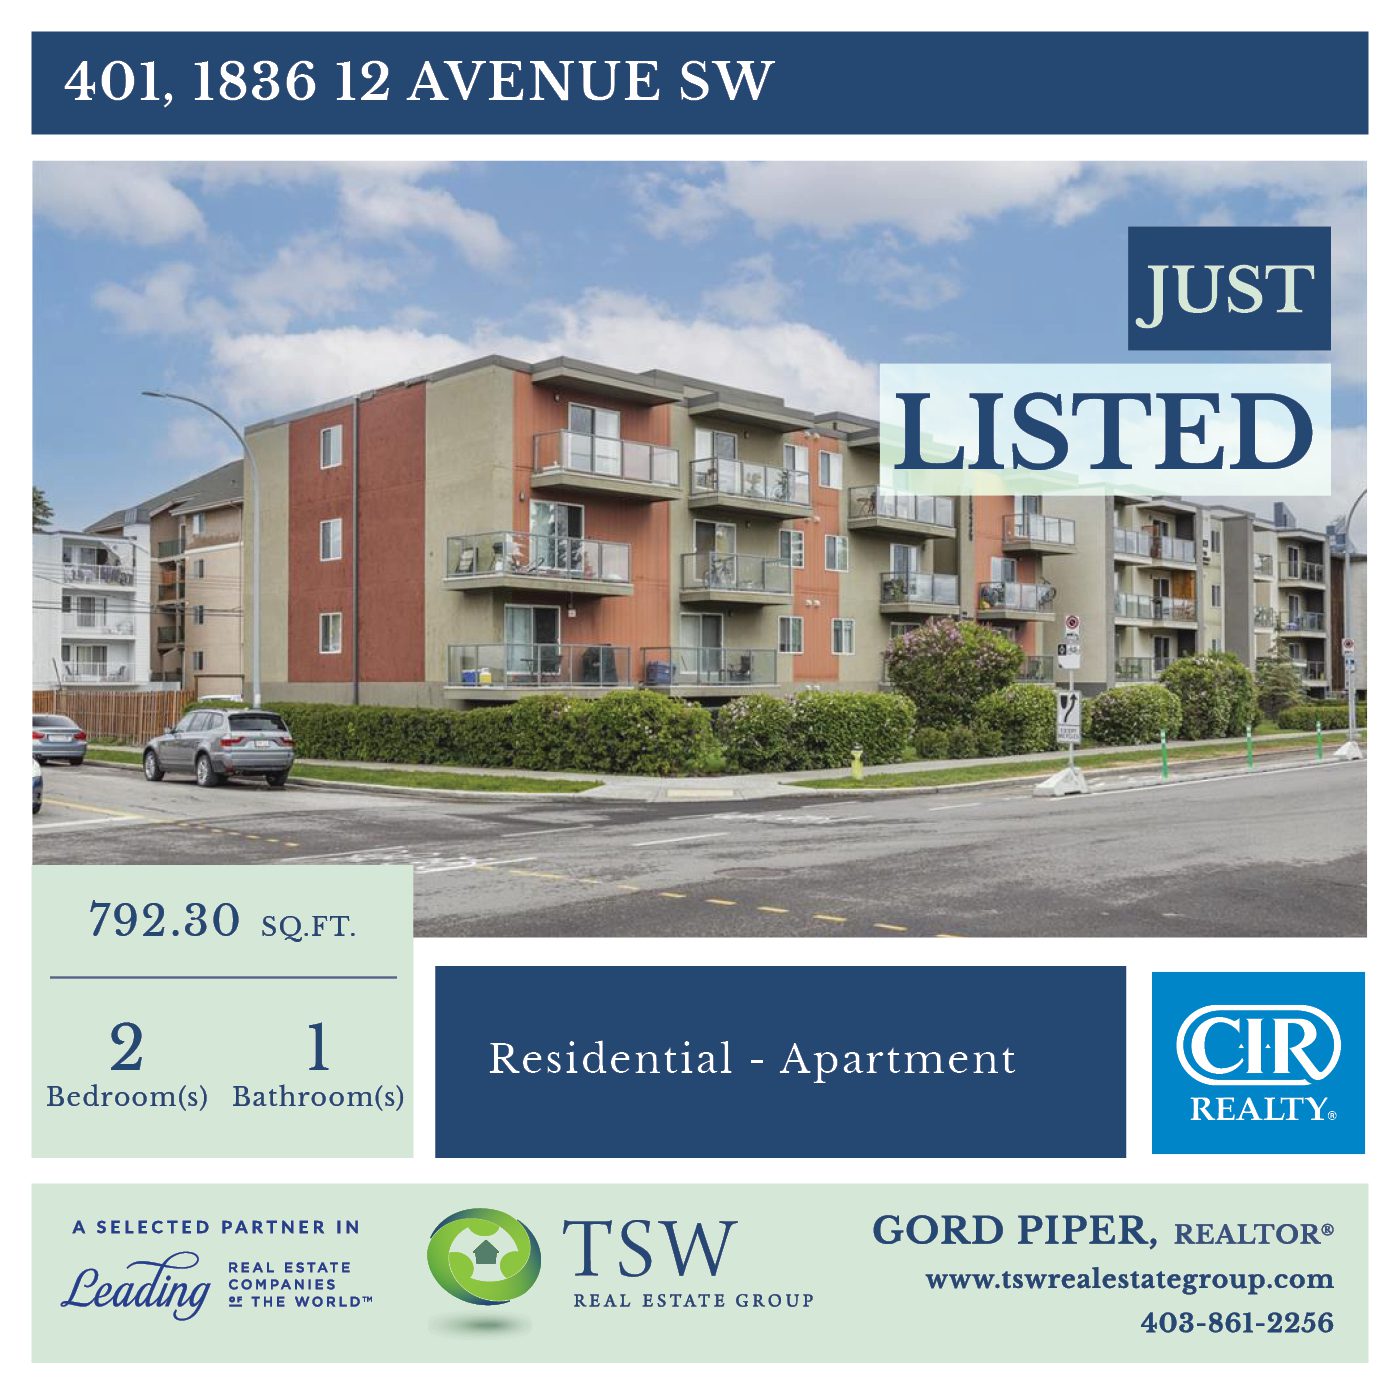
Just listed this awesome unit
Highlights: Top Floor, Open Concept Living and Per Friendly!
MLS: A1230355
Link to More Details: https://www.tswrealestategroup.com/for-sale/401-1836-12-avenue-sw–75384583
Just listed this awesome unit
Highlights: Top Floor, Open Concept Living and Per Friendly!
MLS: A1230355
Link to More Details: https://www.tswrealestategroup.com/for-sale/401-1836-12-avenue-sw–75384583
What is really happening in the Calgary Real Estate Market?
Change is happening
Following is a graph that shows the months of inventory for each housing sector. Looking at a one-year trendline gives you an indication of where things are really heading.
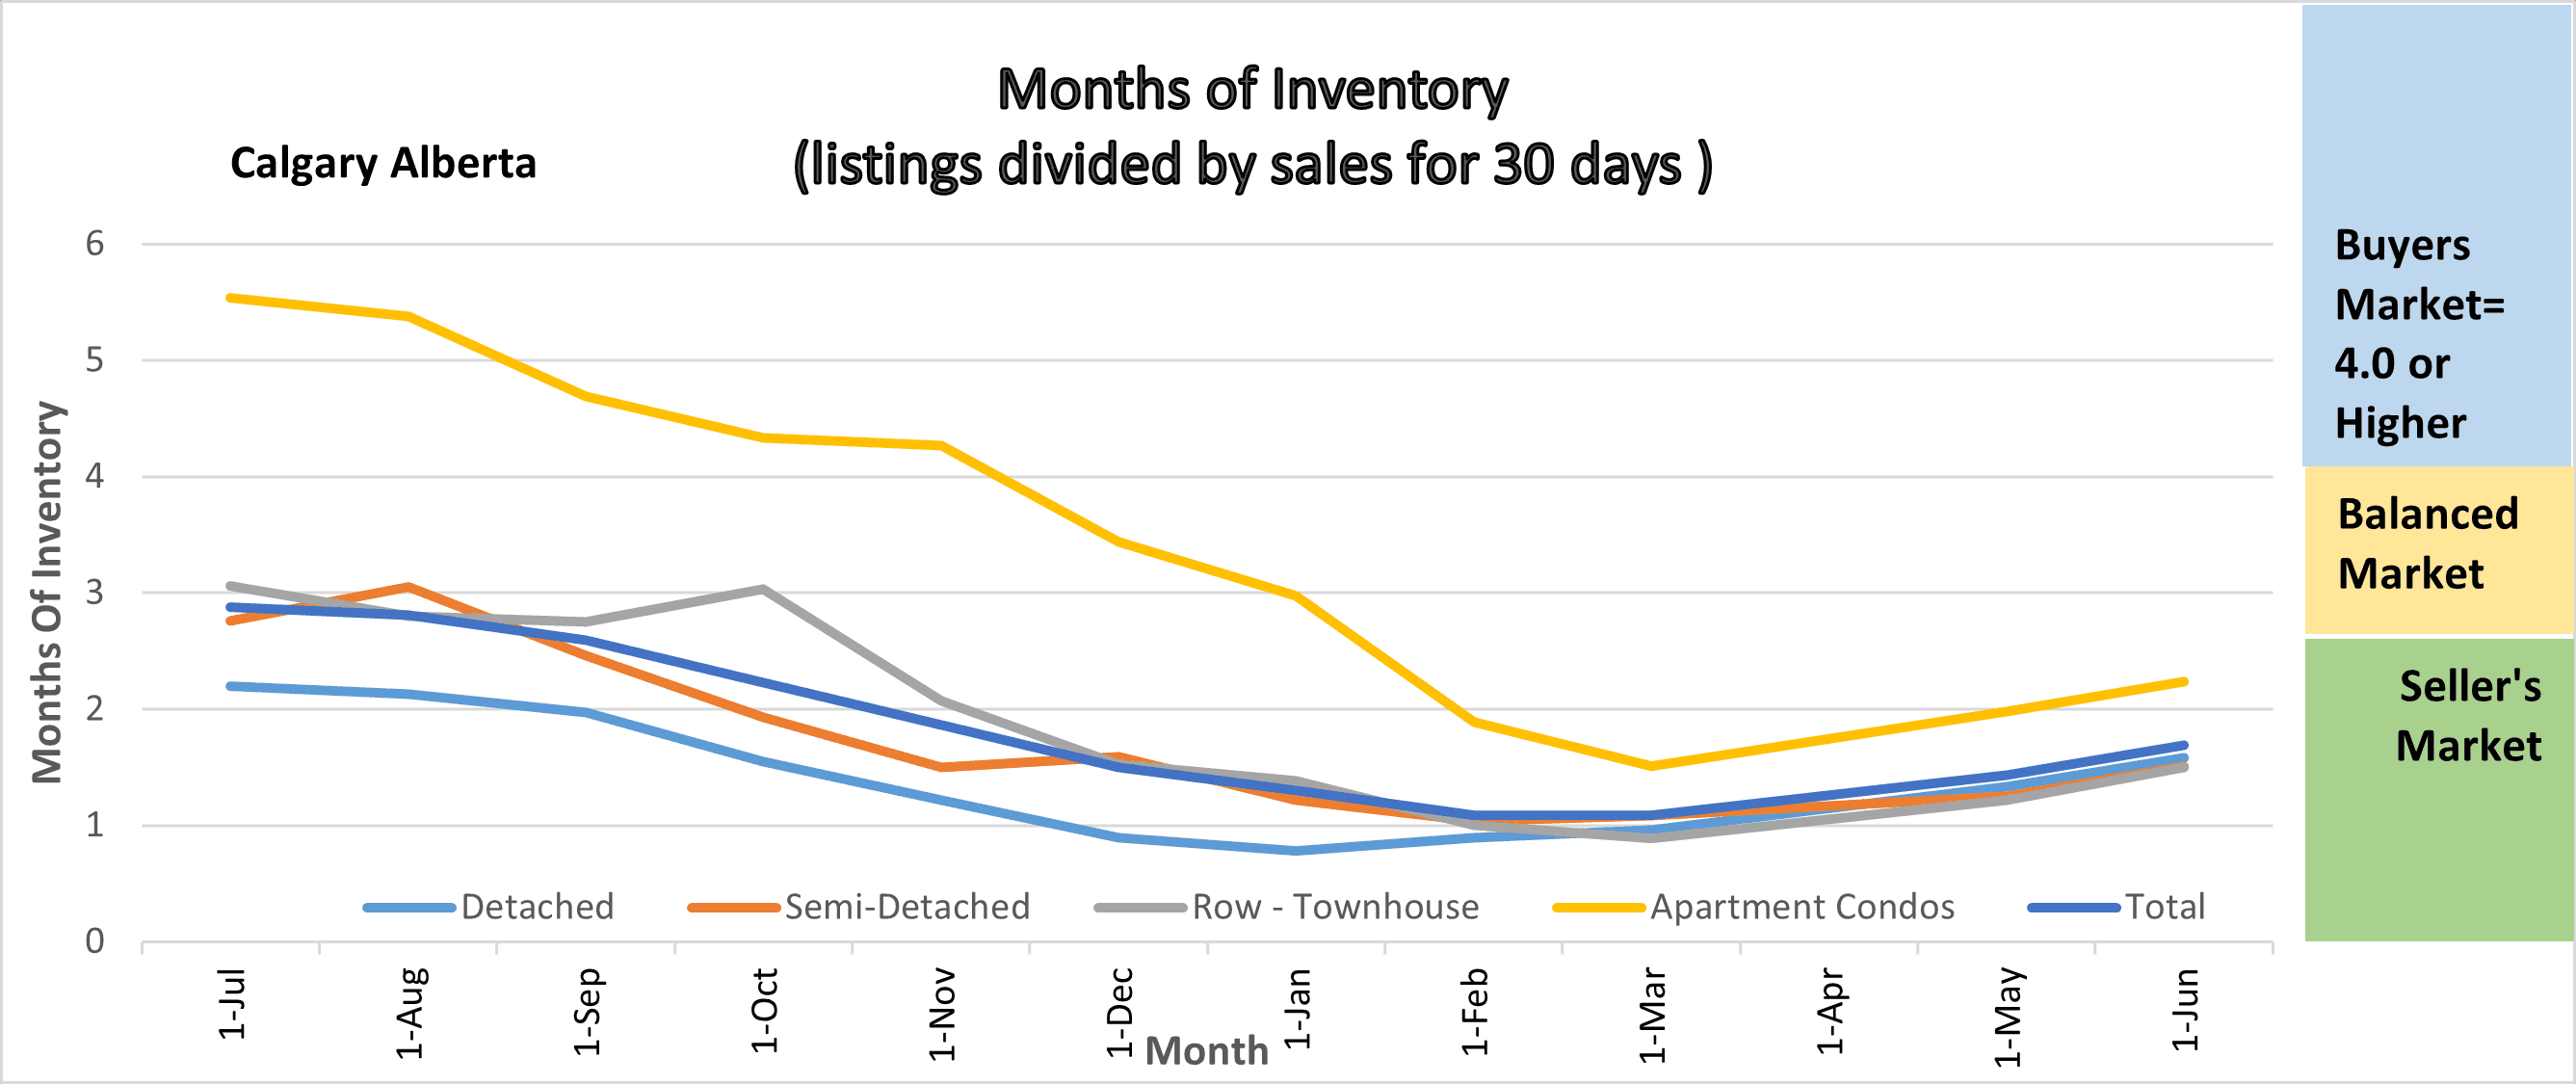
Months of Inventory
Gord’s commentary for the month (just my opinion).
May 2022 Highlights
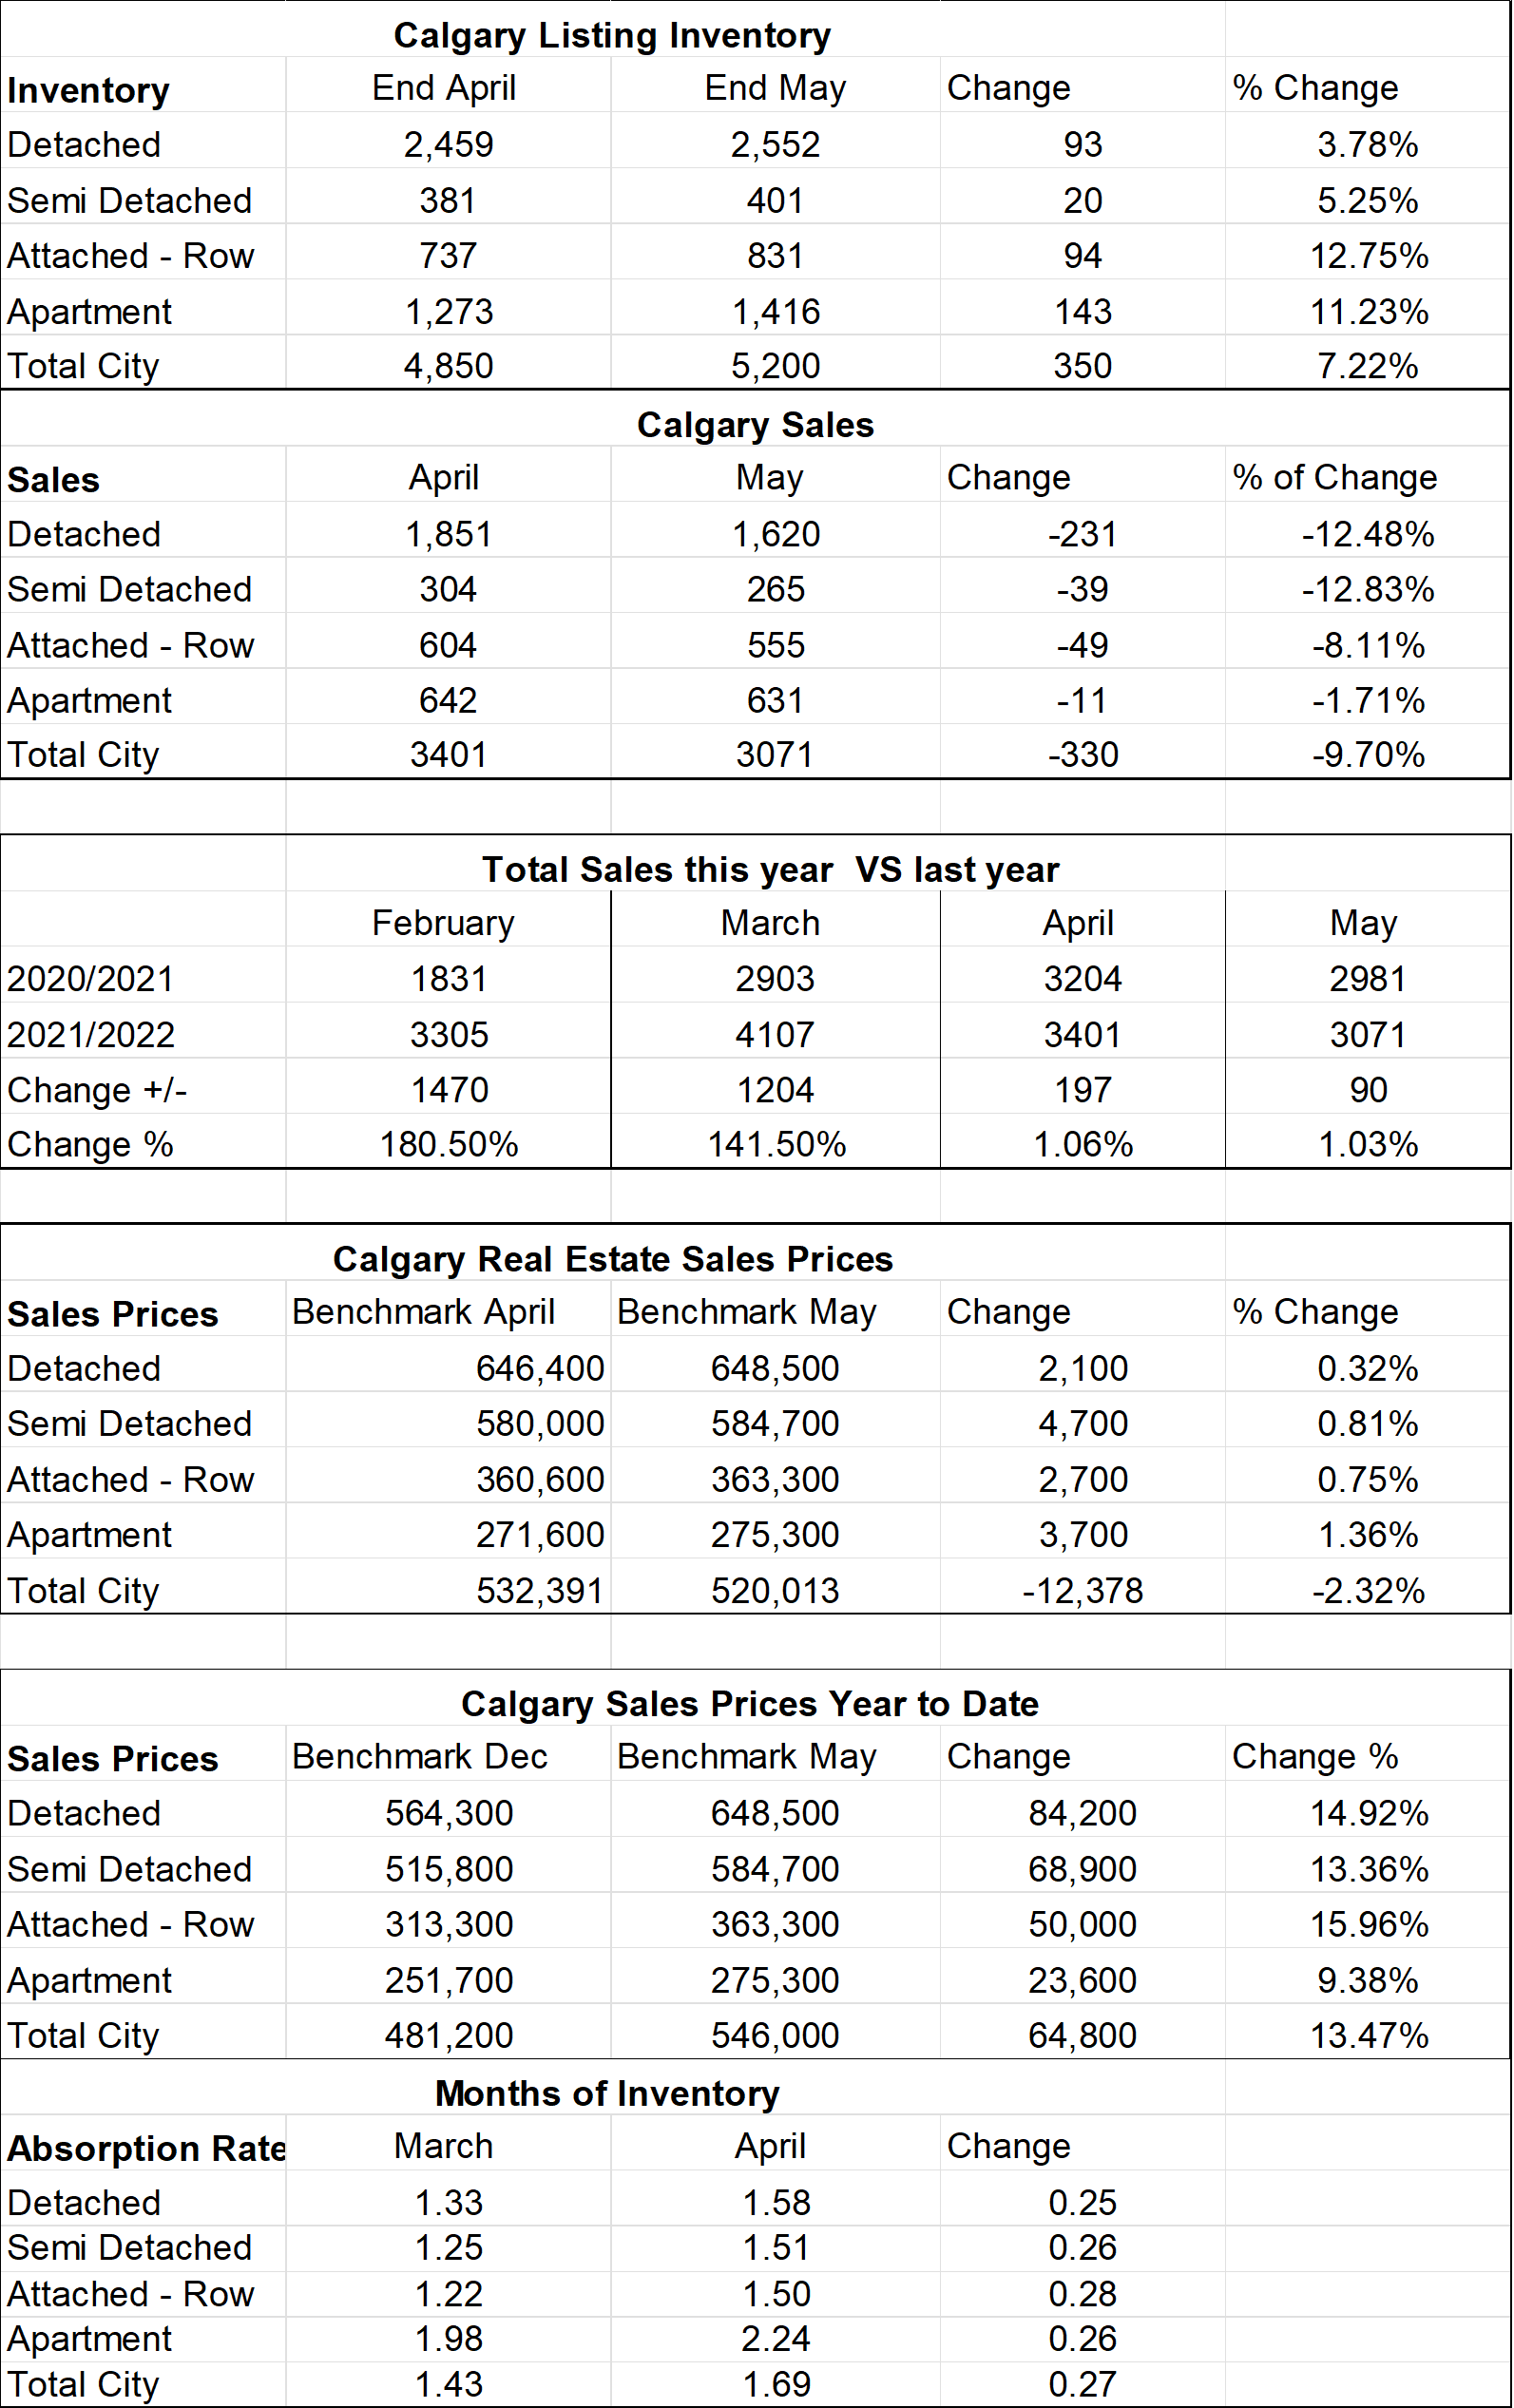
Calgary Listing Inventory
Listing inventory increased in all sectors combined by a total of 350 listings. Detached and Semi-Detached increased the least both under 6% while Apartment Condos and Row Houses increased by 11.2% and 12.75%. See chart below for details
Calgary Sales:
Sales in all categories decreased from April. The decrease for all sectors was less than 50 except detached homes where the decrease was 231 sales less. See chart below for details
Sales Compared to 2021:
Calgary home sales for May were just slightly higher than in May 2021 – by 90 Sales or 1.03%
| Jan | Feb | Mar | Apr | May | June | July | |
| 2021 | 1207 | 1831 | 2903 | 3204 | 2981 | ||
| 2022 | 2009 | 3305 | 4107 | 3401 | 3071 | ||
| Change | + 802 | 1474 | +1204 | +197 | 90 | ||
| % Change | + 66.4% | +180.5% | +141.5% | +1.06 | +1.03% |
| Aug | Sept | Oct | Nov | Dec | |
| 2020 | 1574 | 1702 | 1763 | 1438 | 1199 |
| 2021 | 2151 | 2162 | 2186 | 2110 | 1737 |
| Change | +577 | +456 | + 423 | +672 | +538 |
| % Change | 136.6% | 126.7% | 123.9% | 146.7% | 144.9% |
Calgary Real Estate Benchmark Sales Prices:
*Note: If you have been following my reports you may have noticed some changes in the Benchmark Prices compared to my last report. The Calgary Real Estate Board has changed how they calculate the Benchmark Price. It is my understanding that previously they used numbers all the way back to 2005 when the Home Price Index was introduced. The new method is to only use the last 5 years so as communities change the benchmark price will more quickly reflect the change.
The benchmark price for all sectors increased combined increased marginally (between $2,100 to $4,700. See chart below for details
Calgary Real Estate Benchmark Year to Date Sales Price: See chart below.
Year to date all sectors have seen substantial increases with the highest increases being in the detached sector. See chart below for details.
Current Months of Inventory (Absorption Rate):
The months of inventory increased in all sectors in May by between .25 and .28. We are seeing all sectors creep up weekly. All sectors currently remain in a seller’s market position however Apartment condos are just about into a balanced market again.
What might the rest of 2022 bring: (again just my opinion)
Based on what I am seeing we are on our way towards a more balanced market. At this stage it has been a gradual increase however we will see what impact today’s interest rate increase has – I think it will slow things down even more.
Below is a summary of numbers in chart form. All numbers are taken from the Calgary Real Estate Boards monthly Stats package.
Select Stats from the Calgary Real Estate Board