What is really happening in the Calgary Real Estate Market?
Following is a graph that shows the months of inventory for each housing sector. Looking at a one-year trendline gives you an indication of where things are really heading.
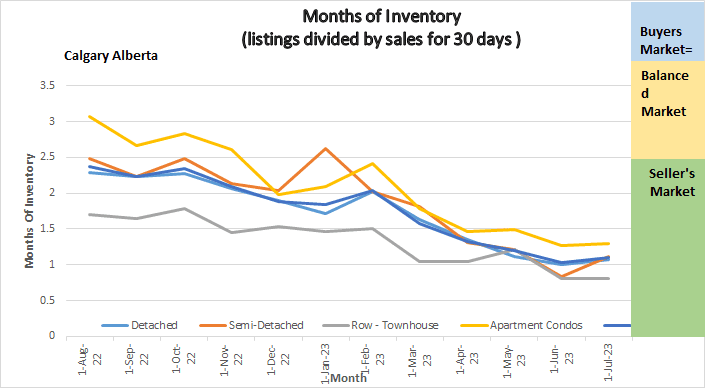
Months of Inventory
Gord’s commentary for the month (just my opinion).
May 2023 Highlights
The Calgary Market is continuing at a blistering pace!
- Another new sales Record – 3146 Sales
- Prices continue the upward trend.
- New listings increased resulting in a sale increase.
- Listing inventory remains very low.
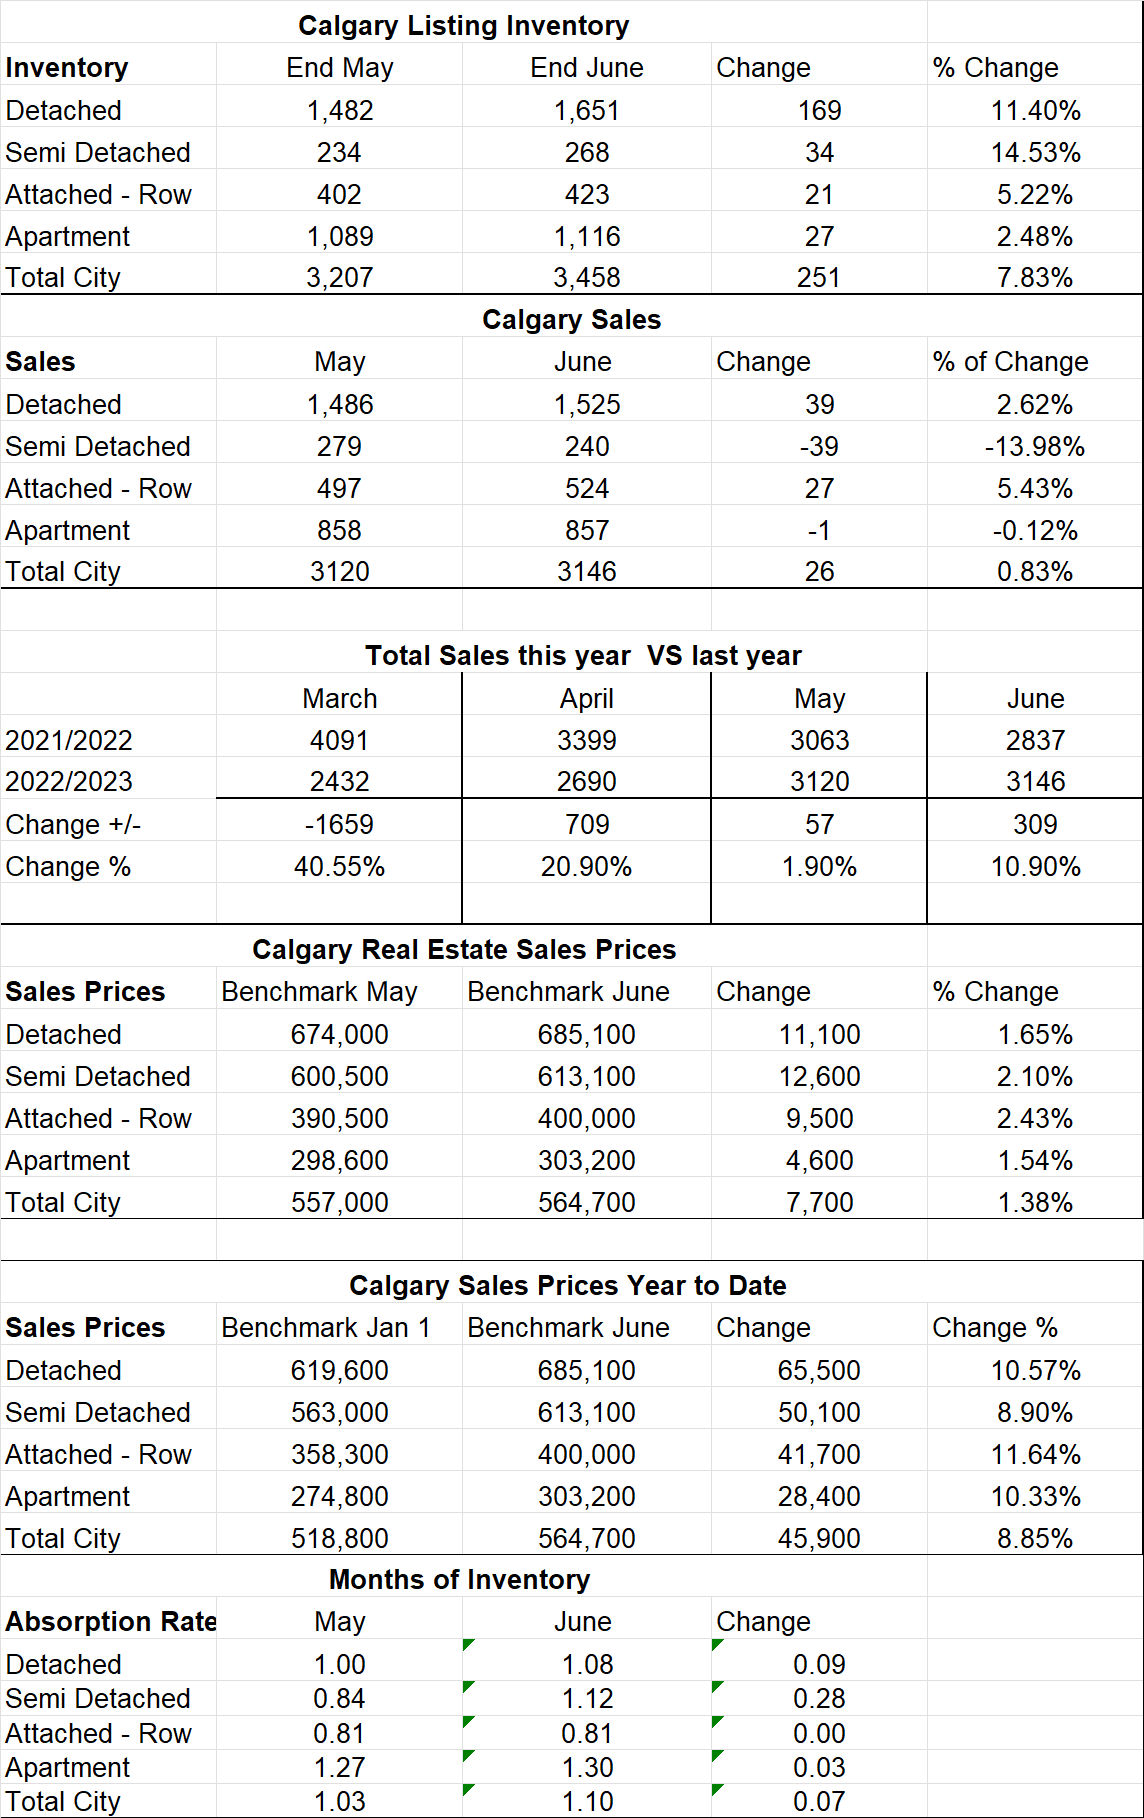
Calgary Listing Inventory
Our listing inventory remains very low with a total of 3457 listings on the market, an increase of 251 since June 1, 2023. Its important to note that new listings are trending slightly up, but they are being absorbed so the inventory is not increasing like we typically expect at this time of the year.
Calgary Sales:
Sales in June set another new record high with 3146 sales, an increase of 26 sales from May. What is interesting is that sales in June were 309 above June sales which is 10.9% higher than last year. I still believe that one of the largest reasons for the continuous increase in sales in the increased level of immigration. For the time being I do not see anything that is going to change that trend so I predict we will continue to see strong sales at least through the end of this year.
Sales Compared to 2022:
It is also important to look at sales compared to the Previous year. Sales for April were 711 less than last year. Again, in my opinion this is simply due to not having enough Inventory on the market.
| Jan | Feb | Mar | Apr | May | June | July | |
| 2022 | 2004 | 3305 | 4091 | 3401 | 3071 | 2837 | |
| 2023 | 1199 | 1740 | 2432 | 2690 | 3120 | 3146 | |
| Change | -805 | -1565 | -1659 | -711 | +57 | +309 | |
| % Change | -40.1% | -47.4% | -40.55% | -20.9% | +1.9% | +10.9% |
Calgary Real Estate Benchmark Sales Prices:
The overall benchmark price continues to increase. The overall benchmark price increased by $7,700 or 1.38% All sectors increased fairly equally.
Calgary Real Estate Benchmark Year to Date Sales Price: See chart below.
For all of Calgary we have so far seen an increase in all sectors of 8.85% or $45,900. The lowest dollar increases so far has been apartment condos at $28,400 and the highest is Detached homes at $65,500.
Current Months of Inventory (Absorption Rate):
Months of Inventory has finally started to turn the corner with an overall increase from 1.03 to 1.10 which still leaves us in a deep Sellers Market.
My Prediction for what is ahead: Based on what is driving demand (immigration) and the fact I do not see that changing any time soon, I predict sales are going to remain strong and prices are going to continue to trend upwards. One thing I am seeing on the street is even though we are still in a very strong sellers market, the buyers are starting to act much more cautiously and while their offers are still often coming in above list price they are coming in only a little above list compared to what I was seeing a few months ago.
**Below is a summary of numbers in chart form. All numbers are taken from the Calgary Real Estate Boards monthly Stats package.
*All numbers vary by community and price ranges, if you would like stats specifically for your neighbourhood, please contact us.
Calgary Real Estate Board Stats