What is really happening in the Calgary Real Estate Market?
The market is a result of Supply and Demand therefore we look at both Supply (inventory) and Demand (Sales) and the relationship between the two. We also update you on the current benchmark price for all housing sectors.
Following is a graph that shows the months of inventory for each housing sector. Looking at a 2-year trendline gives you an indication of where things are really heading.
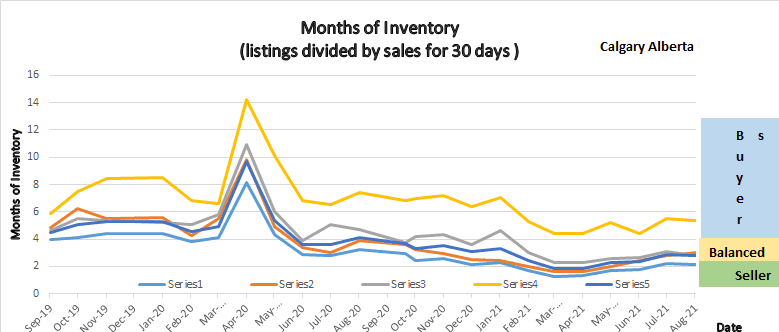
Graph shows 2 years of Months of Inventory for every sector in the Calgary housing market.
Gord’s commentary for the month (just my opinion).
August saw a decline in inventory of 9.36%, and a decline in sales of 7.24% causing our months of inventory to decline very slightly. Prices were mostly stable this month.
Calgary Listing Inventory
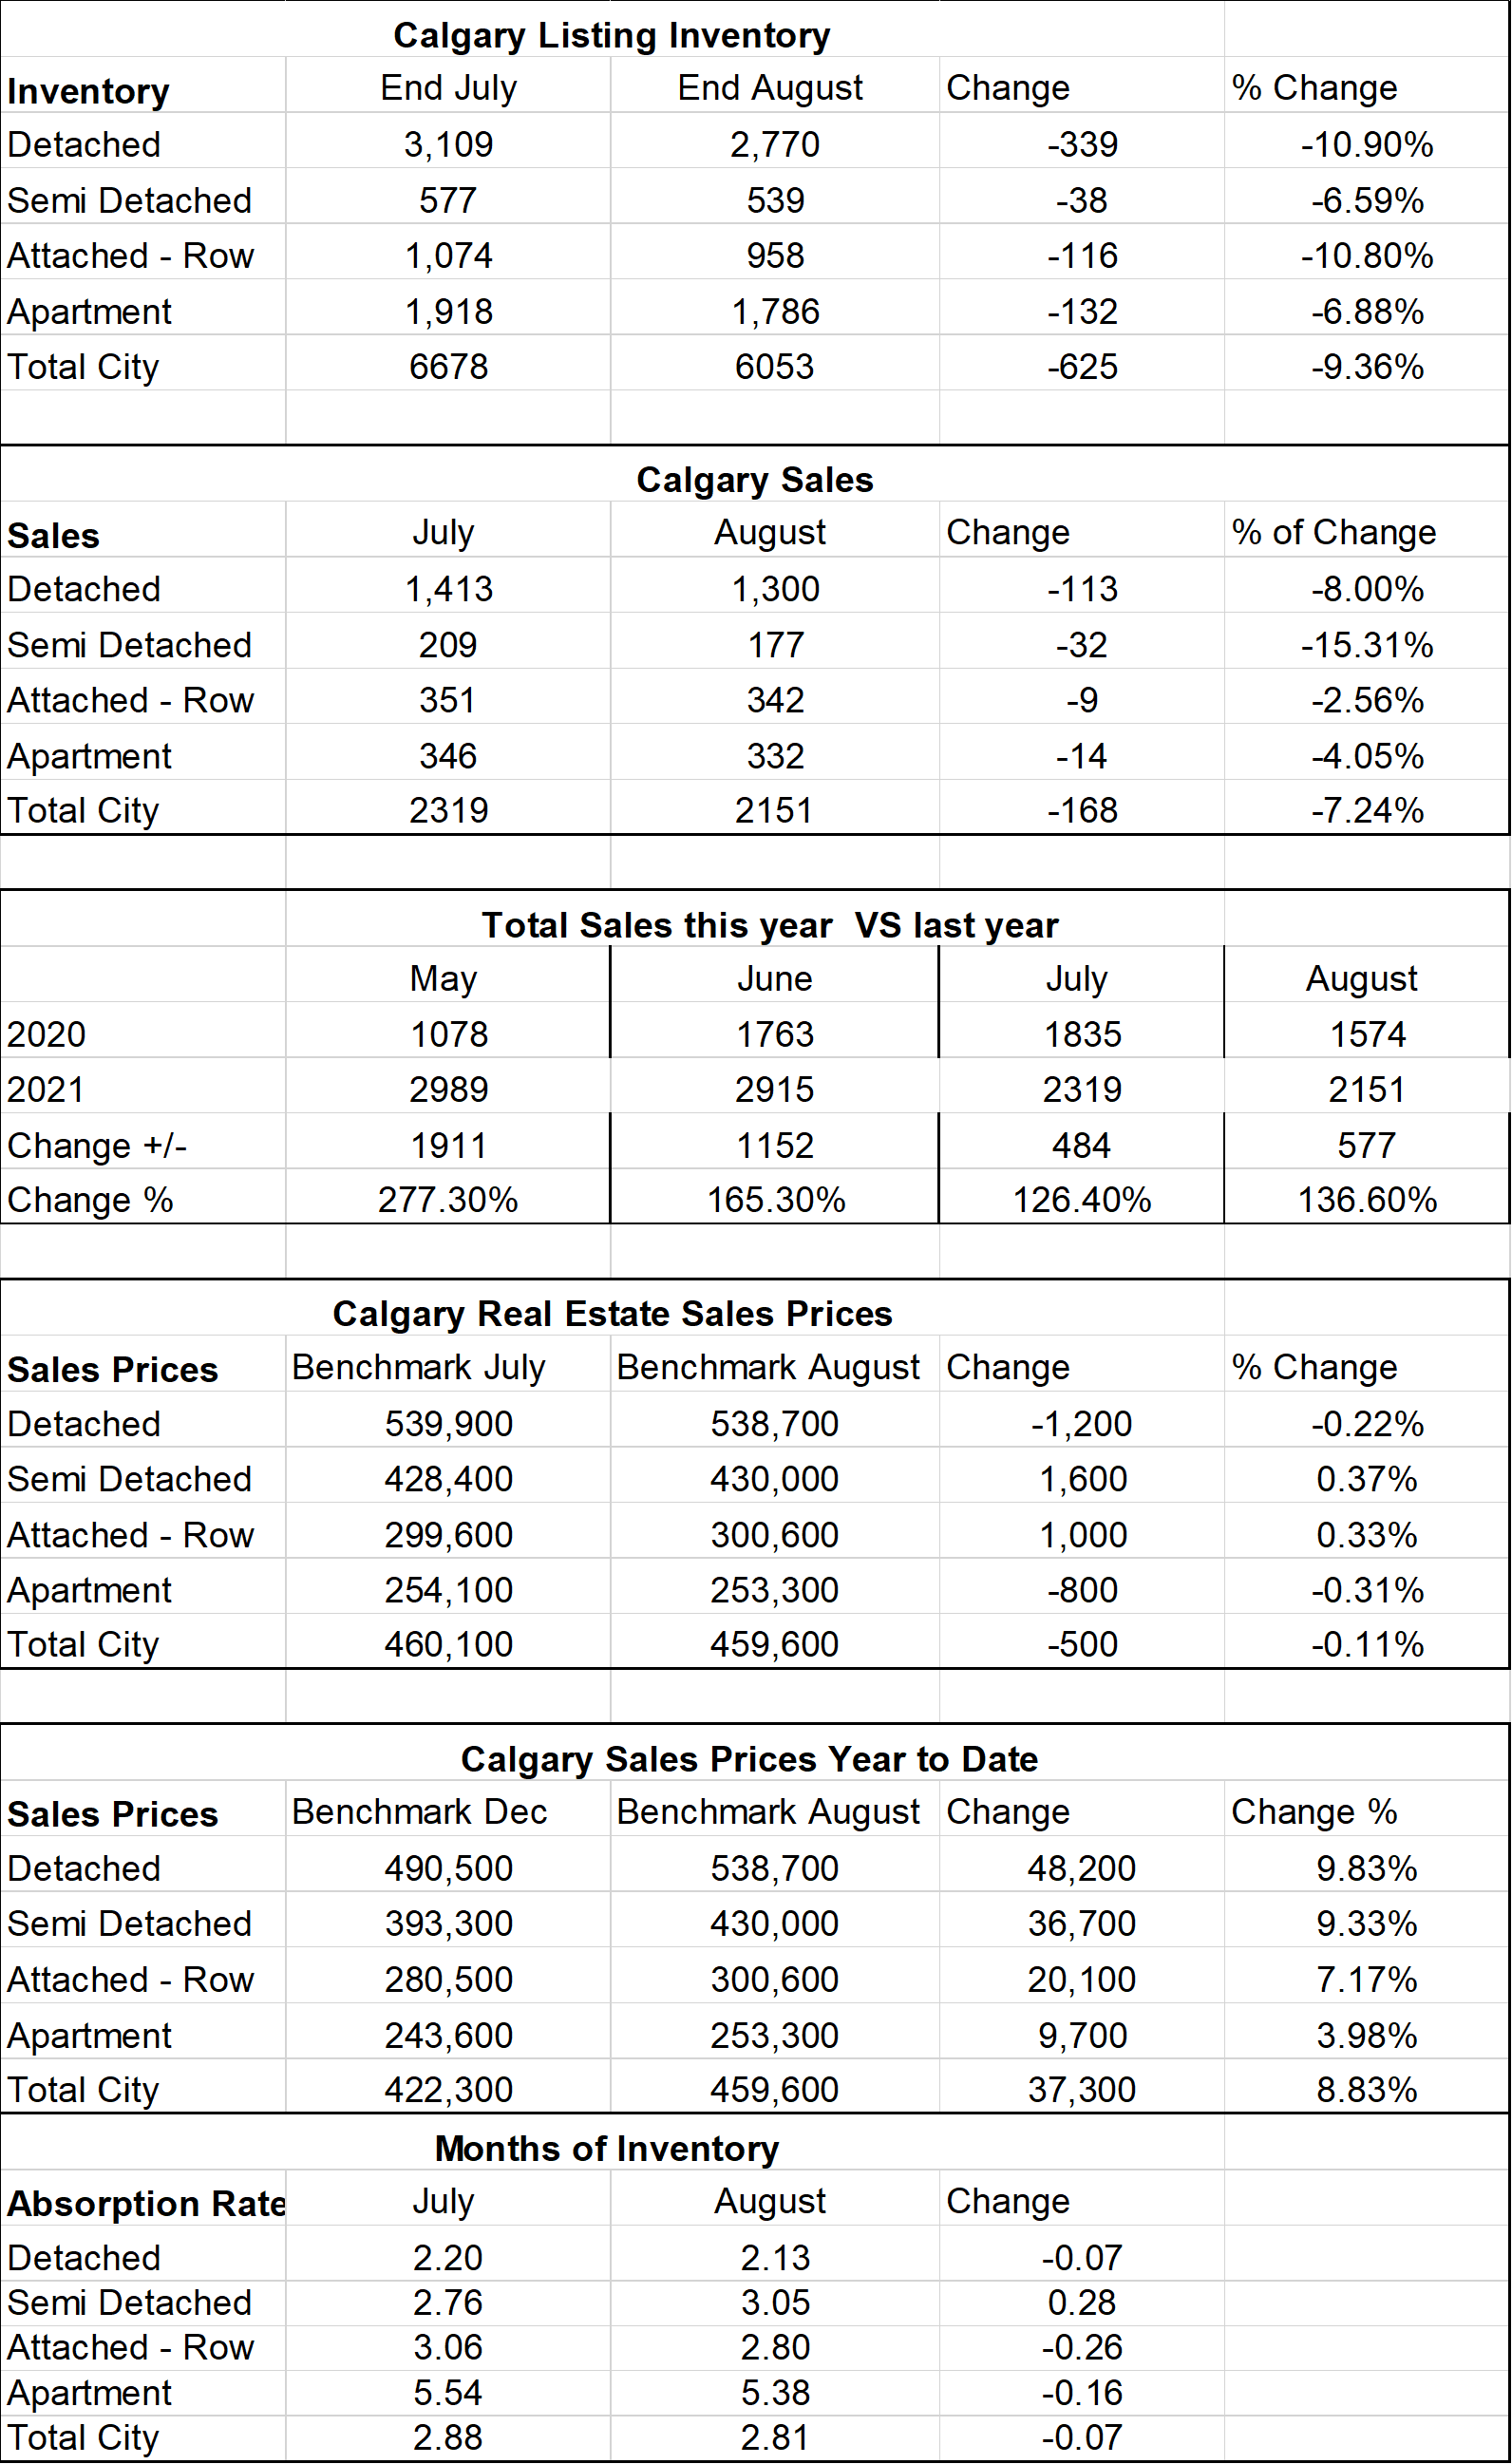
Typically, at this time of year, we see our inventory start to climb. This year that is not the case as our overall inventory declined by 625 listings. The majority of the decline (339) were in the Detached home sector. I believe the reason for this is there is still a pent-up demand and there are many people still shopping for that perfect home.
Calgary Sales:
Sales declined from July by a total of 168 fewer sales or 7.24%. The majority of this is in the Detached home sector losing 113. It is worth noting that typically sales show a decline from July to August so this is very normal.
Sales Compared to 2020:
Total sales were up by 36.6% over last year. It is important to note that August sales did not break a record like in July however sales were 25% higher than long-term trends. Normally this is a good category to watch however we are still comparing sales this year to when we were in a slower market due to Covid. As you can also see every month the sales over last years are declining and this is a normal trend.
| Jan | Feb | Mar | Apr | May | June | |
| 2020 | 861 | 1190 | 1175 | 573 | 1080 | 1763 |
| 2021 | 1208 | 1836 | 2903 | 3209 | 2989 | 2915 |
| Change | +347 | +646 | +1729 | +2639 | 1,911 | 1,152 |
| % Change | +7.49 | +54.4 | 247% | +562% | 277.3% | 165.3% |
| July | Aug | Sept | Oct | Nov | Dec | |
| 2020 | 1835 | 1574 | 1702 | 1764 | 1437 | 1199 |
| 2021 | 2319 | 2151 | ||||
| Change | +484 | +577 | ||||
| % Change | 126.4% | 136.6% |
Calgary Real Estate Benchmark Sales Prices:
Overall, the benchmark price in Calgary decreased in July by $500
Declines were seen in the Detached Home sector (-$1200) and the Apartment Condo sector (-$800)
Increases were in the Semi-Detached sector (+$1600) and in the Attached Row sector (+$1000)
You may wonder why prices decreased in the detached home sector when the Months of Inventory is still at 2.13 which is very much a seller’s market. I believe it’s because we have seen large increases in the last few months and things are slowing a little and settling down.
Calgary Real Estate Benchmark Sales Price: See chart below.
Current Months of Inventory (Absorption Rate):
The Months of inventory increased in the Semi-Detached sector and decreased marginally in all other sectors. For all sectors, combined Months of Inventory decreased by .07
It is also important to note that these numbers vary by community, and by price range. If you would like numbers for your community, or more specific numbers for your home please contact us.
Below is a summary of numbers in chart form. All numbers are taken from the Calgary Real Estate Boards monthly Stats package.
Key Market Stats taken from the Calgary Real Estate Boards monthly stats package for Realtors.