Another month of record sales and sharp price increases!
Following is a graph that shows the months of inventory for each housing sector. Looking at a one-year trendline gives you an indication of where things are really heading.
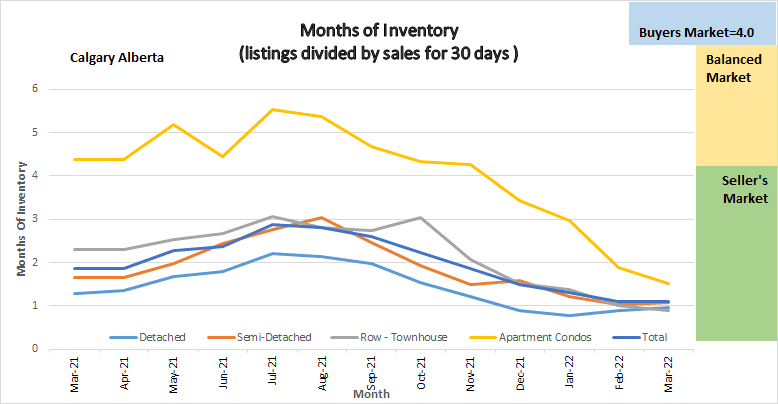
Graph shows the months of Inventory, for each sector in the Calgary Real Estate market for the last year so we can all see the trends.
Gord’s commentary for the month (just my opinion).
2022 Highlights
- All Sectors of the Calgary Real Estate Market continue to be in a deep seller’s Market position
- We continue to set monthly sales records.
- Prices are going up, quickly
- We are still running extremely low on Inventory
- Although new listings were 24% higher than last year total inventory only increased by 759 or 21%.
- All homes no matter what style are either going into multiple offers or are selling in a week.
Calgary Listing Inventory
Listing inventory increased in all sectors combined by a total of 764. Apartment condominiums saw the lowest inventory increase at 9.1% while all other sectors were between 18.5% to 29.8%.
Calgary Sales:
Overall sales were 24.3% higher than in February. For the second month in a row, sales activity not only reached a monthly high but also hit new record highs for any given month. Gains occurred across every property sector, and they all hit new record highs.
Sales Compared to 2021: This puts things into Perspective
Calgary home sales for March were 41.5% higher than total sales in March of 2021.
| Jan | Feb | Mar | Apr | May | June | July | |
| 2021 | 1207 | 1831 | 2903 | ||||
| 2022 | 2009 | 3305 | 4107 | ||||
| Change | + 802 | 1474 | +1204 | ||||
| % Change | + 66.4% | +180.5% | +141.5% |
| Aug | Sept | Oct | Nov | Dec | Year to Date | |
| 2020 | 1574 | 1702 | 1763 | 1438 | 1199 | 16,149 |
| 2021 | 2151 | 2162 | 2186 | 2110 | 1737 | 27,686 |
| Change | +577 | +456 | + 423 | +672 | +538 | 11,537 |
| % Change | 136.6% | 126.7% | 123.9% | 146.7% | 144.9% | 171.4% |
Calgary Real Estate Benchmark Sales Prices:
The benchmark price for all sectors increased in February.
Detached home sector increased by $24,100 or 4.04%
Semi-detached increased by $17,000 or 3.68%
Attached Row increased by $14,300 or 4.45%
Apartment Condos increased by $8,400 or 3.26%%
Calgary Real Estate Benchmark Year to Date Sales Price: See chart below.
Year to date all sectors combined have increased by $54,700 or 11.79%
Current Months of Inventory (Absorption Rate):
The months of inventory in the detached sector increased marginally by .07 while the Semi-Detached sector increased by .04
The months of inventory decreased in the Attached -Row sector by .38 and in the Apartment sector by .03
The overall months of inventory decreased by .03 so this leaves the entire market in a Seller’s Market position.
What might 2022 bring: (again just my opinion) – The same as last month.
We are now very deep into a seller’s market. As inventory increases (which typically happens in Mar to may) I believe the market will soften but, in the meantime, I believe we will see more substantial price increases. Many people are asking me why this is all happening, and I have some thoughts:
- Since 2015 sales have been low compared to the 10-year average so there is pent up demand
- Alberta’s economy is showing signs of improvement
- There are a substantial number of people moving here from Vancouver and Ontario
It is also important to note that these numbers vary by community, and by price range. If you would like numbers for your community, or more specific numbers for your home please contact us.
Below is a summary of numbers in chart form. All numbers are taken from the Calgary Real Estate Boards monthly Stats package.
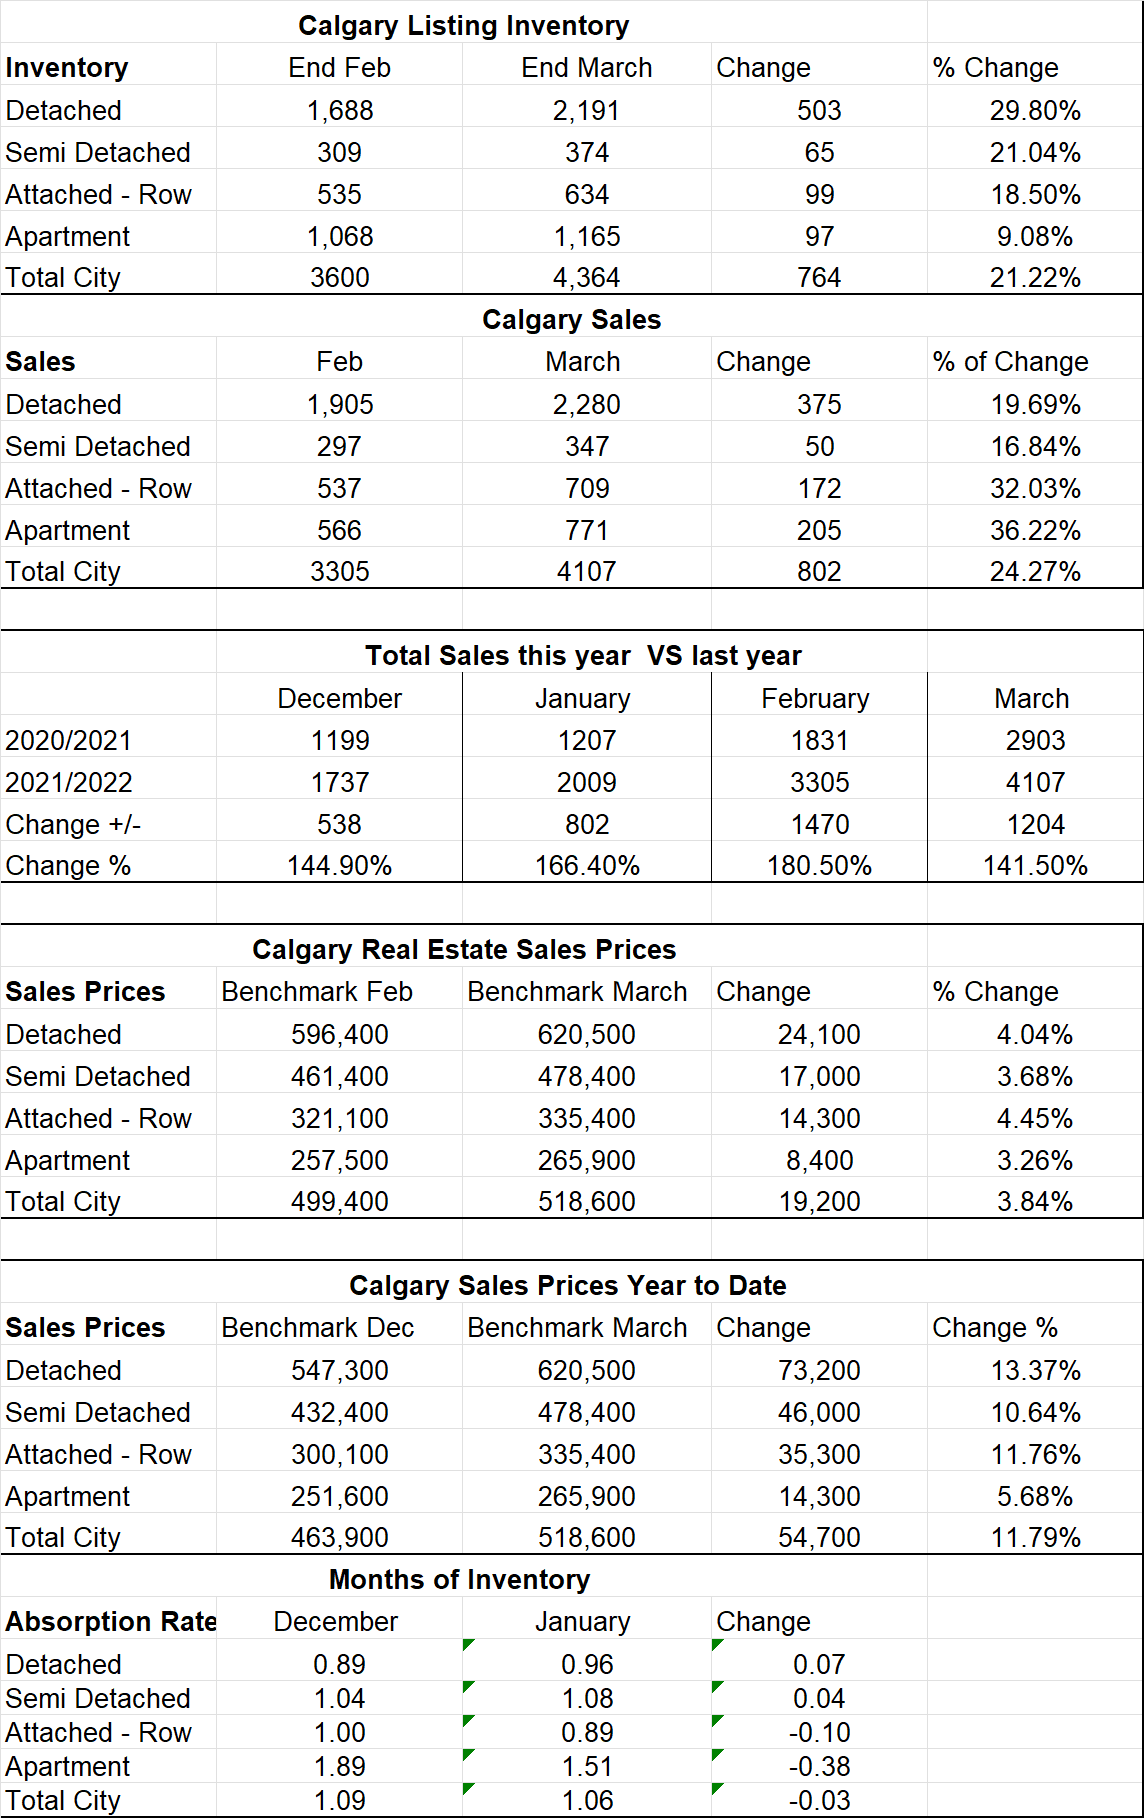
This chart contains key numbers from the Calgary Real Estate Boards Stats package for Agents. Numbers include inventory, sales, months of inventory and prices for all sectors of the Calgary Real Estate market.