What is really happening in the Calgary Real Estate Market?
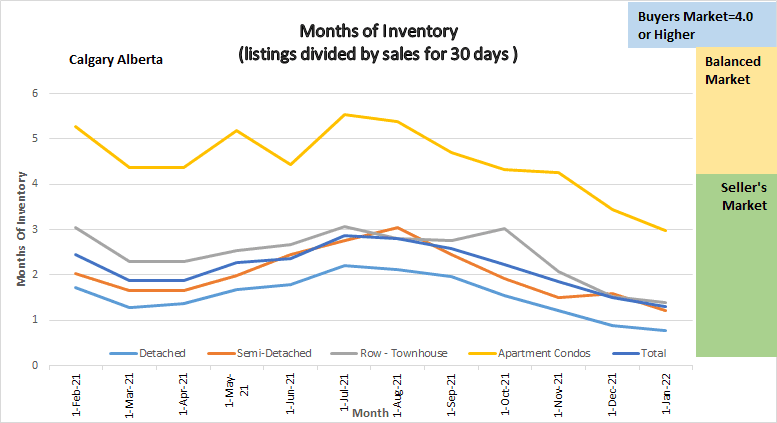
Following is a graph that shows the months of inventory for each housing sector. Looking at a one-year trendline gives you an indication of where things are really heading. Yes, we are moving into a deep Seller’s market.
The graph above shows the one year trend of Months of Inventory for all housing categories in the Calgary Real Estate Market
Gord’s commentary for the month (just my opinion).
2022 Highlights
- All Sectors of the Calgary Real Estate Market are in a Seller’s Market position
- Prices are going up, quickly
- We are running extremely low on Inventory
- Almost all Detached homes listed are going into multiple offers, I have seen many listings sell for between $50,000 to $100,000 over list price, and the odd one even above that.
Calgary Listing Inventory
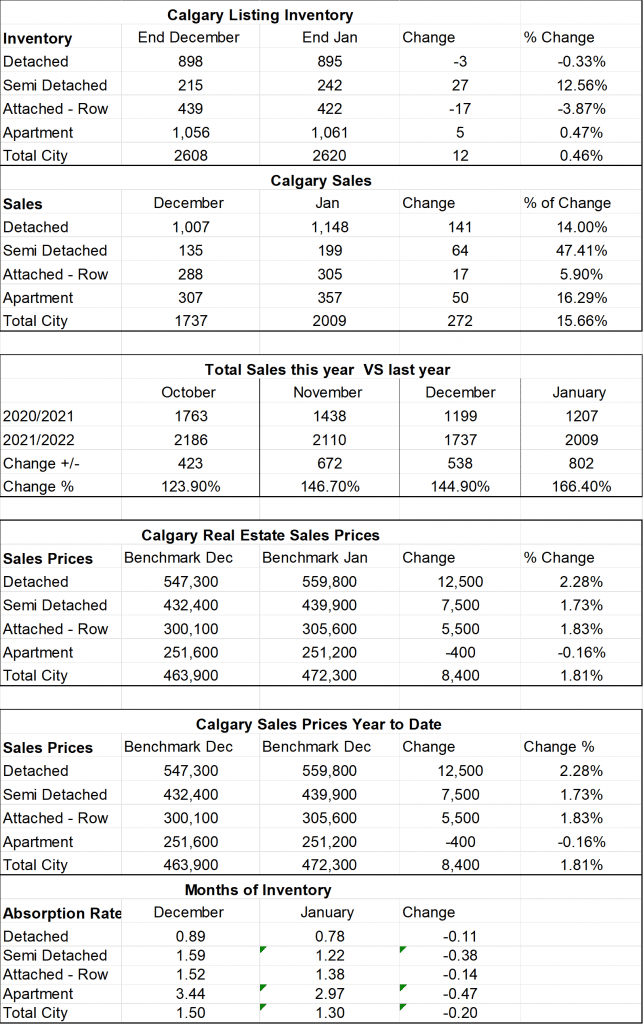
Listing inventory stayed the same as at the end of December. We listed 2,250 homes in January and basically sold them all.
Calgary Sales:
Sales in all sectors increased over December sales. Sales are normally at their lowest level in December and typically increase until June. What has changed is the level of sales, we took an extremely busy December and increased sales by 15.66%
Sales Compared to 2020: This puts things into Perspective
Calgary home sales were for January were 2009 while January of 2021 Sales were only 1207. We are therefore 66.4% higher than January 2021.
| Jan | Feb | Mar | Apr | May | June | July | |
| 2021 | 1207 | ||||||
| 2022 | 2009 | ||||||
| Change | + 802 | ||||||
| % Change | + 66.4% |
| Aug | Sept | Oct | Nov | Dec | Year to Date | |
| 2020 | 1574 | 1702 | 1763 | 1438 | 1199 | 16,149 |
| 2021 | 2151 | 2162 | 2186 | 2110 | 1737 | 27,686 |
| Change | +577 | +456 | + 423 | +672 | +538 | 11,537 |
| % Change | 136.6% | 126.7% | 123.9% | 146.7% | 144.9% | 171.4% |
Calgary Real Estate Benchmark Sales Prices:
Yes, Prices are going up. The benchmark price for all Sectors except Apartment Condos increased.
The highest increase is the sector with the lowest months of inventory being the Detached home sector. The benchmark price of detached homes increased by $12,500 or 2.28% this month.
Semi-detached increased by $7500.
Attached Row increased by $5,500
Apartment Condos decreased by $400
*It is important to note that Apartment Condos only went into a seller’s market in the last week so I anticipate when I report at the end of February prices will have started to increase.
Calgary Real Estate Benchmark Year to Date Sales Price: See chart below.
Same as above for this month
Current Months of Inventory (Absorption Rate):
The Months of inventory decreased in all sectors this month. As you can see in my chart above our months of inventory keeps decreasing in all sectors putting us into a deep seller’s market position.
What might 2022 bring: (again just my opinion)
My prediction last month has come true, only it is happening much quicker than I imagined. The sales increases with inventory decreases have really pushed up prices of Detached homes, this increase is pushing people into buying Semi- Detached homes and on down the line so that even apartment condominiums are now in a seller’s market position.
It is also important to note that these numbers vary by community, and by price range. If you would like numbers for your community, or more specific numbers for your home please contact us.
Below is a summary of numbers in chart form. All numbers are taken from the Calgary Real Estate Boards monthly Stats package.

