What is really happening in the Calgary Real Estate Market?
Following is a graph that shows the months of inventory for each housing sector. Looking at a one-year trendline gives you an indication of where things are really heading.
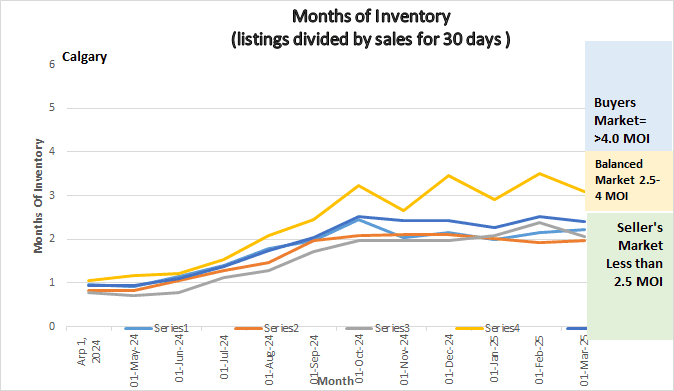
Graph showing Months of Inventory for Calgary Real Estate Market
Gord’s commentary for the month (just my opinion).
March 1, 2025 Highlights
Calgary’s sales increase over January outpaced the listing inventory by 4.71% moving the entire market to a slightly deeper Seller’s market. What I am noticing is that Buyer’s are acting more like we are in a Buyer’s market and not rushing into their purchase.
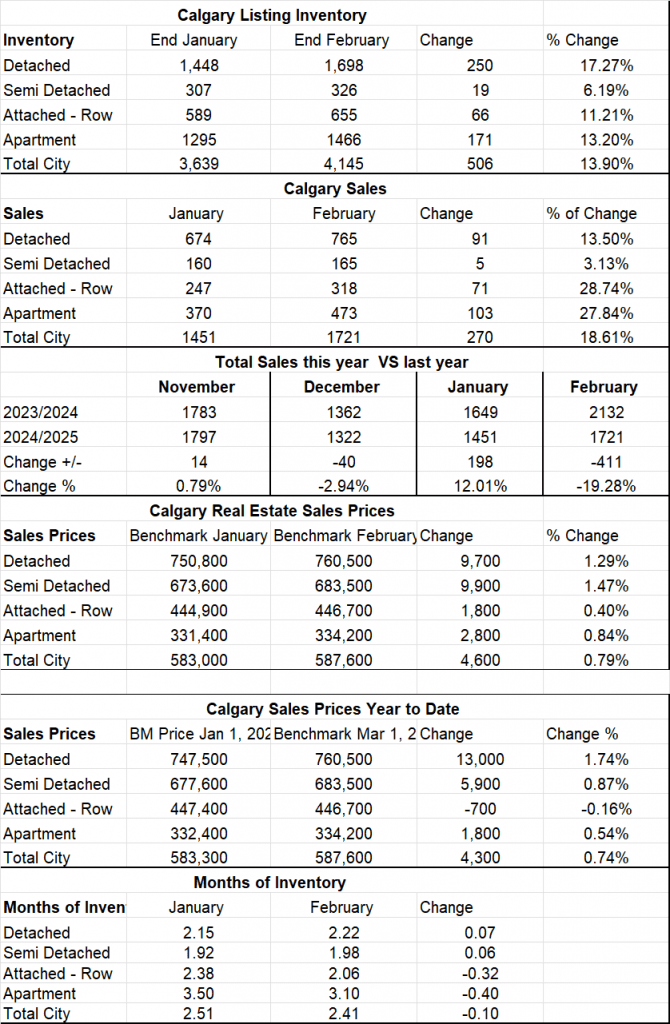
Calgary Listing Inventory
Throughout February our listing inventory increased in all housing sectors by a total of 13.9%. In my opinion this is simply a seasonal adjustment, and we will likely see similar increases until mid year.
Calgary Sales:
Throughout February our Sales increased by 18.61% over January. Again, sales increasing is typical of this time of year. Looking at sales it is important to note that Sales were higher in February than our historical February average although they are lower than the last few years. We should see this trend for the next six months.
Sales Compared to 2023:
Sales in January compared to February 2025 were down by 19.28% compared to February 2024 showing a slight slowdown.
| Sept | Oct | Nov | Dec | Jan | Feb | |
| 2023 | 2430 | 2169 | 1783 | 1362 | 1649 | 2132 |
| 2024 | 2003 | 2174 | 1797 | 1322 | 1451 | 1721 |
| Change | -427 | 5 | 14 | 40 | 198 | -411 |
| % Change | 17.6% | .2% | .8% | -3.0% | 12.1 | -19.28 |
Calgary Real Estate Benchmark Sales Prices:
The overall Benchmark price in February increased by $4,600 or .79%
The largest increases were in the Detached and Semi-detached sectors. Of interest the Attached Row sector only increased by $1,800 which is low compared to recent history. The Apartment sector increased by $2800 in February.
Current Months of Inventory (Absorption Rate):
With our Sales increasing at a slightly higher rate than our Inventory the Months of Inventory decreased by .1 in February. Increases were seen in the Detached and Semi-Detached Sectors while the Attached Row and apartment Condo sector both decreased.
My Prediction for what is ahead:
First, I will say that anything could happen with the change in the US government and how the Canadian government will react with new tariff situation – today this is anyone’s guess.
Putting that aside, here is what it looks like to me. We are already in a tight (Seller’s market) to start off the new year. This combined with lower interest (more to come) which increases demand. In my opinion this indicates that we should have another busy year in Real Estate unless the Trump factor kicks in then it’s anyone’s guess. Unfortunately, it sure looks like there is going to be a lot of uncertainty throughout Trumps entire term which will hold the entire market back somewhat.
I do believe there is a pent-up demand – at my open house this weekend I had over 40 people come through in just over 2 hours. Yes, there are a lot of people looking.
*Below is a summary of numbers in chart form. All numbers are taken from the Calgary Real Estate Boards monthly Stats package.
*All numbers vary by community and price ranges, if you would like stats specifically for your neighbourhood, please contact us.
Calgary Real Estate Board Realtors Stats