What is really happening in the Calgary Real Estate Market?
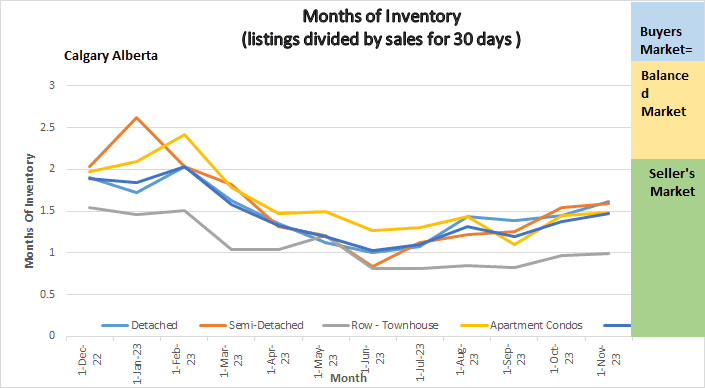
Following is a graph that shows the months of inventory for each housing sector. Looking at a one-year trendline gives you an indication of where things are really heading.
Gord’s commentary for the month (just my opinion).
October 2023 Highlights
The Calgary Market appears to be slowing a bit, but is it?
- New listing in October were down 15.9% from September.
- Sales declined by 11.06%
- Listing Inventory declined by 5.51%
- Prices increased moderately.
- Seller’s market continues….
Calgary Listing Inventory
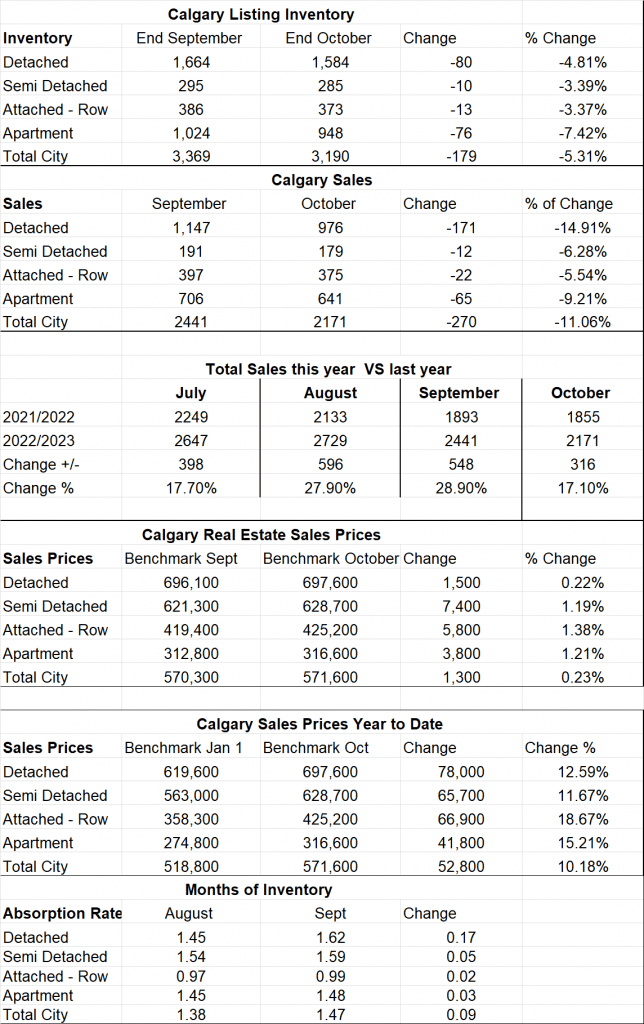
Our listing inventory remains very low with a total of 3190 listings on the market. This number decreased by 5.31% since September. It is quite normal that the number of new listings declines at this time of year.
Calgary Sales:
Sales in October were down by 179 or 5.31% from September. The sectors that saw the largest decreases were Apartment Condos at -76 and Detached Homes at -80. As I have said many times what is keeping our sales down is our Inventory if there were more listings we would certainly sell more.
Sales Compared to 2022:
It is also important to look at sales compared to the Previous year. Sales for October were up by 17.1% from last year. The demand is still very strong so the more we can list the more we sell.
| Jan | Feb | Mar | Apr | May | June | |
| 2022 | 2004 | 3305 | 4091 | 3401 | 3071 | 2837 |
| 2023 | 1199 | 1740 | 2432 | 2690 | 3120 | 3146 |
| Change | -805 | -1565 | -1659 | -711 | +57 | +309 |
| % Change | -40.1% | -47.4% | -40.55% | -20.9% | +1.9% | +10.9% |
| July | Aug | Sept | Oct | Nov | Dec | |
| 2022 | 2249 | 2133 | 1893 | 1855 | ||
| 2023 | 2647 | 2729 | 2441 | 2171 | ||
| Change | +398 | +596 | +548 | 316 | ||
| % Change | +17.7% | 27.9% | +28.9% | +17.1% |
Calgary Real Estate Benchmark Sales Prices:
The overall benchmark price saw a slight increase in all sectors this month. The highest increase was $7400 in the Semi-Detached sector followed by $5,800 in the Attached-Row sector.
Calgary Real Estate Benchmark Year to Date Sales Price: See chart below.
For all of Calgary we have so far seen an increase in all sectors of 10.18% or $52,800.
The lowest dollar increases so far has been apartment condos at $41,800 and the highest is Detached homes at $78,000. It is important to note that this is a Calgary number and each community within Calgary will be different – some higher and some lower.
Current Months of Inventory (Absorption Rate):
Sales numbers decreased more than our listing inventory decreased moving our months of inventory slightly higher for the second month in a row. All sectors remain in a seller’s market position.
My Prediction for what is ahead: Based on what I am seeing, I believe we are going to see more of the same – so a little less intense competition for the next 2 months. I predict that once January hits we will increase the number of sales and move into a deeper seller’s market. This prediction is largely based on what is driving demand (immigration) and I do not see that changing any time soon, I predict sales are going to remain strong and prices are going to continue to trend upwards.

