What is really happening in the Calgary Real Estate Market?
Following is a graph that shows the months of inventory for each housing sector. Looking at a one-year trendline gives you an indication of where things are really heading.
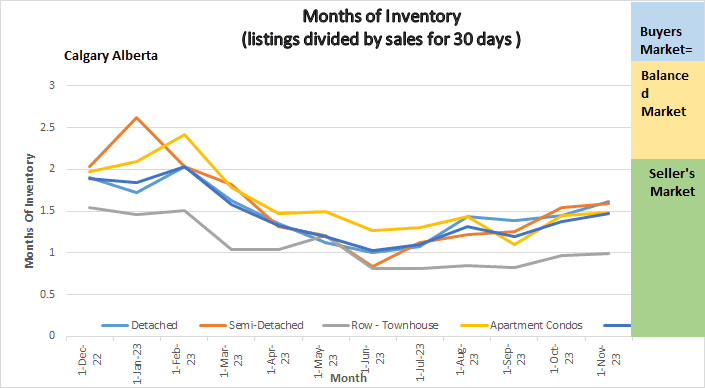
Months of Inventory
Gord’s commentary for the month (just my opinion).
October 2023 Highlights
The Calgary Market appears to be slowing a bit, but is it?
- New listing in October were down 15.9% from September.
- Sales declined by 11.06%
- Listing Inventory declined by 5.51%
- Prices increased moderately.
- Seller’s market continues….
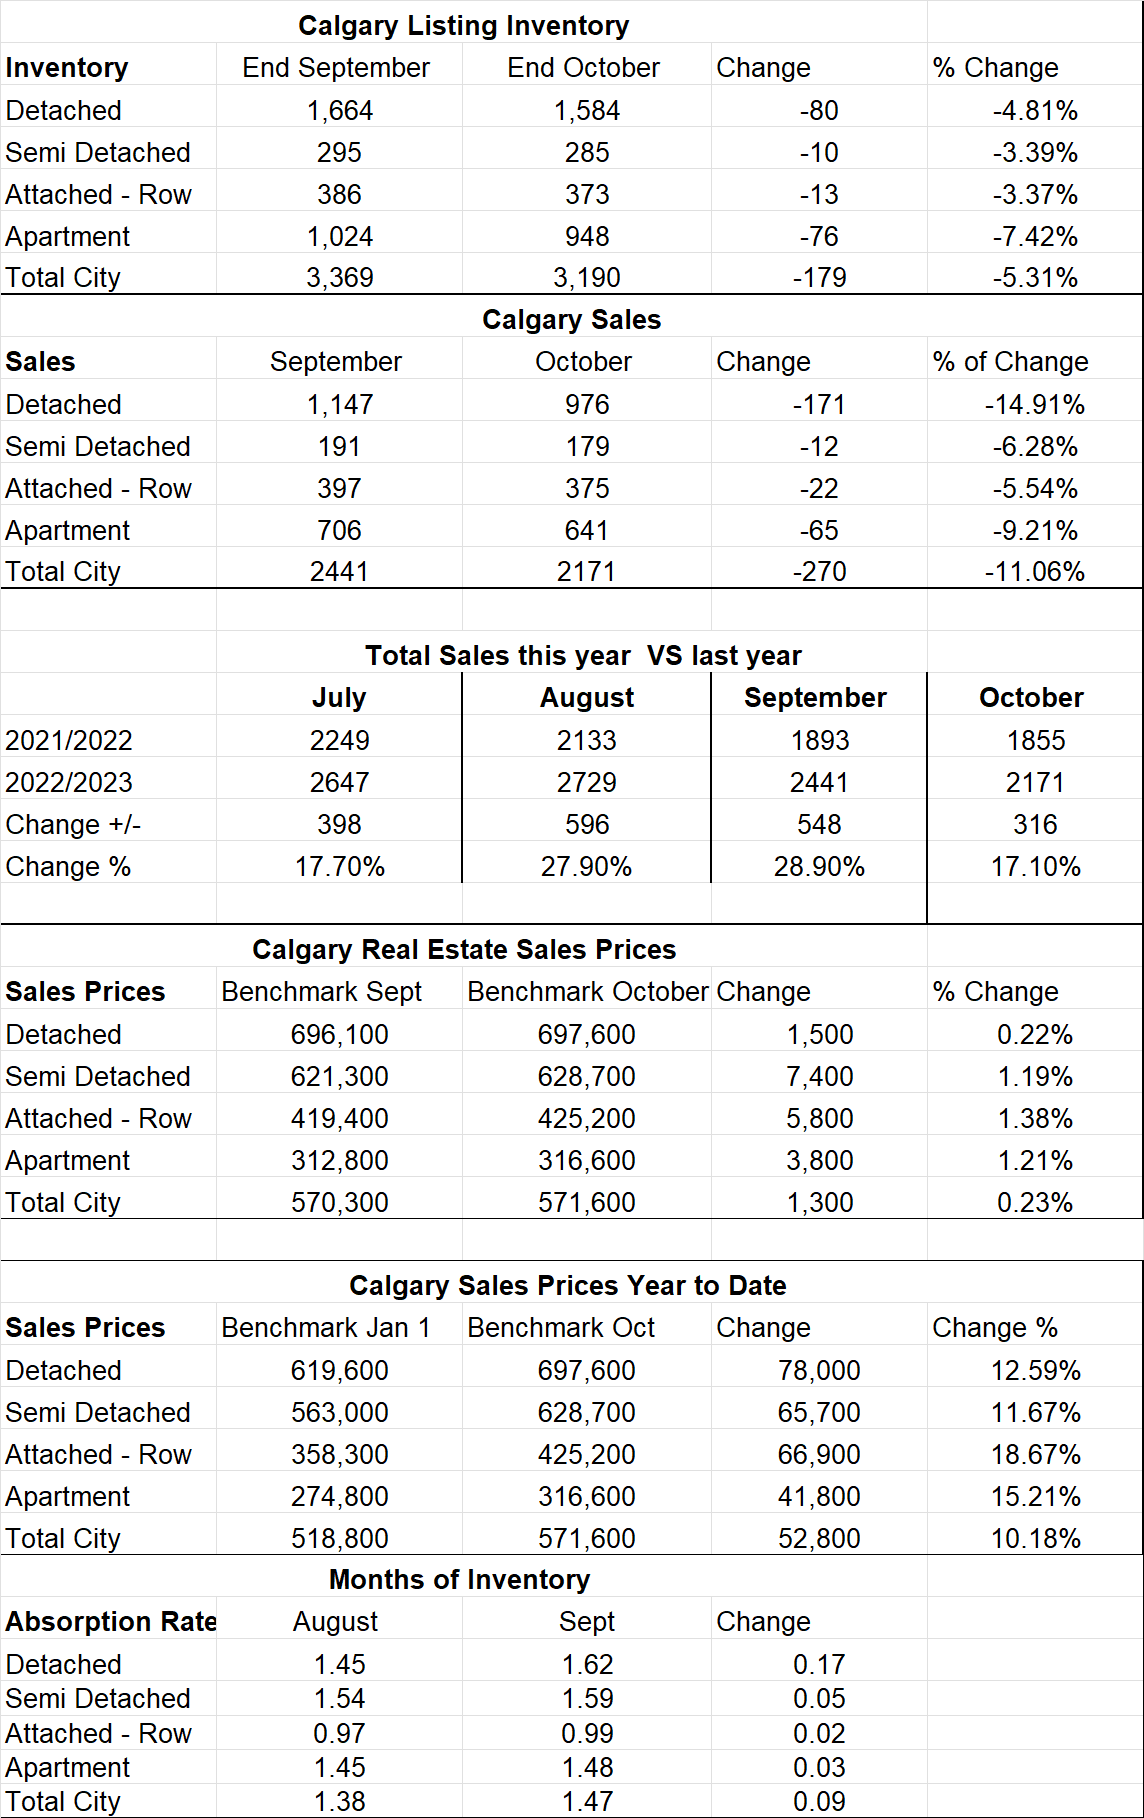
Calgary Listing Inventory
Our listing inventory remains very low with a total of 3190 listings on the market. This number decreased by 5.31% since September. It is quite normal that the number of new listings declines at this time of year.
Calgary Sales:
Sales in October were down by 179 or 5.31% from September. The sectors that saw the largest decreases were Apartment Condos at -76 and Detached Homes at -80. As I have said many times what is keeping our sales down is our Inventory if there were more listings we would certainly sell more.
Sales Compared to 2022:
It is also important to look at sales compared to the Previous year. Sales for October were up by 17.1% from last year. The demand is still very strong so the more we can list the more we sell.
| Jan | Feb | Mar | Apr | May | June | |
| 2022 | 2004 | 3305 | 4091 | 3401 | 3071 | 2837 |
| 2023 | 1199 | 1740 | 2432 | 2690 | 3120 | 3146 |
| Change | -805 | -1565 | -1659 | -711 | +57 | +309 |
| % Change | -40.1% | -47.4% | -40.55% | -20.9% | +1.9% | +10.9% |
| July | Aug | Sept | Oct | Nov | Dec | |
| 2022 | 2249 | 2133 | 1893 | 1855 | ||
| 2023 | 2647 | 2729 | 2441 | 2171 | ||
| Change | +398 | +596 | +548 | 316 | ||
| % Change | +17.7% | 27.9% | +28.9% | +17.1% |
Calgary Real Estate Benchmark Sales Prices:
The overall benchmark price saw a slight increase in all sectors this month. The highest increase was $7400 in the Semi-Detached sector followed by $5,800 in the Attached-Row sector.
Calgary Real Estate Benchmark Year to Date Sales Price: See chart below.
For all of Calgary we have so far seen an increase in all sectors of 10.18% or $52,800.
The lowest dollar increases so far has been apartment condos at $41,800 and the highest is Detached homes at $78,000. It is important to note that this is a Calgary number and each community within Calgary will be different – some higher and some lower.
Current Months of Inventory (Absorption Rate):
Sales numbers decreased more than our listing inventory decreased moving our months of inventory slightly higher for the second month in a row. All sectors remain in a seller’s market position.
My Prediction for what is ahead: Based on what I am seeing, I believe we are going to see more of the same – so a little less intense competition for the next 2 months. I predict that once January hits we will increase the number of sales and move into a deeper seller’s market. This prediction is largely based on what is driving demand (immigration) and I do not see that changing any time soon, I predict sales are going to remain strong and prices are going to continue to trend upwards.
Calgary Real Estate Board Stats