What is really happening in the Calgary Real Estate Market?
Following is a graph that shows the months of inventory for each housing sector. Looking at a one-year trendline gives you an indication of where things are really heading.
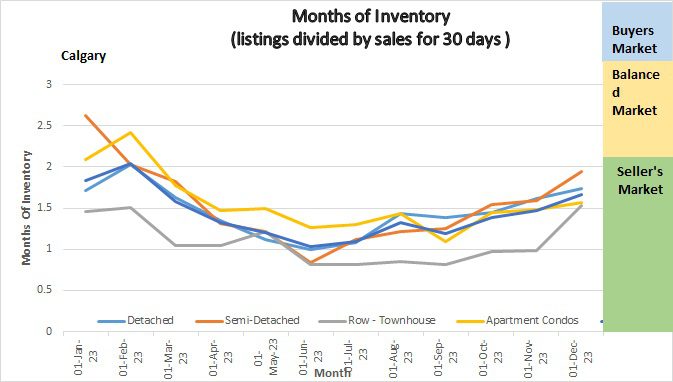
Graph of Months of Inventory
Gord’s commentary for the month (just my opinion).
October 2023 Highlights
The Calgary Market appears to be slowing a little.
- New listing in November were down 17% yet were up 38% from last year.
- Sales declined by 18.2%%
- Prices increased moderately.
- Seller’s market continues….
Calgary Listing Inventory
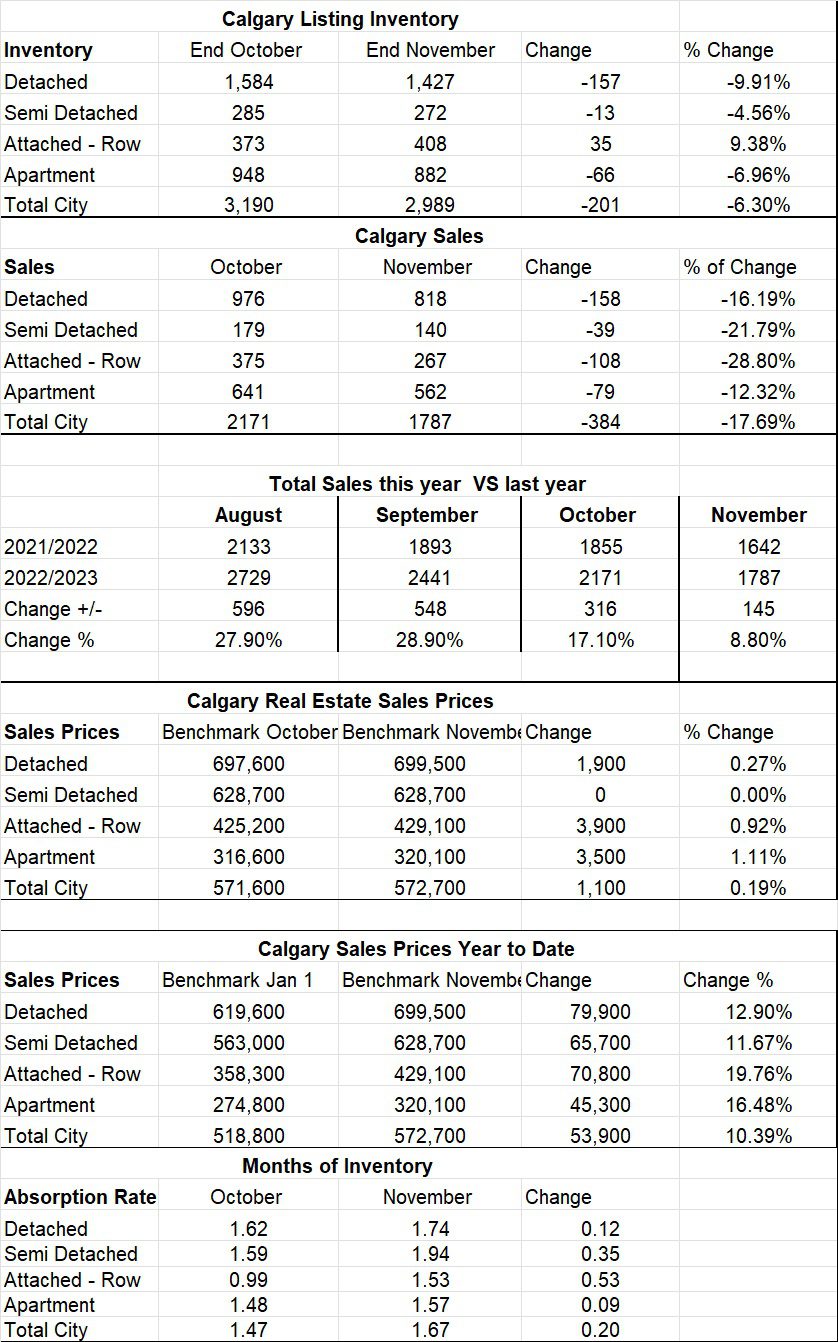
Our inventory of listings declined in November by only 206 listings. This is very normal as the normal trend is to see less new listings at this time of year. When I look at last year the decline from Oct to Nov was 773 so the listing inventory change is much smaller this year.
Calgary Sales:
Sales in November were also down 382 Sales from October. Seeing this decrease is very normal as moving towards the holiday season we typically see a slowdown.
Sales Compared to 2022:
It is also important to look at sales compared to the Previous year. Sales for November were up by 8.8% from last year. The demand is still very strong so the more we can list the more we sell.
| Jan | Feb | Mar | Apr | May | June | |
| 2022 | 2004 | 3305 | 4091 | 3401 | 3071 | 2837 |
| 2023 | 1199 | 1740 | 2432 | 2690 | 3120 | 3146 |
| Change | -805 | -1565 | -1659 | -711 | +57 | +309 |
| % Change | -40.1% | -47.4% | -40.55% | -20.9% | +1.9% | +10.9% |
| July | Aug | Sept | Oct | Nov | Dec | |
| 2022 | 2249 | 2133 | 1893 | 1855 | 1642 | |
| 2023 | 2647 | 2729 | 2441 | 2171 | 1787 | |
| Change | +398 | +596 | +548 | 316 | +145 | |
| % Change | +17.7% | 27.9% | +28.9% | +17.1% | 8.8% |
Calgary Real Estate Benchmark Sales Prices:
The overall benchmark price saw a slight increase in all sectors this month. The overall benchmark price increased by $1,100 in November. The highest increase was $3900 in the Attached-Row sector followed by an increase of $3500 in the Apartment Condo sector. Detached homes gained $1,900 while Semi-Detached homes remained flat.
Calgary Real Estate Benchmark Year to Date Sales Price: See chart below.
For all of Calgary year to date we have so far seen an increase in all sectors of 10.29% or $53,900.
Here are the dollar increases for each sector:
Detached: $79,900
Semi Detached: $65,700
Attached Row: $70,800
Apartment: $45,300
It is important to note that these are Calgary overall numbers and each community within Calgary will be different – some higher and some lower.
Current Months of Inventory (Absorption Rate):
With the number of sales dropping less than the number of listings our Months of Inventory have been pushed up. The largest change is in the Attached Row Sector which increased by .53.
While all sectors are increasing their months of inventory keep in mind that we are still very much in a seller’s market.
My Prediction for what is ahead: Based on what I am seeing and taking history into account, I believe we will see the same slowing trend in December. I believe this is going to be short lived and in January we will start to see the trend reverse pushing us into a deeper seller’s market. This prediction is largely based on what is driving demand (immigration) and I do not see that changing any time soon, I predict sales are going to remain strong and prices are going to continue to trend upwards throughout 2024.
**Below is a summary of numbers in chart form. All numbers are taken from the Calgary Real Estate Boards monthly Stats package.
*All numbers vary by community and price ranges, if you would like stats specifically for your neighbourhood, please contact us.
See Stats from the Calgary Real Estate Market Below
Calgary Real Estate Board Stats