What is really happening in the Calgary Real Estate Market?
Following is a graph that shows the months of inventory for each housing sector. Looking at a one-year trendline gives you an indication of where things are really heading. As you can see our months of inventory is heading upwards.
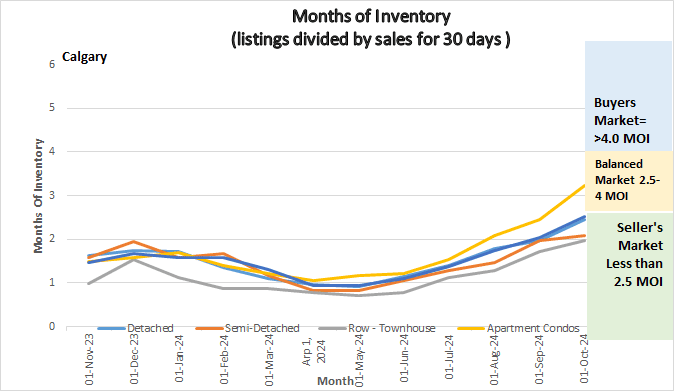
Graph showing Months of Inventory for Calgary Real Estate Market
Gord’s commentary for the month (just my opinion).
Sept 2024 Highlights
Change is here:
- When we have such a long period of price increases it is only natural for them to come down and bounce around until they settle where they need to land.
- Our Months of Inventory continues to rise (see graph above. We are now in a Buyer’s market position for Apartment Condos, and a balanced position for Detached Homes.
- Inventory continues to rise a little each week.
- Overall Benchmark Prices Decreased a little (a total for all sectors of $4,900 in the month of September.
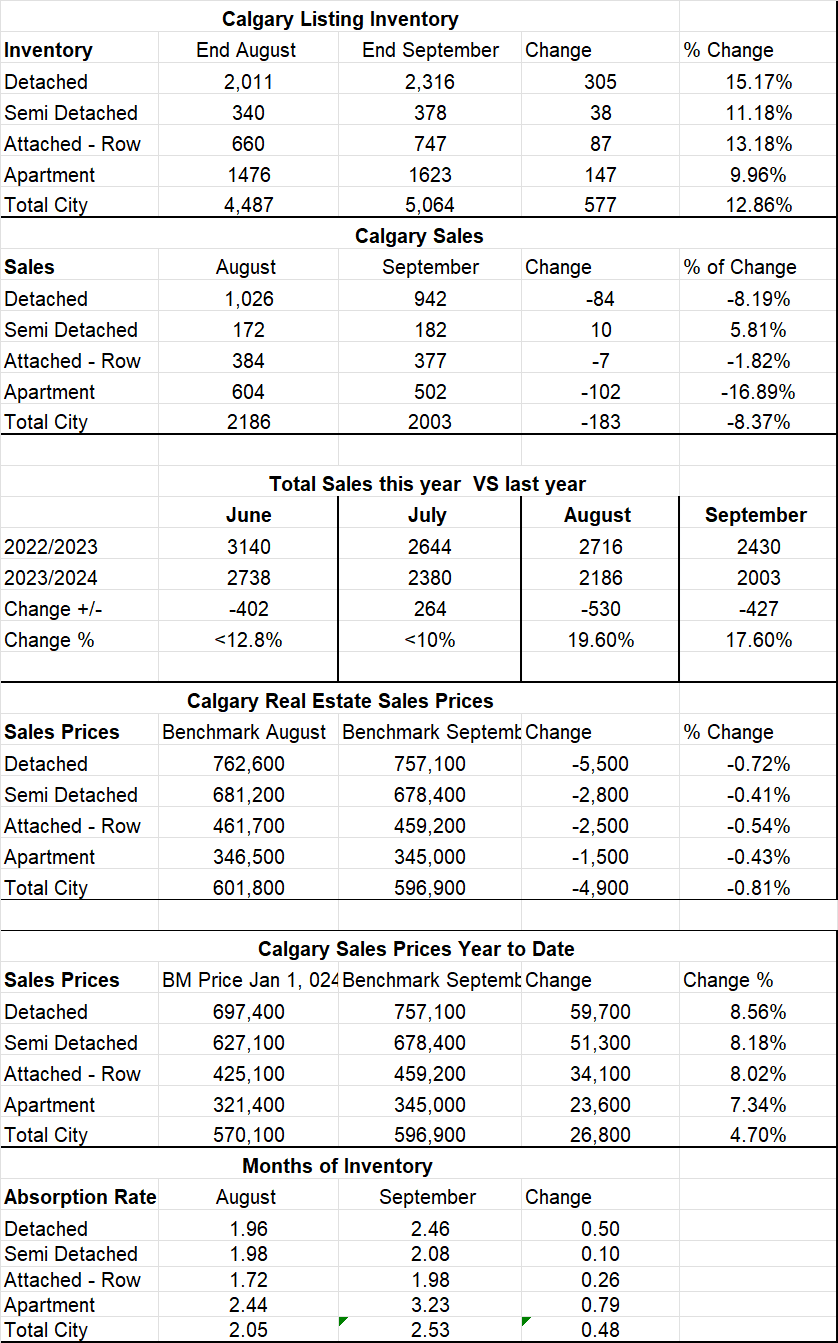
Calgary Listing Inventory
The Calgary listing Inventory increased again in September in all sectors. Detached homes saw the largest increase of 15.77%. The lowest increase was in the Apartment Condo Sector – 9.96%
Calgary Sales:
Sales in September slowed again. Sales were down by 183 for all sectors from August Sales. Sales were also down 17.6% from last September. It is important to note although sales are down, they are still higher than our long-term average.
Sales Compared to 2023:
Sales in September compared to 2023 were down by 427 or (17.6%) This tells me the slowdown is not just seasonal, but that market is slowing.
| Jan | Feb | Mar | Apr | May | June | |
| 2023 | 1198 | 1738 | 2135 | 2686 | 3117 | 3140 |
| 2024 | 1650 | 2135 | 2664 | 2881 | 3092 | 2738 |
| Change | +452 | +397 | +529 | +195 | -25 | -402 |
| % Change | 37.7% | 22.8% | 24.8% | 7.3% | – .8% | -12.8% |
| July | Aug | Sept | Oct | Nov | Dec | |
| 2022 | 2644 | 2716 | 2430 | |||
| 2023 | 2380 | 2186 | 2003 | |||
| Change | -264 | -530 | -427 | |||
| % Change | <10% | 19.6% | 17.6% |
Calgary Real Estate Benchmark Sales Prices:
The overall Benchmark price declined by a total of $4,900. Or .81%. The largest declines were in the Detached sector, the Semi-Detached sector and the Attached Row sector. The lowest decline was in the Apartment Condo sector, and it was only $1500.
Calgary Real Estate Benchmark Year to Date Sales Price: See chart below.
Year to date the entire market has increased by $26,800 or 4.7% which is substantial.
Current Months of Inventory (Absorption Rate): Our Months of Inventory increased in all sectors. The increases were between .10 to .79 with the lowest increase in the Semi-Detached Sector and the largest increase of .79 was in the Apartment Condo Sector.
My Prediction for what is ahead:
In the next few months, I predict more of the same, Inventory rising, Sales dropping and prices to drop a little.
In the longer term, we are now also seeing decreases in the Interest Rates and there is still huge migration which leads me to speculate that either late this year or early next year we may see another decrease in inventory and rising prices again.
*Below is a summary of numbers in chart form. All numbers are taken from the Calgary Real Estate Boards monthly Stats package.
*All numbers vary by community and price ranges, if you would like stats specifically for your neighbourhood, please contact us.
Calgary Real Estate Board Stats Summary