What is really happening in the Calgary Real Estate Market you ask?
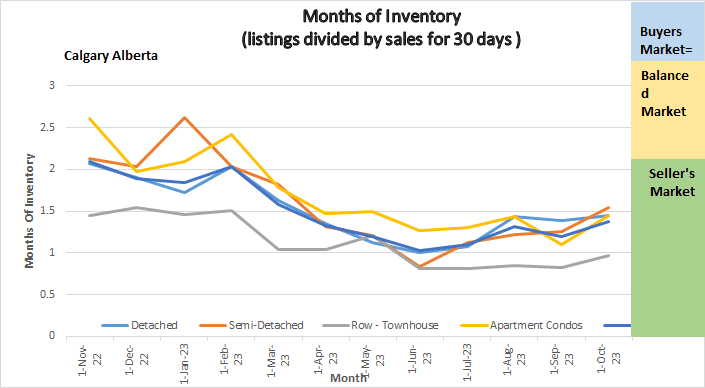
The following graph shows the months of inventory for each housing sector. Looking at a one-year trendline gives you an indication of where things are really heading.
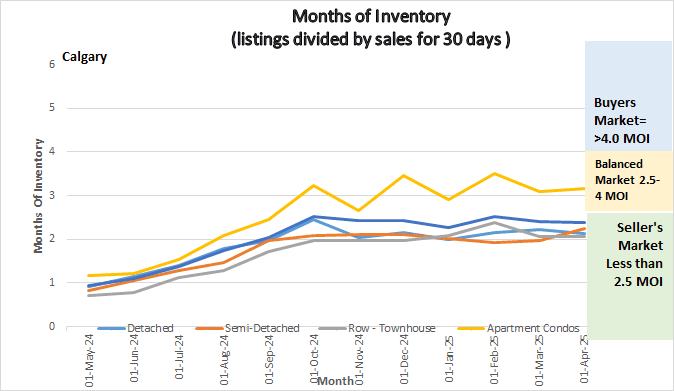
Graph showing Months of Inventory for Calgary Real Estate Market
Gord’s commentary for the month (just my opinion).
April 1, 2025, Highlights
Although our listing inventory increased, our sales increased by almost the same percentage leaving our Months of Inventory at a similar level to last month. Prices increased in every sector.
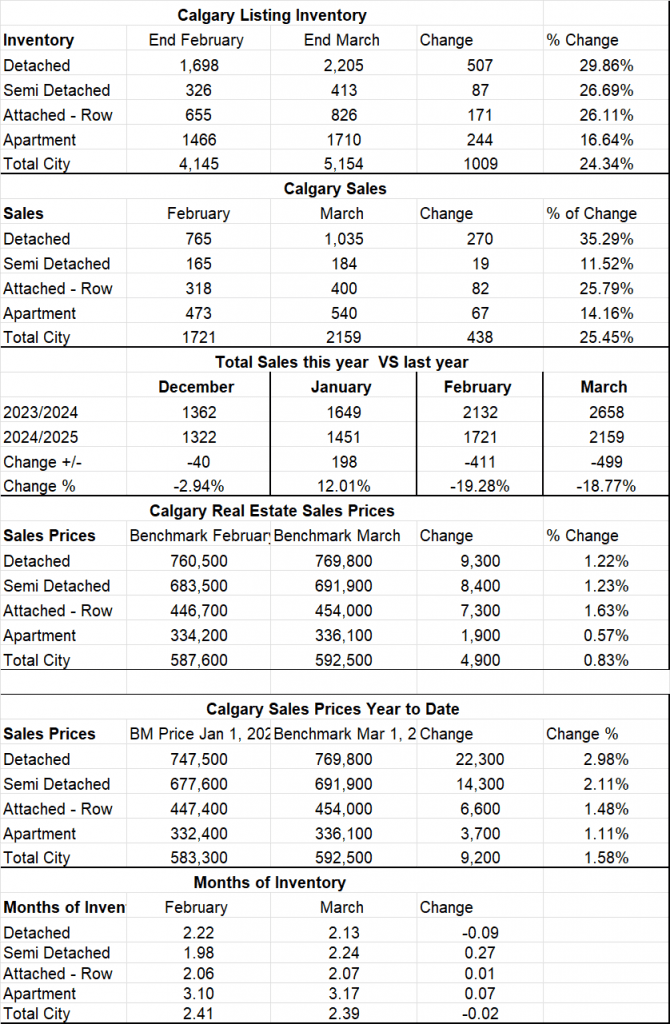
Calgary Listing Inventory
Throughout March our listing inventory increased in all housing sectors by a total of 1009 listings or 24.34%. In my opinion this is mostly a seasonal adjustment, and we will likely see similar increases until mid year.
Calgary Sales:
Throughout March our Sales increased by 438 or 25.45 % over February. Again, sales increasing is typical of this time of year. We should see this trend for the next six months.
Sales Compared to 2024:
Sales in March 2025 compared to March 2024 were down by 18.88%.
Yes, this is a big slowdown, however we must remember that Feb through June of last year!
were all record-breaking months.
| Oct | Nov | Dec | Jan | Feb | March | |
| 2024 | 2169 | 1783 | 1362 | 1649 | 2132 | 2658 |
| 2025 | 2174 | 1797 | 1322 | 1451 | 1721 | 2159 |
| Change | 5 | 14 | 40 | 198 | -411 | -499 |
| % Change | .2% | .8% | -3.0% | 12.1 | -19.28 | -18.88 |
Calgary Real Estate Benchmark Sales Prices:
The overall Benchmark price in March increased by $4,900 or .83%.
The largest percentage increases were in the Attached Row House sector at 1.63%.
Following were the Detached and Semi-Detached sectors with an increase of 1.22& and 1.23%. Apartment Condos increased but only by .57%.
Current Months of Inventory (Absorption Rate):
With our Sales increasing at a marginally lower rate than our Inventory, the Months of Inventory increased by .02 in March. Breaking this down the Detached home sector decreased by .09% while all other categories increased.
My Prediction for what is ahead:
I’m sure it’s not news to say that the Trump tariffs are causing uncertainty in the world. This uncertainty causes people to put plans on hold to see what happens. What is interesting is that even with all the uncertainty our sales are maintaining a good pace. Based on what I am seeing on the street, there are a lot of people in a hold pattern and once we get over the Trump tariffs then our market is going to explode again due to the pent-up demand. Unfortunately I can’t tell you if this will be over in a month or 4 years! Sorry my crystal ball is broken.
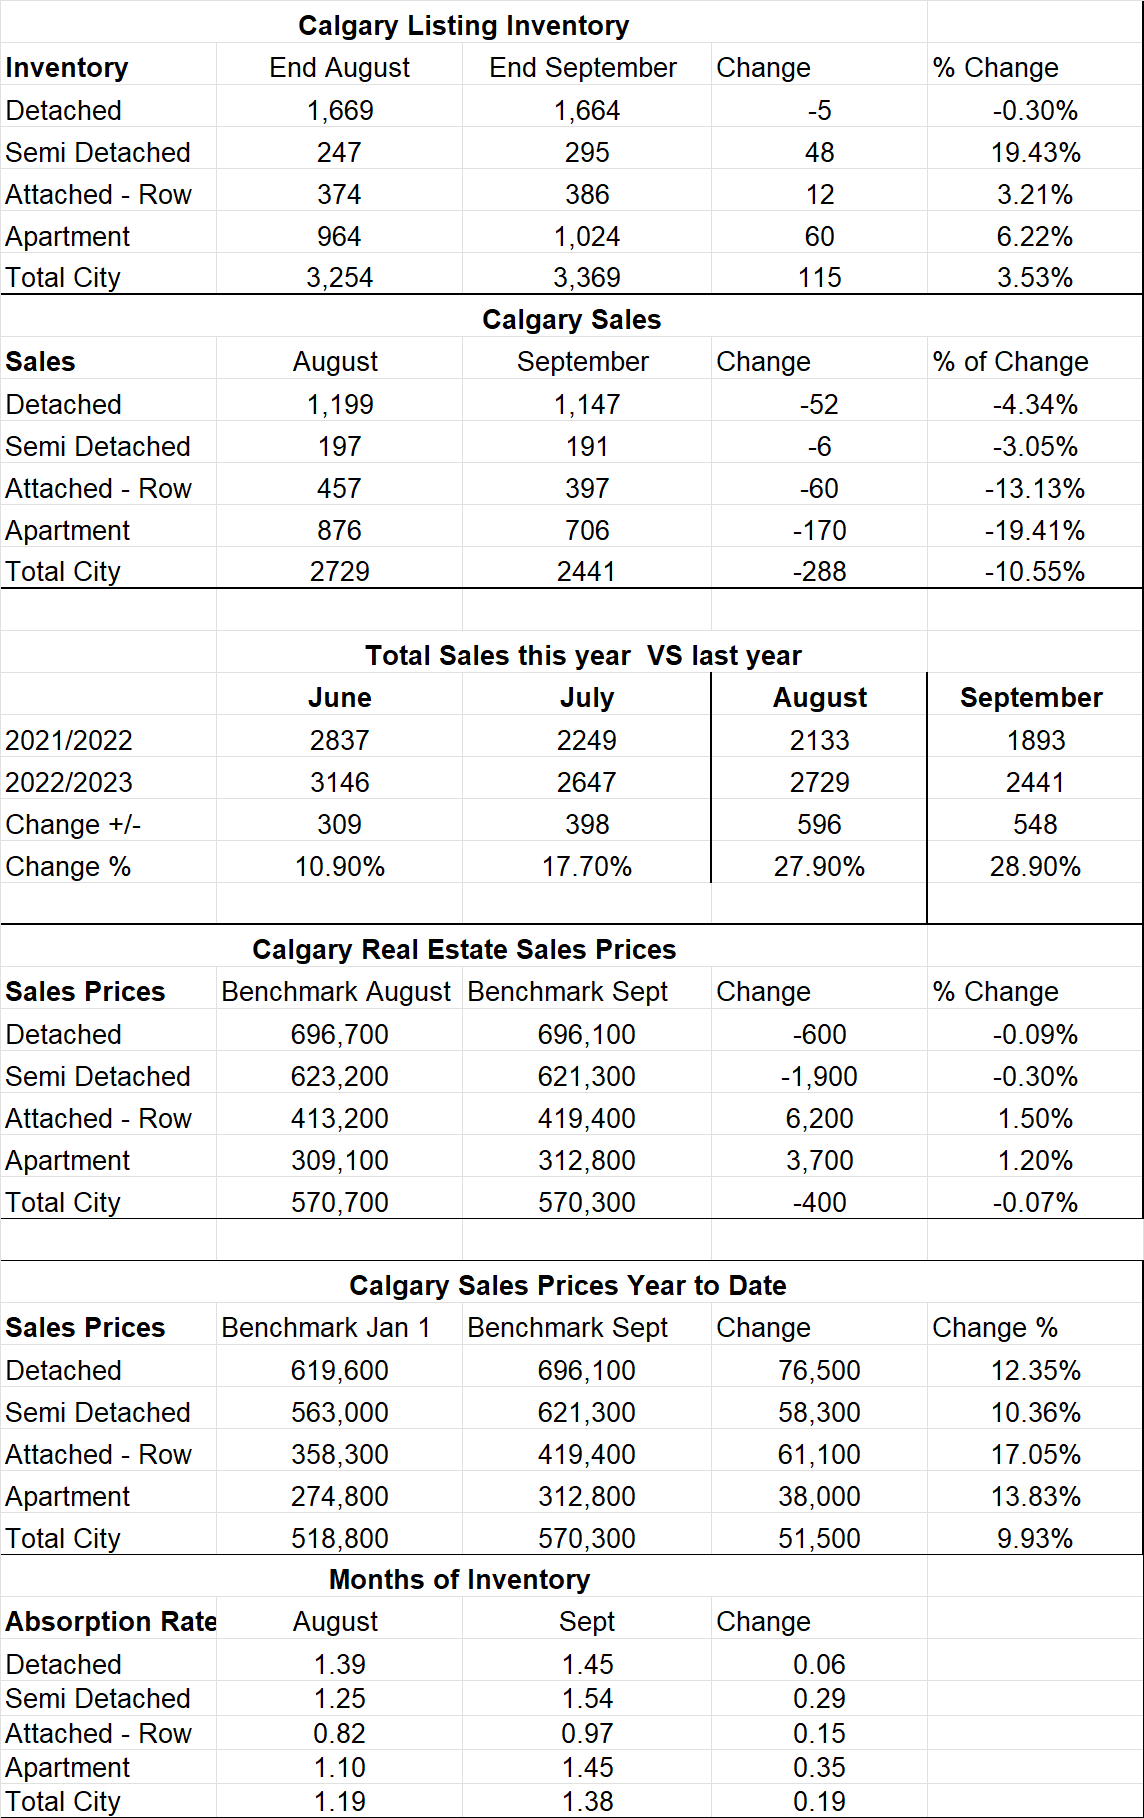
*Below is a summary of numbers in chart form. All numbers are taken from the Calgary Real Estate Boards monthly Stats package.
Calgary Real Estate Board Realtors Stats