Posts Tagged ‘CREB Statistics Simplified’

November 1, 2021 Calgary Real Estate Market Snapshot.

Monday, November 1st, 2021


What is really happening in the Calgary Real Estate Market?

The market is a result of Supply and Demand therefore we look at both Supply (inventory) and Demand (Sales) and the relationship between the two. We also update you on the current benchmark price for all housing sectors.

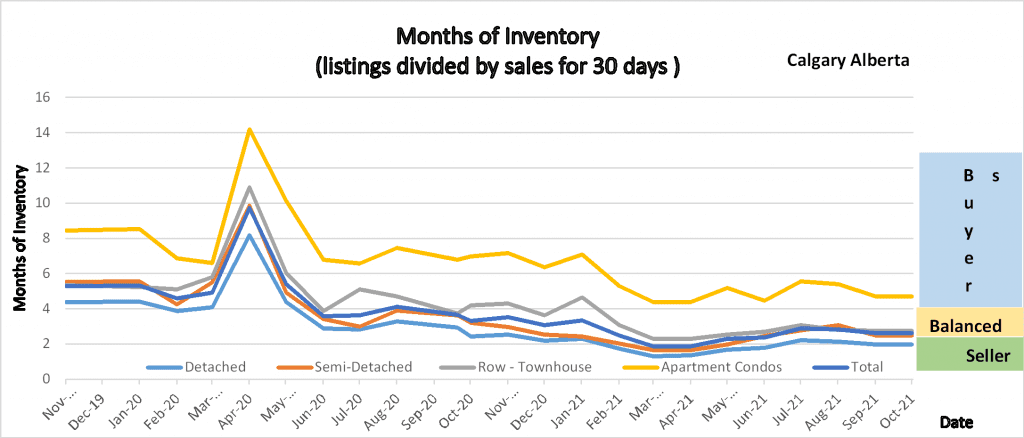
Following is a graph that shows the months of inventory for each housing sector. Looking at a 2-year trendline gives you an indication of where things are really heading.

Stats from the Calgary Real Estate Board

Months of Inventory

Gord’s commentary for the month (just my opinion).

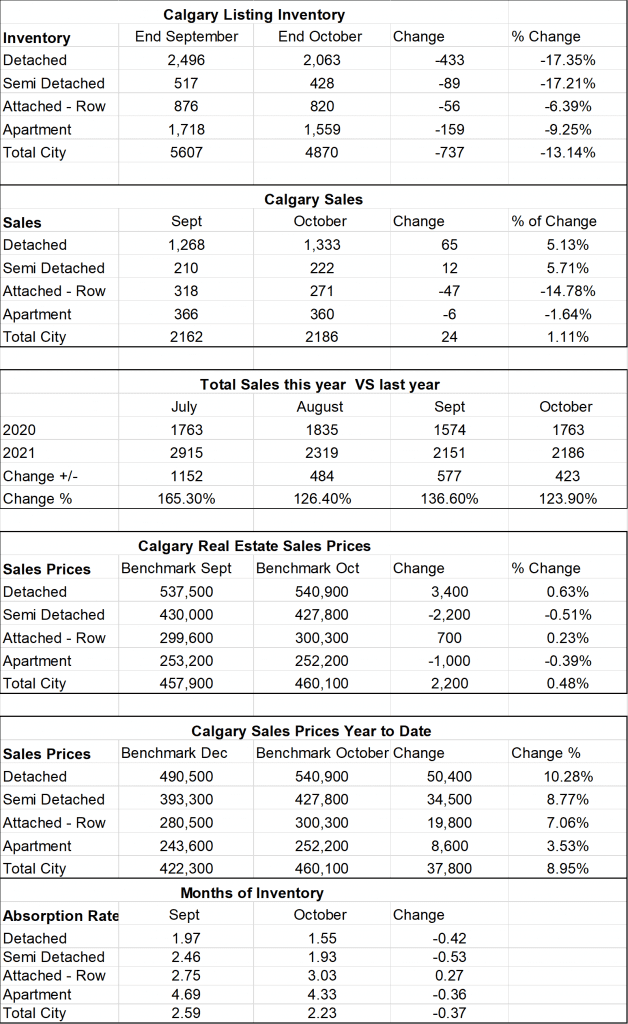
October continued with very strong sales and a declining inventory level pushing the market into a stronger seller’s market position.


Calgary Listing Inventory

Listing inventory in all sectors declined again this month. This is a normal trend where we see the number of new listings decline between now and the new year.


Calgary Sales:

Another strong month in Calgary Real Estate.  Sales in October increased (by 24) over sales from September. Typically, we see sales decline at this time of year, so an increase is a little unusual. Sales in attached Row and Apartment did show decreases while Detached and Semi-Detached homes increased from September.


 Sales Compared to 2020:

As you can see below October 2021 Sales were higher than October 2020. As noted above this is due to pent-up demand and a lack of supply making people search longer to find their home. The other factor here is people taking advantage of the low-interest rates.


  Jan Feb Mar Apr May June
2020 861 1190 1175 573 1080 1763
2021 1208 1836 2903 3209 2989 2915
Change +347 +646 +1729 +2639 1,911 1,152
% Change +7.49 +54.4 247% +562% 277.3% 165.3%


  July Aug Sept Oct Nov Dec
2020 1835 1574 1702 1763 1437 1199
2021 2319 2151 2162 2186    
Change +484 +577 +456 + 423    
% Change 126.4% 136.6% 126.7% 123.9%    


Calgary Real Estate Benchmark Sales Prices:

Overall, the benchmark price changed very little this month. The total change for all sectors was an increase of $2200. Semi-Detached Homes and Apartment Condos saw a small decline while Detached homes and Attached Row homes saw a small increase.


Calgary Real Estate Benchmark Year to Date Sales Price:  See chart below.


Current Months of Inventory (Absorption Rate): 

The Months of inventory decreased in all sectors except Attached Rowhomes. This is due to the declining inventory and increased sales. This puts Detached homes, Semi-Detached Homes, and the overall market into a seller’s market position. Attached Row homes stayed in a balanced position while Apartment Condos stayed in a Buyers Market Position.

It is also important to note that these numbers vary by community, and by price range. If you would like numbers for your community, or more specific numbers for your home please contact us.

Below is a summary of numbers in chart form. All numbers are taken from the Calgary Real Estate Boards monthly Stats package.
Stats from the Calgary Real Estate Board

Key Numbers to Understanding the Calgary Real Estate Market

Calgary Real Estate Market Snapshot – Nov. 1, 2017

Thursday, November 2nd, 2017

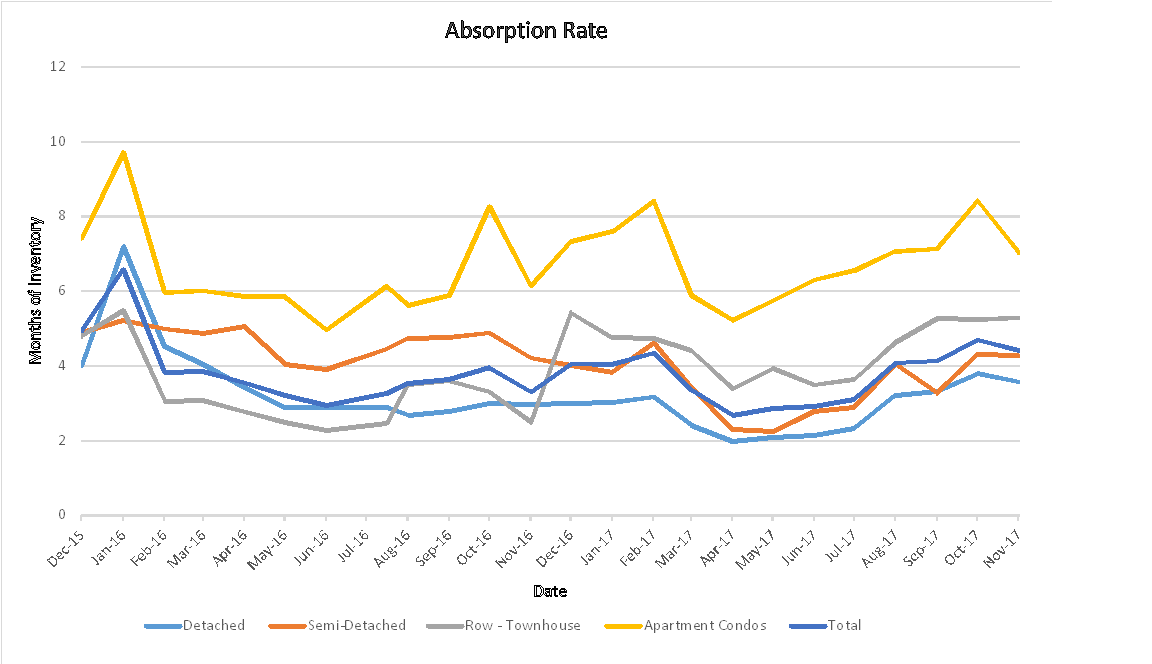
Aborsption Rate Trend – Supply Vs Demand 

What is really happening in the Calgary Real Estate Market?

Stay ahead of everyone else by following our Monthly Market Snapshot of the Calgary Real Estate Market This shows what’s really happening! The market is driven by supply and demand so here we show the inventory (supply) and sales (demand) and most importantly the relationship between the two and how it affects the price of Calgary Real Estate.  A simple way to keep up to date with how the market is trending and to stay ahead of most! All numbers are taken from the Calgary Real Estate Boards Stats package for Realtors. I have also included some general comments which are simply my opinion.

Absorption Rate’s Explained  (Months of Inventory)   (the inventory divided by the number of sales in the last month). What does this mean you might ask?

Buyer’s Market >4.0 Drives prices down
Balanced Market Between 2.4 to 4.0 Prices typically remain stable
Seller’s Market <2.4 Drives prices up


Current Absorption Rate

The Absorption rate for October stayed almost flat with the exception of Apartment Condos which decreased by 1.38 which is the first sizable decrease we have seen in this sector in a while.  It’s important to note that last month went up by 1.29 so part of this can be just timing of listing coming on and off the market.

  Sept  2017  Oct  2017  Change
Detached 3.79 3.57 -0.21
Semi Detached 4.31 4.27 -0.04
Attached – Row 5.25 5.28 0.03
Apartment 8.42 7.03 -1.38
Total City 4.69 4.41 -0.29


Calgary Listing Inventory

In October all categories stayed flat except for detached homes which saw an decrease of 233 listings and apartment condos which decreased by 129 listings.

Inventory Sept  2017  Oct  2017  Change
Detached 3479 3246 -233
Semi Detached 621 611 -10
Attached – Row 993 967 -26
Apartment 1768 1639 -129
Total City 6861 6463 -398


Calgary Sales:

Sales for October were almost identical to September. Last year sales from Sept to Oct increased by 168 so were a little behind last year.

Calgary Sales  Sept  2017  Oct  2017  Change % Change
Detached 919 908 -11 -1.20%
Semi Detached 144 143 -1 -0.69%
Attached – Row 189 183 -6 -3.17%
Apartment 210 233 23 10.95%
Total City 1462 1467 5 0.34%


 Calgary Real Estate Sales Prices:

I find these numbers interesting as again if in a balanced market prices should remain fairly stable.  In reality every sector showed a slight decrease.  One variable that these numbers do not show is consumer confidence and I think this may have something to do with prices holding.

  Sales Prices Sept  2017    Benchmark Price   Oct  2017  Benchmark Price Change
Detached 508,900 506,200 -2,700
Semi Detached 419,400 419,000 -400
Attached – Row 306,900 305,000 -1,900
Apartment 263,700 261,600 -2,100
Total City 441,500 438,900 -2,600


 Sales Prices “Year to Date”  

Our Year to date numbers are very in alignment with the absorption rate changes.

Sales Prices Jan 1, 2017    Benchmark Price  Oct  2017  Benchmark Price Change

$

% Change
Detached 498,700 506,200 7,500 1.50%
Semi Detached 406,800 419,000 12,200 3.00%
Attached – Row 302,600 305,000 2,400 0.79%
Apartment 265,000 261,600 -3,400 -1.28%
Total City 433,400 438,900 5,500 1.27%


Looking Forward – Again just Gord’s opinion.

Based on the absorption rate we should see stability in the Detached & Semi Detached sectors while we may seem more losses in the Row House & Apartment sectors

However

You may have heard by now that the Fed’s are changing mortgage qualifying rules as of Jan 1, 2018.  This can cause a wide range of changes.

  • In the short term it can push people to buy before the end of the year.
  • When they changed the qualifying process for insured mortgages we saw little change in sales numbers.
  • I heard from one mortgage broker that most banks are already doing this for many types of mortgages so again the impact may be smaller than what some expect
  • If there is an impact and people are able to qualify for less, then this may push some people from detached homes to attached homes and from row housing to the apartment condo sector which in Calgary could bring more balance to our market.
  • Really only time will tell the whole story


**Please note that these numbers include only Calgary homes and do change on a community basis and more so for towns.  This report does not include rural properties.  If you would like to find stats on your community just let us know.  If you have any questions about this summary or Real Estate questions please feel free to contact us.


July 1, 2017 Market Snapshot

Wednesday, July 5th, 2017

What is really happening in the Calgary Real Estate Market?

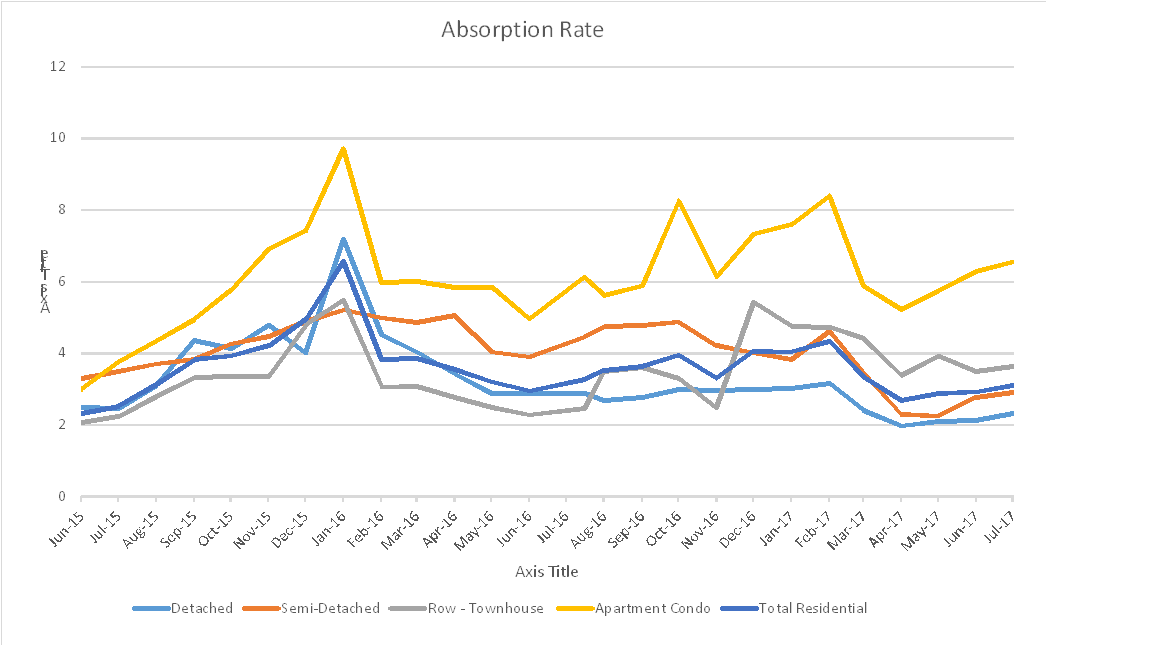
Absorption Rate for 2017


Stay ahead of everyone else by following our Monthly Market Snapshot of the Calgary Real Estate Market This shows what’s really happening! The market is driven by supply and demand so here we show the inventory (supply) and sales (demand) and most importantly the relationship between the two and how it affects the price of Calgary Real Estate.  A simple way to keep up to date with how the market is trending and to stay ahead of most! All numbers are taken from the Calgary Real Estate Boards Stats package for Realtors. I have also included some general comments which are simply my opinion.

Absorption Rate (Months of Inventory)   (the inventory divided by the number of sales in the last month). What does this mean you might ask?

Buyer’s Market >4.0 Drives prices down
Balanced Market Between 2.4 to 4.0 Prices typically remain stable
Seller’s Market <2.4 Drives prices up

___________________________________________________________________________________________________________________________________

Important Disclaimer:   For those who regularly follow my Market Snapshot you may notice the numbers from last month do not jive with the numbers from this month.  It appears to me that the Real Estate Board made some changes to what fits into each category and then made the stats changes retroactive.  This shows up as a large increase in Semi-Detached homes ($39,000) a large decrease in Row homes (14,300) and a decrease in Apartment condos of $5,400.  In my report I am using their new, year to date numbers so you can still see the change from May to June. _____________________________________________________________________________________________________________________________________

*** Absorption Rate

The Absorption rate for June saw all categories increase very slightly.  The highest increase is in the apartment condo market where it increased by .26 which happens to be where we need it the least.

  May  2017 June 2017   Change
Detached 2.13 2.33 0.19
Semi Detached 2.78 2.90 0.12
Attached – Row 3.49 3.63 0.14
Apartment 6.29 6.55 0.26
Total City 2.92 3.11 0.19


Calgary Listing Inventory

In June we saw a fairly large increase in our inventory level. Detached homes were the highest showing an increase of 283 listings.

Inventory May  2017 June 2017  Change
Detached 2941 3224 283
Semi Detached 518 560 42
Attached – Row 949 1001 52
Apartment 1780 1874 94
Total City 6188 6659 471


Calgary Sales:

Can you say consistent?  Sales in June were almost identical in numbers to May. As you can see sales remain strong in the detached sector and weak in the apartment condo sector.

Calgary Sales  May  2017 June 2017  Change % Change
Detached 1378 1385 7 0.51%
Semi Detached 186 193 7 3.76%
Attached – Row 272 276 4 1.47%
Apartment 283 286 3 1.06%
Total City 2119 2140 21 0.99%


Calgary Real Estate Sales Prices:

For June all sectors showed price increased with the exception of Apartment Condos which showed a slight decrease.  I believe that you will continue to see this trend for apartment condos for quite some time as there are several new buildings coming to completion stage and it’s just going to increase our inventory.

  Sales Prices May  2017Benchmark Price          June 2017  Benchmark Price Change
Detached 506,700 509,400 2,700
Semi Detached 427,900 432,100 4,200
Attached – Row 292,400 294,000 1,600
Apartment 266,600 265,800 -800
Total City 439,300 441,500 2,200


Sales Prices “Year to Date”  


Sales Prices Jan 1, 2017    Benchmark Price  June 2017  Benchmark Price Change

$

% Change
Detached 498,700 509,400 10,700 2.15%
Semi Detached 406,800 432,100 25,300 6.22%
Attached – Row 302,600 294,000 -8,600 -2.84%
Apartment 265,000 265,800 800 0.30%
Total City 433,400 441,500 8,100 1.87%

 **Please note that these numbers include only Calgary homes and do change on a community basis and more so for towns.  This report does not include rural properties.  If you would like to find stats on your community just let me know.  If you have any questions about this summary or Real Estate questions please feel free to contact us.


March 1, 2017 Calgary Real Estate snapshot

Wednesday, March 1st, 2017

The Calgary Real Estate Market in changing.

Detached homes are now in a Seller’s market position

Semi-Detached homes are now into a balanced market position

Row (Townhouses) and Apartment condos are in a buyers market position but have moved drastically into a better market (towards balanced)


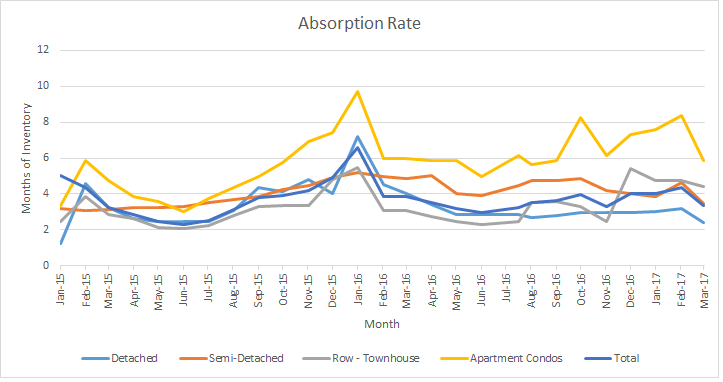
Absorption rate for the Calgary Real Estate market for February 2017.

Absorption rate for the Calgary Real Estate market for February 2017.

What is really happening in the Calgary Real Estate market?

Stay ahead of everyone else by following our Monthly Market Snapshot of the Calgary Real Estate Market This shows what’s really happening! The market is driven by supply and demand so here we show the inventory (supply) and sales (demand) and most importantly the relationship between the two and how it affects the price of Calgary Real Estate.  A simple way to keep up to date with how the market is trending and to stay ahead of most! All numbers are taken from the Calgary Real Estate Boards Stats package for Realtors. I have also included some general comments which are simply my opinion.

Absorption Rate (Months of Inventory)   (the inventory divided by the number of sales in the last month). What does this mean you might ask?

Buyer’s Market >4.0 Drives prices down
Balanced Market Between 2.4 to 4.0 Prices typically remain stable
Seller’s Market <2.4 Drives prices up

*** Absorption Rate***  

The absorption rate for all of Calgary decreased quite substantially this month.  Not a lot of listings going on market but more importantly a large increase in sales is driving this.  Detached homes have now gone into a Seller’s Market position,  Attached-Row & Apartment condos are still in a buyer’s market and Semi-detached is in a balanced market.


December   2016 January  2017 Change
Detached 3.17 2.41 -0.75
Semi Detached 4.61 3.44 -1.17
Attached – Row 4.73 4.41 -0.32
Apartment 8.40 5.88 -2.53
Total City 4.34 3.35 -0.99


Calgary Listing Inventory

February saw a slight increase in our inventory level in all categories.  This is a normal pattern for February as were approaching the spring market.  Normal trends would predict that over the next few months we will continue to see more listings so a further increase in inventory.

Inventory December   2016 January  2017 Change
Detached 1849 1990 141
Semi Detached 383 437 54
Attached – Row 610 679 69
Apartment 1269 1387 118
Total City 4112 4493 381


Calgary Sales:

Wow.  Every Category saw a large increase in sales in February.  The smallest increase was in Attached-row houses (townhouses) and they still increased over Jan by 19.38%   It is normal for us to see an increase in sales from Jan to Feb but this is a large increase which the Calgary Market has been waiting for, for some time.


Calgary Sales   December   2016 January  2017 Change % Change
Detached 584 825 241 41.27%
Semi Detached 83 127 44 53.01%
Attached – Row 129 154 25 19.38%
Apartment 151 236 85 56.29%
Total City 947 1342 395 41.71%


Calgary Real Estate Sales Prices: 

Prices are consistent with our Absorption rate with Detached and Semi Detached prices rising while Attached-Row houses and apartment condos decreased a little more as they are still in a buyer’s market position.   My predictions for the next few months is more of the same trends.

  Sales Prices December   2016 Benchmark Price  January  2017 Benchmark Price Change
Detached 500,400 501,900 1,500
Semi Detached 384,600 386,300 1,700
Attached – Row 307,100 305,900 -1,200
Apartment 269,900 269,200 -700
Total City 437,400 438,100 700


Sales Prices “Year to Date”   


Sales Prices Jan 1, 2017    Benchmark Price  January  2017 Benchmark Price Change

$

% Change
Detached 498,300 501,900 3,600 0.72%
Semi Detached 385,400 386,300 900 0.23%
Attached – Row 307,900 305,900 -2,000 -0.65%
Apartment 269,200 269,200 0 0.00%
Total City 435,400 438,100 2,700 0.62%

Price Sensitivity

**Please note that these numbers include only Calgary homes and do change on a community basis and more so for towns.  This report does not include rural properties.  If you would like to find stats on your community just let me know.  If you have any questions about this summary or Real Estate questions please feel free to contact us.