What is really happening in the Calgary Real Estate Market?
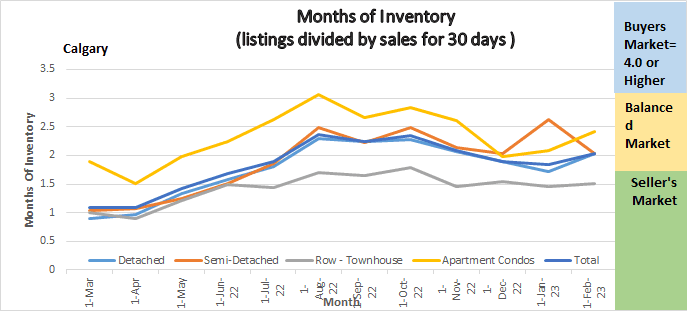
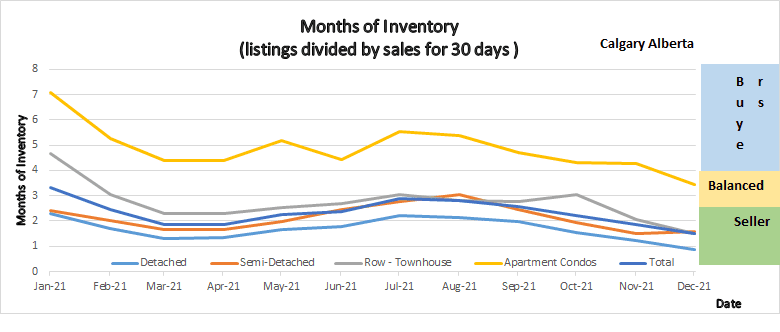
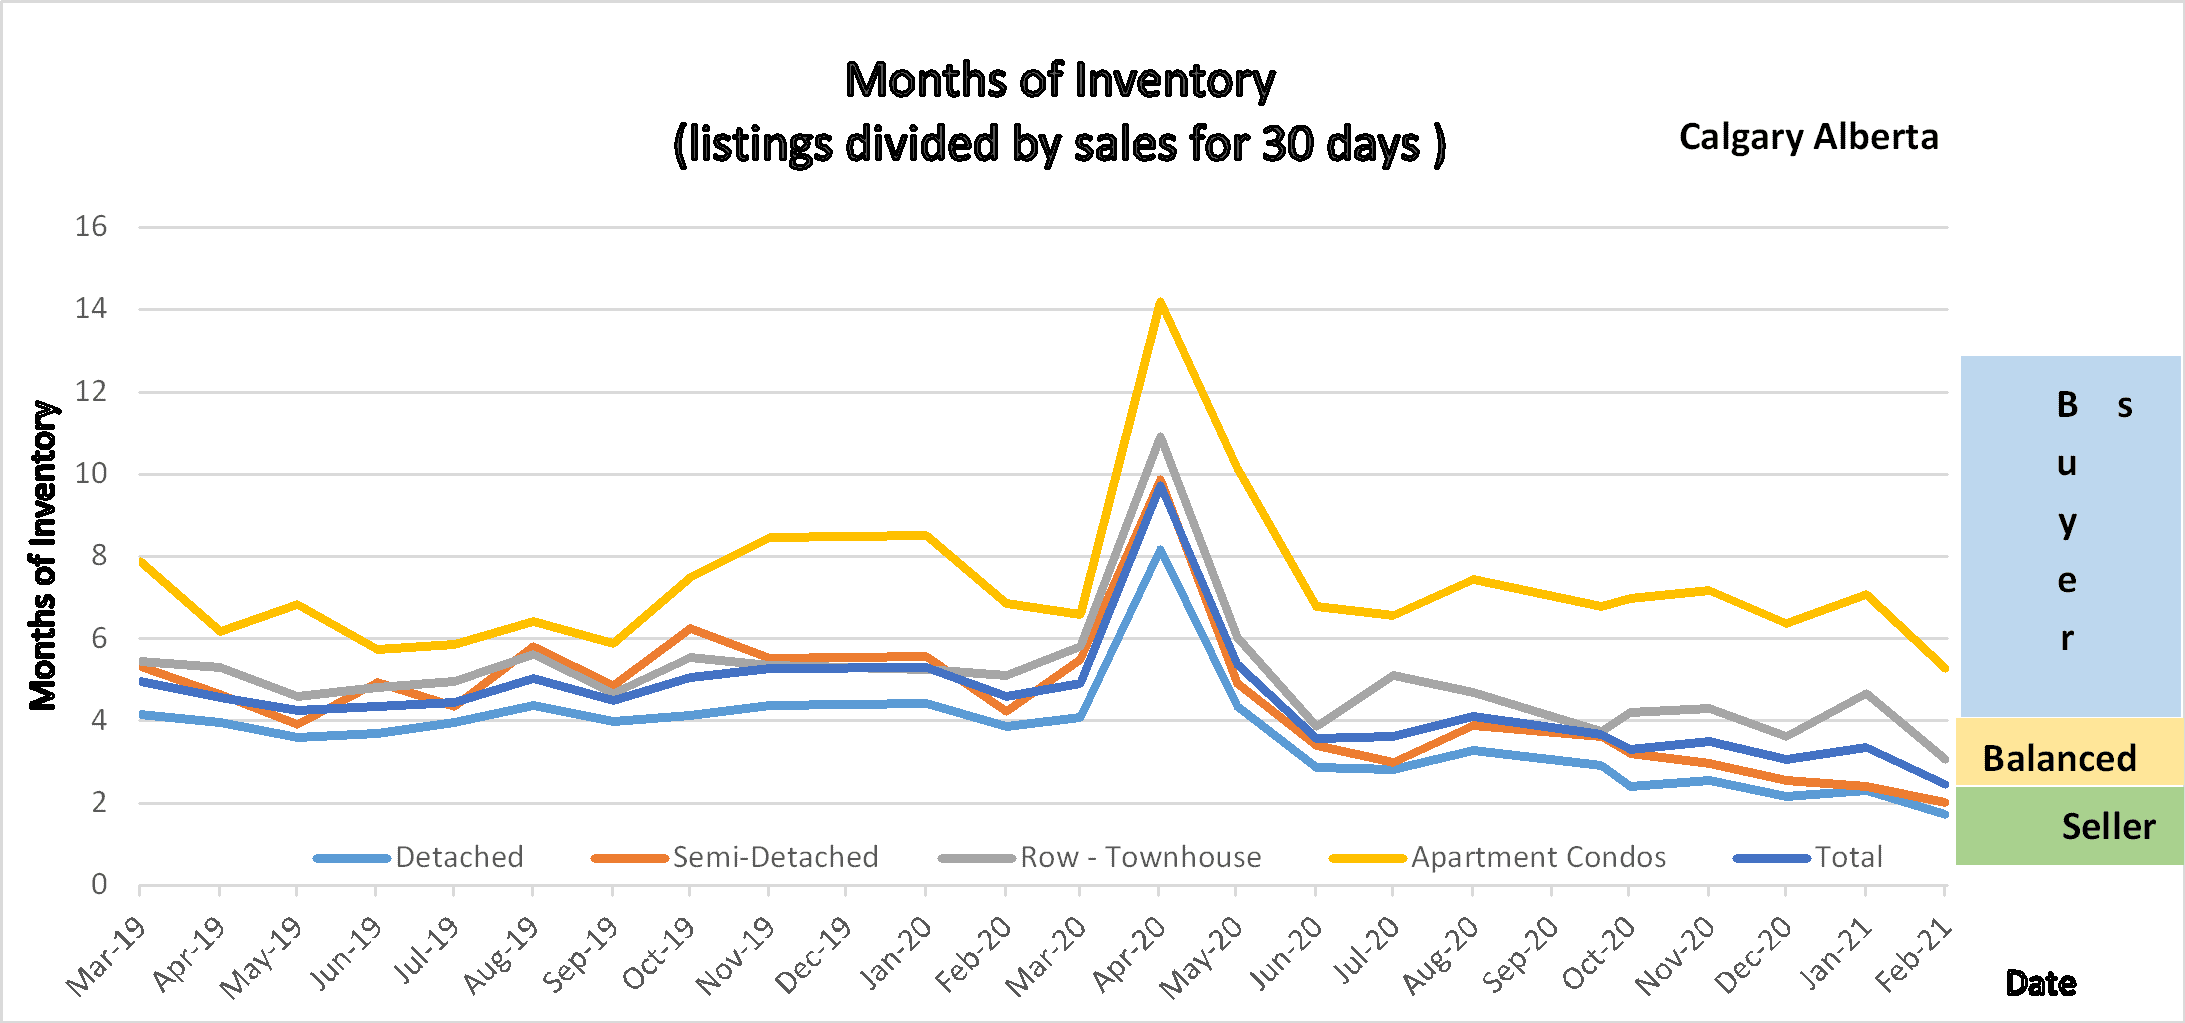
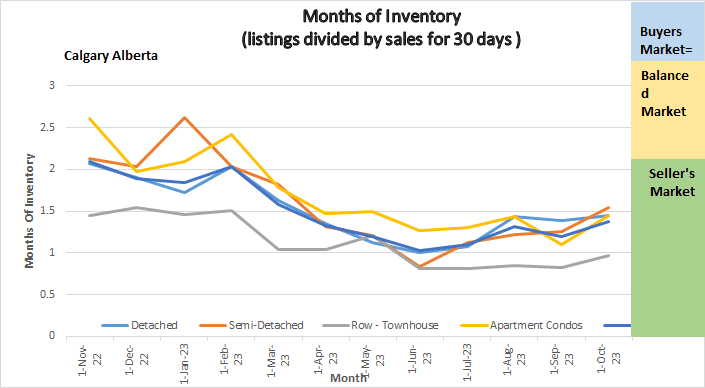
Following is a graph that shows the months of inventory for each housing sector. Looking at a one-year trendline gives you an indication of where things are really heading.
Calgary Real Estate Board Stats
Gord’s commentary for the month (just my opinion).
September 2023 Highlights
The Calgary Market is maintaining its strength, with no substantial change.
- September sales recorded another high at 2441 Sales.
- New listings increased over August preventing our inventory from declining more.
- Inventory is 24% lower than last year.
- Seller’s market continues….
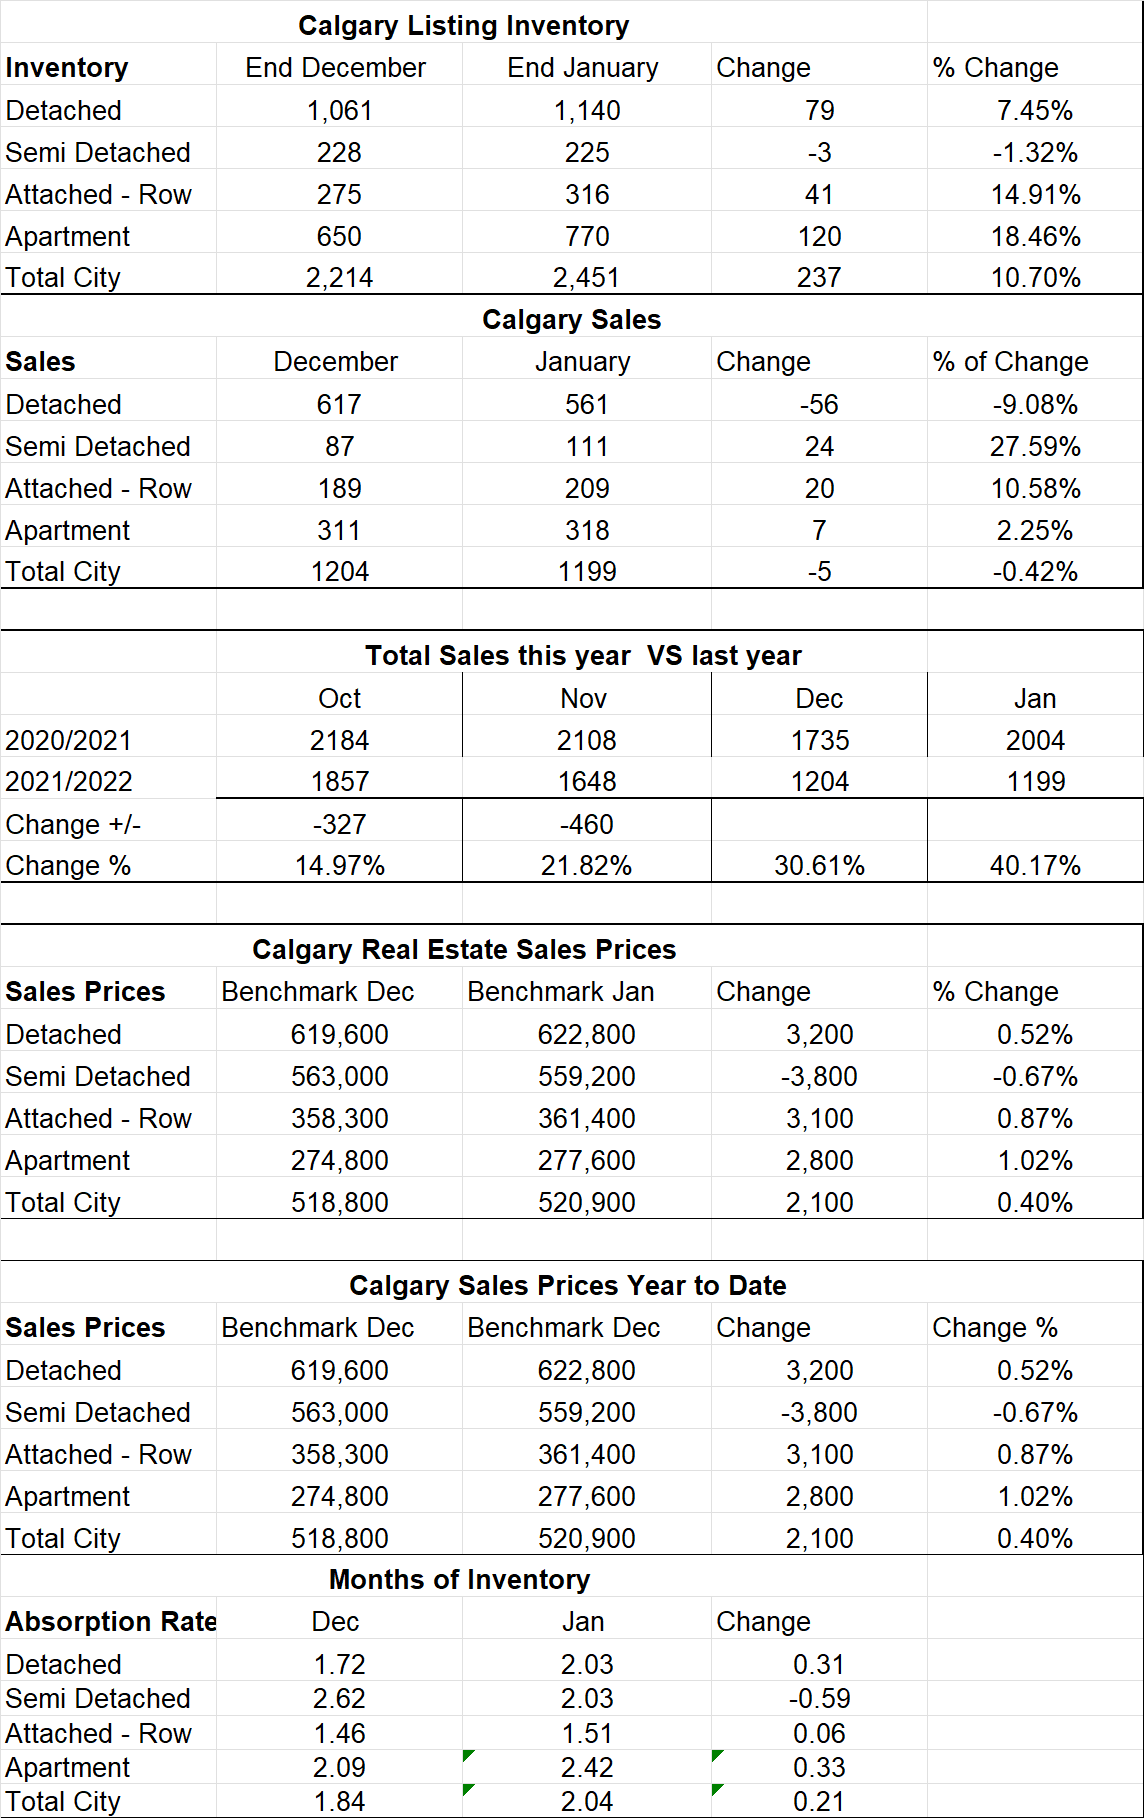
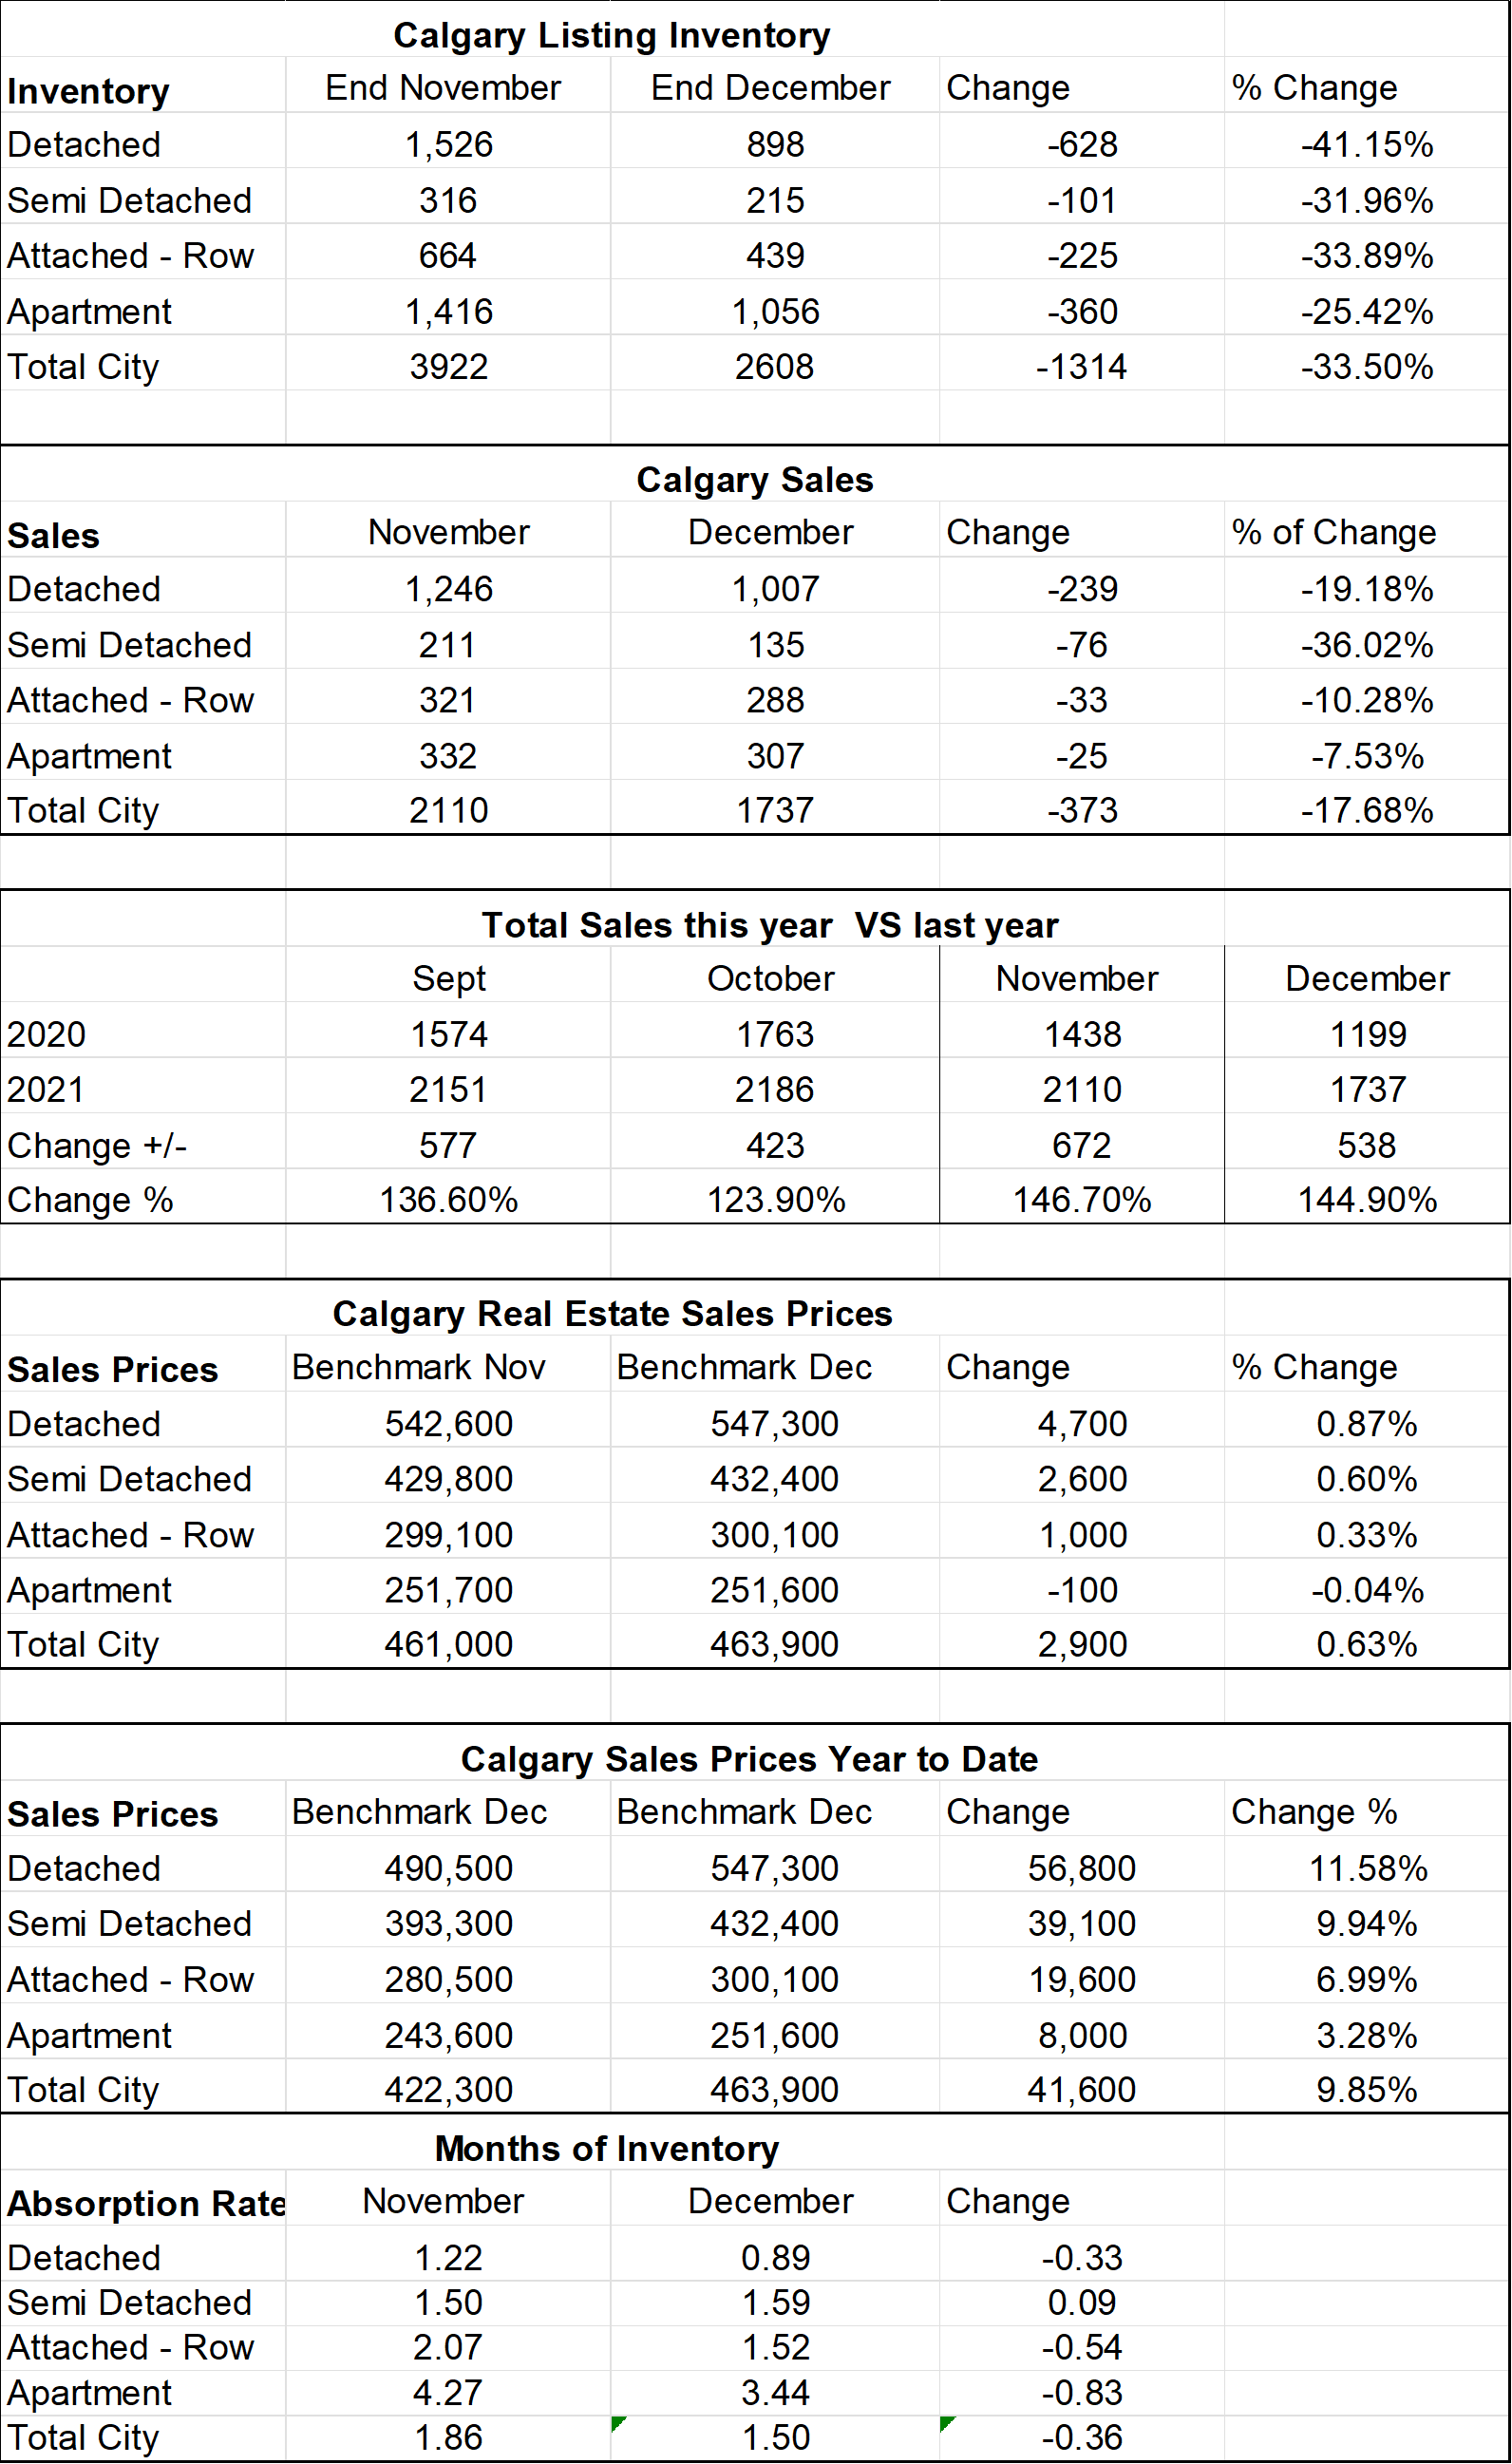
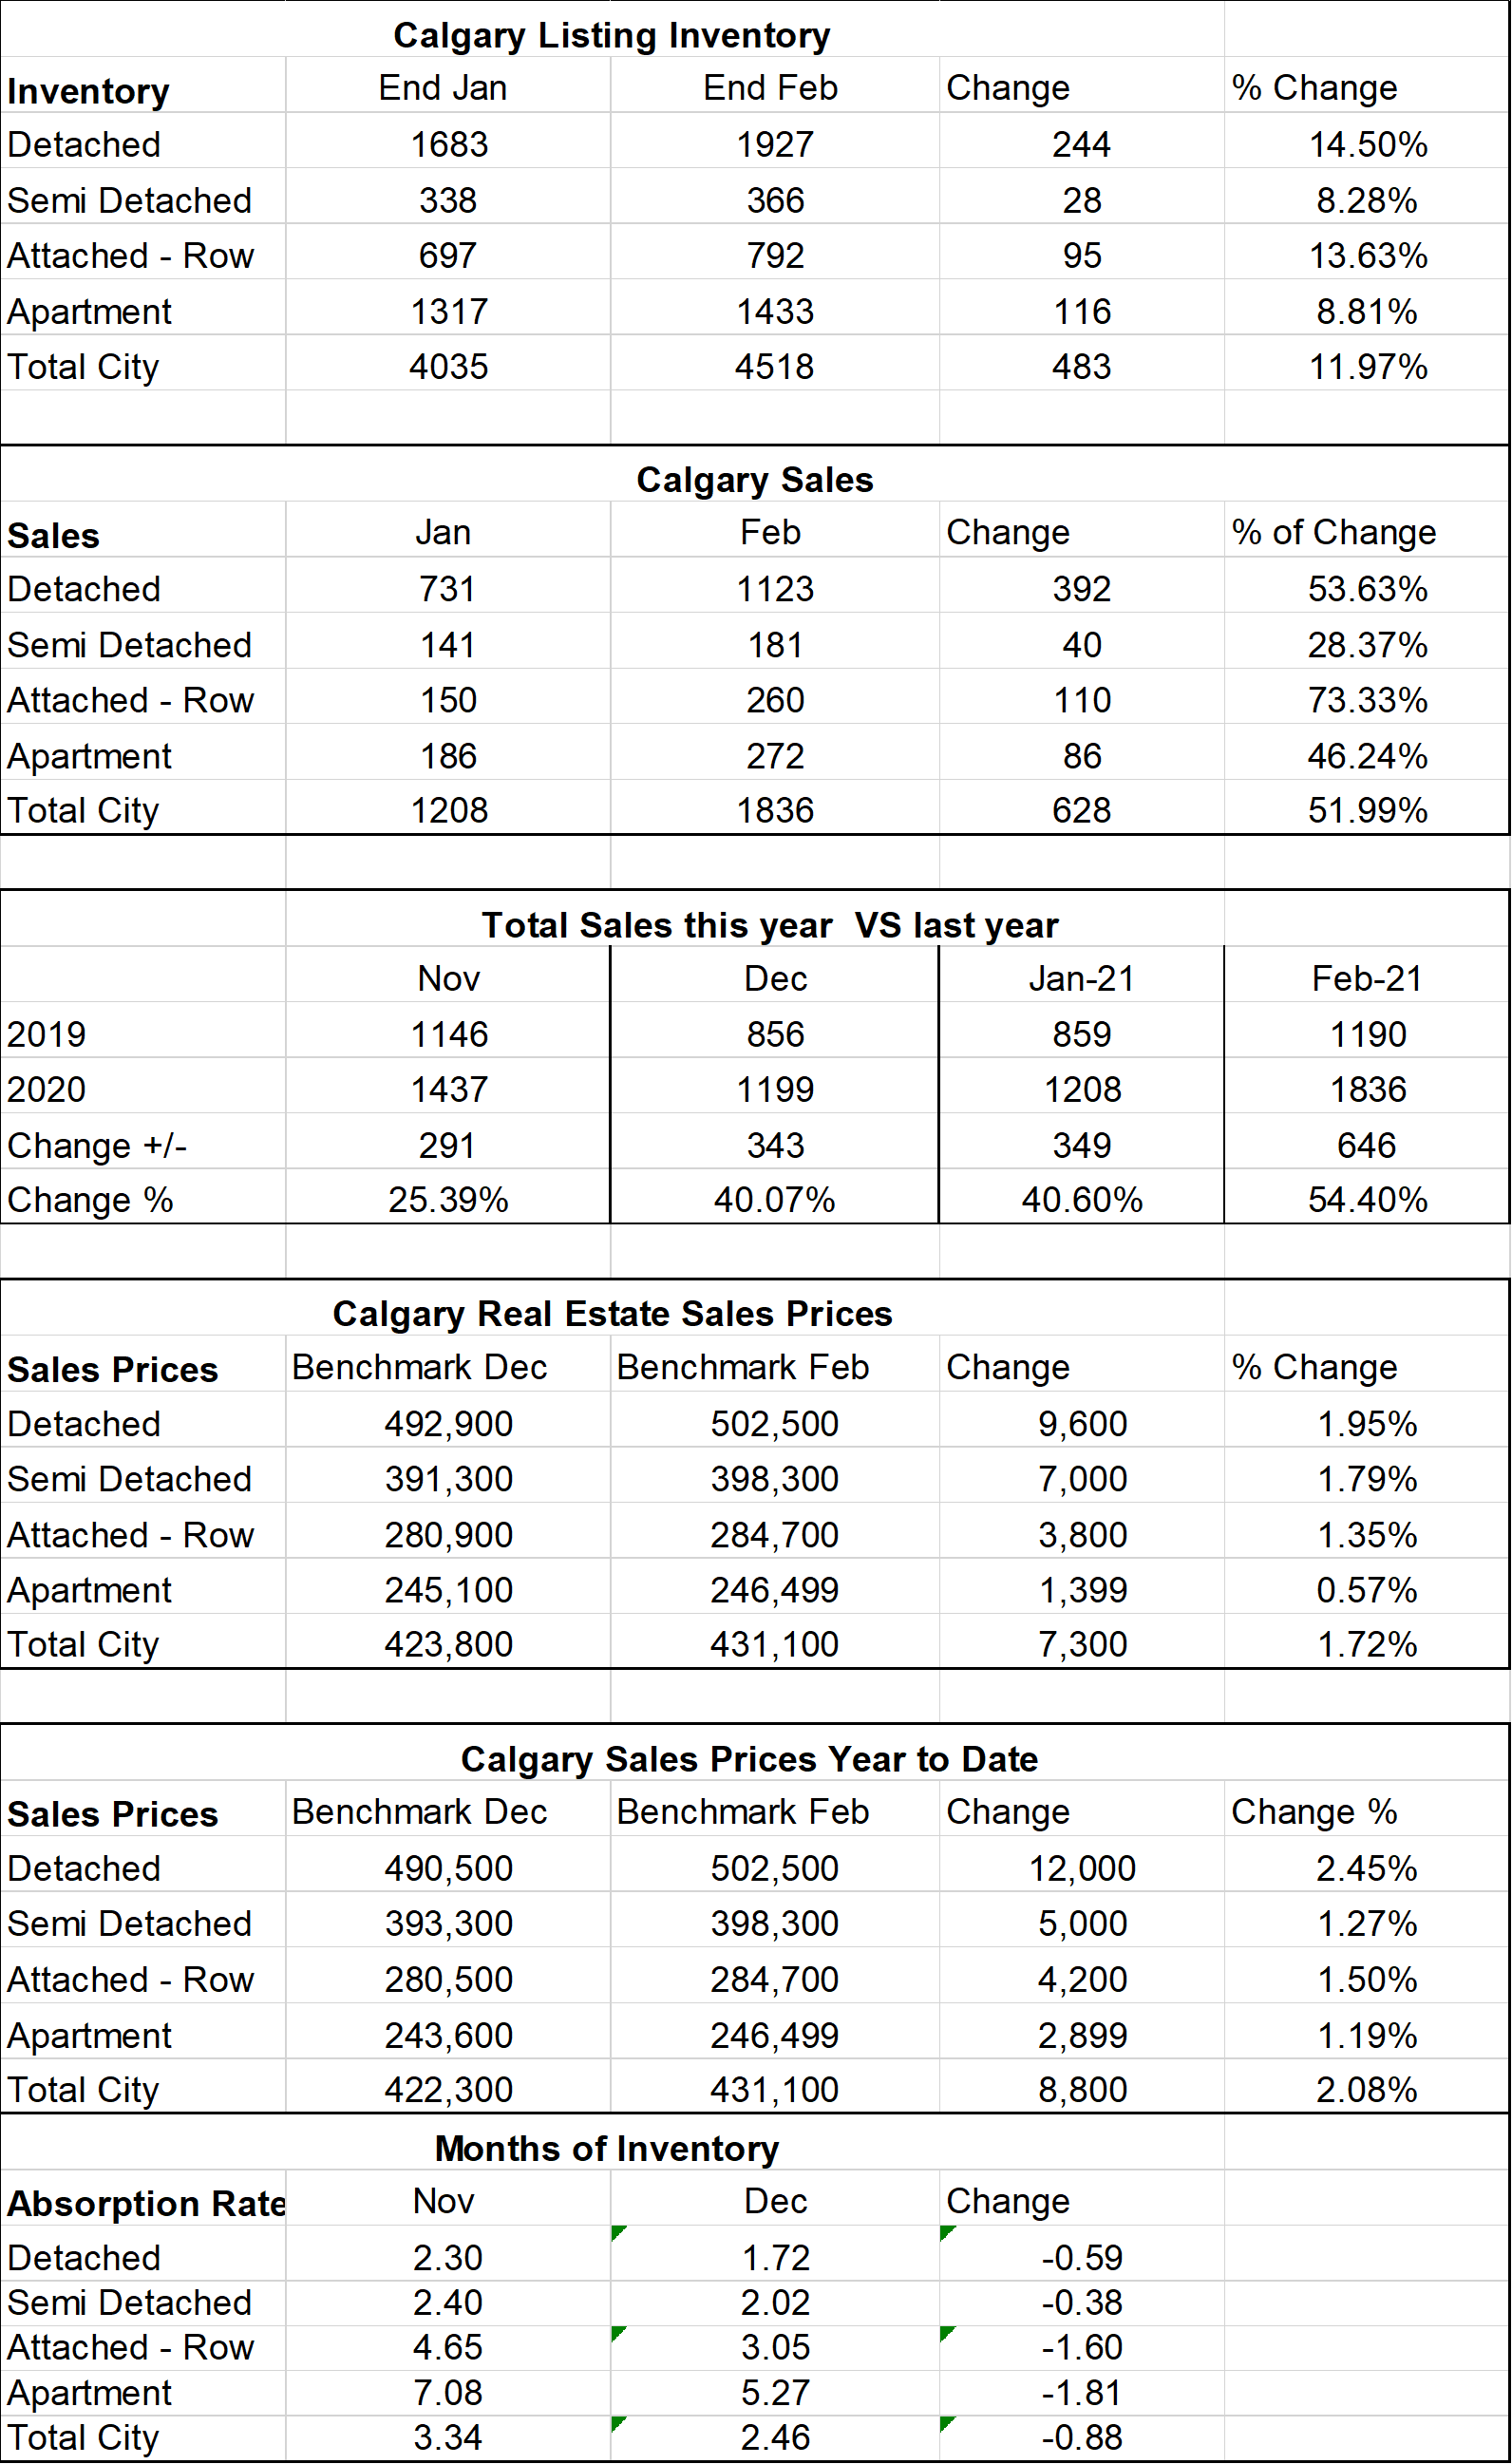
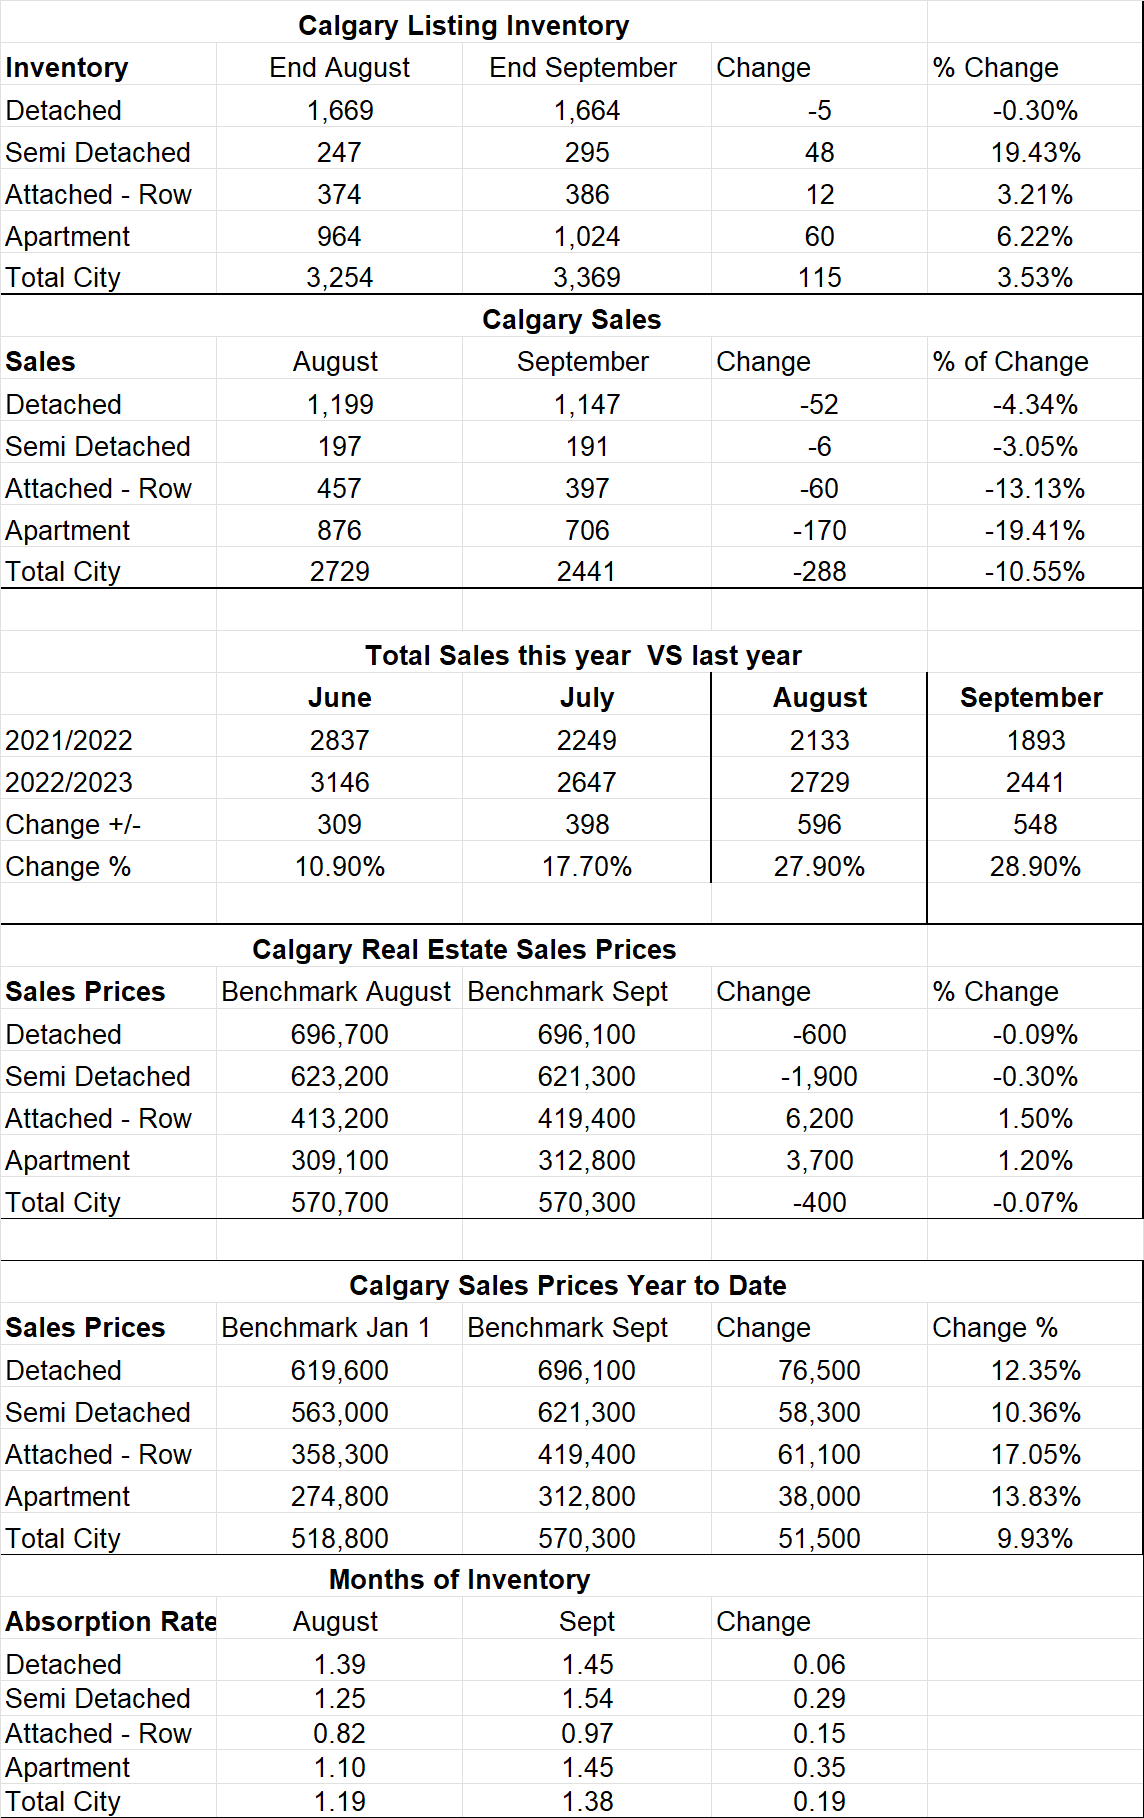
Calgary Listing Inventory
Our listing inventory remains very low with a total of 3369 listings but did show a slight increase of 115 listings. Its important to note that new listings are up, but they are being absorbed so the inventory is not increasing rapidly. Typically, in September we would see inventory rising but that is just not happening.
Calgary Sales:
Sales in September were down by 288 or 10.55% from August. The sectors that saw the largest decreases were Apartment Condos at -170 and Attached Row houses at -60. As I have said many times what is keeping our sales down is our Inventory if there were more listings we would certainly sell more.
Sales Compared to 2022:
It is also important to look at sales compared to the Previous year. Sales for September were up by 28.9% from last year. I attribute this to an increase in listings. The demand is certainly still large so the more we can list the more we sell.
| Jan | Feb | Mar | Apr | May | June | |
| 2022 | 2004 | 3305 | 4091 | 3401 | 3071 | 2837 |
| 2023 | 1199 | 1740 | 2432 | 2690 | 3120 | 3146 |
| Change | -805 | -1565 | -1659 | -711 | +57 | +309 |
| % Change | -40.1% | -47.4% | -40.55% | -20.9% | +1.9% | +10.9% |
| July | Aug | Sept | Oct | Nov | Dec | |
| 2022 | 2249 | 2133 | 1893 | |||
| 2023 | 2647 | 2729 | 2441 | |||
| Change | +398 | +596 | +548 | |||
| % Change | +17.7% | 27.9% | +28.9% |
Calgary Real Estate Benchmark Sales Prices:
Surprise, the overall benchmark price remained almost flat this month showing a decrease of $400. In my opinion we should have seen a rise since we are still in a seller’s market position. I Believe this may have been just a little bounce back from last month.
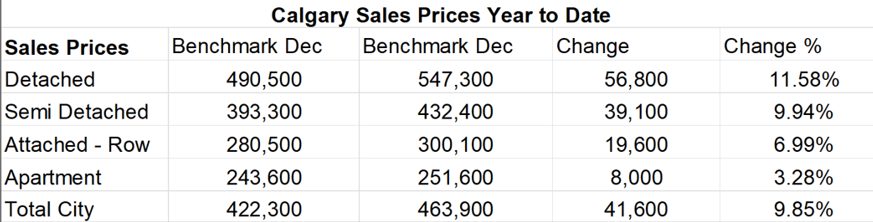
Calgary Real Estate Benchmark Year to Date Sales Price: See chart below.
For all of Calgary we have so far seen an increase in all sectors of 9.93% or $51,500.
The lowest dollar increases so far has been apartment condos at $38,000 and the highest is Detached homes at $76,500. It is important to note that this is a Calgary number and each community within Calgary will be different – some higher and some lower.
Current Months of Inventory (Absorption Rate):
Months of Inventory increased a little in all sectors. The largest increase is in apartment condos (.35) and Semi-Detached (.29) while detached homes and Row Homes stayed flat.
My Prediction for what is ahead: Based on what is driving demand (immigration) and I do not see that changing any time soon, I predict sales are going to remain strong and prices are going to continue to trend upwards although based on trends I see us slowly climbing out of the seller’s market, but it will likely take months.
**Below is a summary of numbers in chart form. All numbers are taken from the Calgary Real Estate Boards monthly Stats package.
*All numbers vary by community and price ranges, if you would like stats specifically for your neighbourhood, please contact us.
Months of Inventory