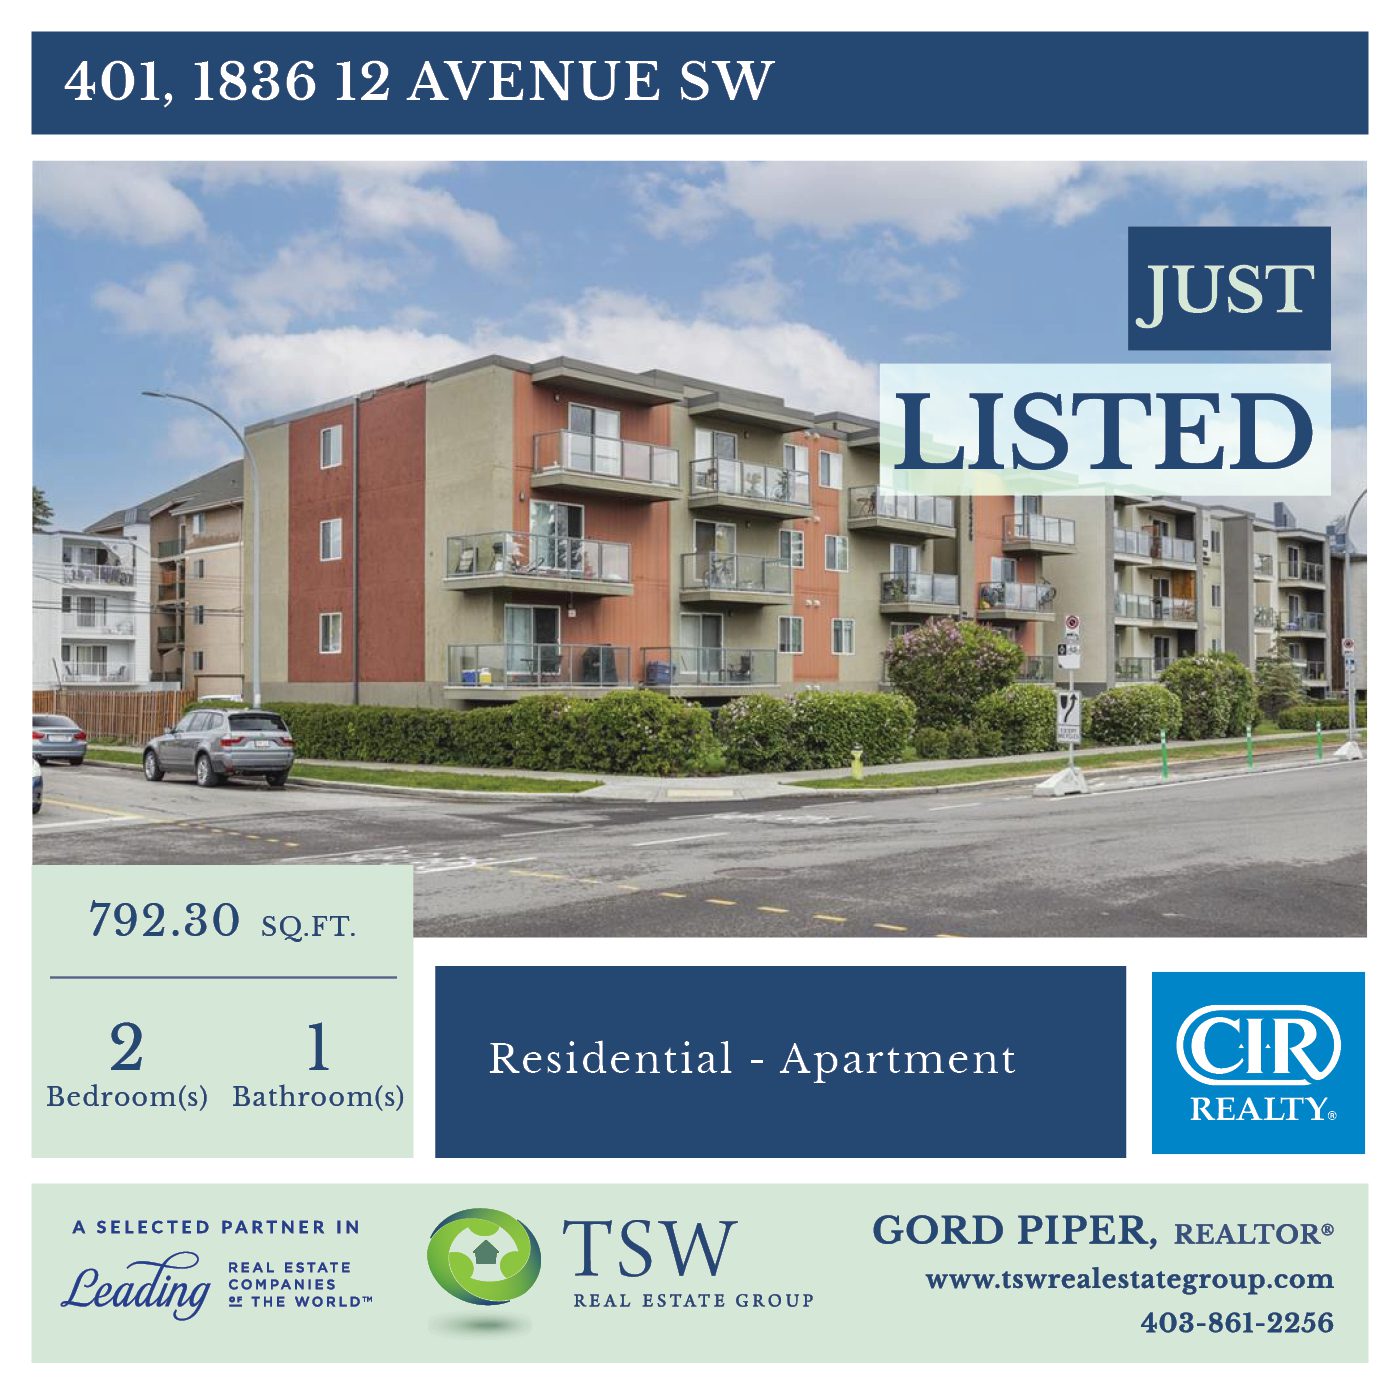
Just listed this awesome unit
Highlights: Top Floor, Open Concept Living and Per Friendly!
MLS: A1230355
Link to More Details: https://www.tswrealestategroup.com/for-sale/401-1836-12-avenue-sw–75384583
Just listed this awesome unit
Highlights: Top Floor, Open Concept Living and Per Friendly!
MLS: A1230355
Link to More Details: https://www.tswrealestategroup.com/for-sale/401-1836-12-avenue-sw–75384583
What is really happening in the Calgary Real Estate Market?
Calgary Real Estate Absorption Rate

Calgary Real Estate Absorption Rate
Stay ahead of everyone else by following our Monthly Market Snapshot of the Calgary Real Estate Market. This shows what’s really happening! The market is driven by supply and demand so here we show the inventory (supply) and sales (demand) and most importantly the relationship between the two and how it affects the price of Calgary Real Estate. A simple way to keep up to date with how the market is trending and to stay ahead of most! All numbers are taken from the Calgary Real Estate Boards Stats package for Realtors. I have also included some general comments which are simply my opinion.
Absorption Rate (Months of Inventory) – the inventory divided by the number of sales in the last month). What does this mean you might ask?
| Buyer’s Market | >4.0 | Drives prices down |
| Balanced Market | Between 2.4 to 4.0 | Prices typically remain stable |
| Seller’s Market | <2.4 | Drives prices up |
Watch the Trend
On the above graph it is important to see the trends – Especially the apartment condo absorption rate- it is trending downward and is closing the gap with the rest of the sectors.
Current Absorption Rate
The absorption rate for all categories except Attached-Row houses declined this month which in my opinion is a good thing as it shows a little more balance in the market.
| End of | May 2018 | June 2018 | Change |
| Detached | 4.26 | 3.98 | -0.28 |
| Semi Detached | 5.53 | 5.04 | -0.49 |
| Attached – Row | 5.06 | 5.73 | 0.67 |
| Apartment | 6.81 | 6.41 | -0.40 |
| Total City | 4.90 | 4.65 | -0.24 |
Calgary Listing Inventory
In June, our inventory increased in all sectors except apartment condos. This is totally expected at this time of year. July should be an interesting month as the typical July will see listings drop off. The decrease in apartment condos I would contribute to listings expiring as sales were flat.
| Inventory | May 2018 | June 2018 | Change |
| Detached | 4504 | 4817 | 313 |
| Semi Detached | 862 | 922 | 60 |
| Attached – Row | 1163 | 1209 | 46 |
| Apartment | 1921 | 1872 | -49 |
| Total City | 8450 | 8820 | 370 |
Calgary Sales:
Sales were again up in all categories except for Attached Row houses which were down only 19 from May. The percentage looks big at 8.26 due to small numbers in this sector.
Sales for June were 11% down from last year but this is again an improvement as May sales were down 18.4% from last year.
| Calgary Sales | May 2018 | June 2018 | Change | % Change |
| Detached | 1058 | 1210 | 152 | 14.37% |
| Semi Detached | 156 | 183 | 27 | 17.31% |
| Attached – Row | 230 | 211 | -19 | -8.26% |
| Apartment | 282 | 292 | 10 | 3.55% |
| Total City | 1726 | 1896 | 170 | 9.85% |
Calgary Real Estate Sales Prices:
This one has me stumped. In theory the sector with the highest absorption rate should have the biggest decline in price. The opposite took place in June with every sector dropping a little except Apartment Condos which increased in price.
| Sales Prices | May 2018 Benchmark Price | June 2018 Benchmark Price | Change |
| Detached | 504,500 | 503,100 | -1,400 |
| Semi Detached | 419,000 | 418,000 | -1,000 |
| Attached – Row | 303,200 | 302,300 | -900 |
| Apartment | 256,200 | 259,100 | 2,900 |
| Total City | 436,900 | 436,500 | -400 |
Sales Prices “Year to Date”
Same as monthly number
| Sales Prices | Jan 1, 2018 Benchmark Price | June 2018 Benchmark Price | Change
$ |
% Change |
| Detached | 499,600 | 503,100 | 3,500 | 0.70% |
| Semi Detached | 416,600 | 418,000 | 1,400 | 0.34% |
| Attached – Row | 299,500 | 302,300 | 2,800 | 0.93% |
| Apartment | 257,700 | 259,100 | 1,400 | 0.54% |
| Total City | 433,200 | 436,500 | 3,300 | 0.76% |
**Please note that these numbers include only Calgary homes and do change on a community basis and more so for towns. This report does not include rural properties. If you would like to find stats on your community just let me know. If you have any questions about this summary or about Real Estate in general, please feel free to contact us.

Calgary Real Estate Absorption Rate
What is really happening in the Calgary Real Estate Market?
Stay ahead of everyone else by following our Monthly Market Snapshot of the Calgary Real Estate Market, This shows what’s really happening! The market is driven by supply and demand so here we show the inventory (supply) and sales (demand) and most importantly the relationship between the two and how it affects the price of Calgary Real Estate. A simple way to keep up to date with how the market is trending and to stay ahead of most! All numbers are taken from the Calgary Real Estate Boards Stats package for Realtors. I have also included some general comments which are simply my opinion.
Absorption Rate (Months of Inventory – the inventory divided by the number of sales in the last month). What does this mean you might ask?
| Buyer’s Market | >4.0 | Drives prices down |
| Balanced Market | Between 2.4 to 4.0 | Prices typically remain stable |
| Seller’s Market | <2.4 | Drives prices up |
Current Absorption Rate
The good news part of the stats show that sales rose by 25.6% over Febuary while the inventory rose by only 22.5% keeping the balance similar. The Absorption rate for all categories decreased slightly except apartment condos which increased by .47
| End of | Feb 2018 | Mar 2018 | Change |
| Detached | 3.74 | 3.61 | -0.13 |
| Semi Detached | 5.05 | 4.70 | -0.35 |
| Attached – Row | 5.86 | 5.77 | -0.08 |
| Apartment | 7.24 | 7.72 | 0.47 |
| Total City | 4.76 | 4.64 | -0.12 |
Calgary Listing Inventory
In March, our inventory increased in all Sectors. This is totally expected at this time of year. This trend is anticipated for the next few months.
| Inventory | Feb 2018 | Feb Mar 2018 | Change |
| Detached | 2456 | 3063 | 607 |
| Semi Detached | 540 | 677 | 137 |
| Attached – Row | 779 | 941 | 162 |
| Apartment | 1427 | 1690 | 263 |
| Total City | 5202 | 6371 | 1169 |
Calgary Sales: For me this is the category that is concerning. Sales numbers all increased for March which is a normal trend. What you cannot see here is that sales for the first three months are below last years sales by 18% which is substantial. Some things that might be affecting sales include:
As I have predicted in the past I believe it may take 6 months total for the mortgage rules to settle out before we start seeing more normal sales numbers.
| Calgary Sales | Feb 2018 | Mar 2018 | Change | % Change |
| Detached | 657 | 848 | 191 | 29.07% |
| Semi Detached | 107 | 144 | 37 | 34.58% |
| Attached – Row | 133 | 163 | 30 | 22.56% |
| Apartment | 197 | 219 | 22 | 11.17% |
| Total City | 1094 | 1374 | 280 | 25.59% |
Calgary Real Estate Sales Prices:
Prices in March showed very little change for all categories.
| Sales Prices | Feb 2018 Benchmark Price | Mar 2018 Benchmark Price | Change |
| Detached | 502,800 | 503,800 | 1,000 |
| Semi Detached | 418,800 | 418,800 | 0 |
| Attached – Row | 295,400 | 297,600 | 2,200 |
| Apartment | 256,400 | 257,100 | 700 |
| Total City | 434,300 | 435,600 | 1,300 |
Sales Prices “Year to Date”
| Sales Prices | Jan 1, 2018 Benchmark Price | Mar 2018 Benchmark Price | Change
$ |
% Change |
| Detached | 499,600 | 503,800 | 4,200 | 0.84% |
| Semi Detached | 416,600 | 418,800 | 2,200 | 0.53% |
| Attached – Row | 299,500 | 297,600 | -1,900 | -0.63% |
| Apartment | 257,700 | 257,100 | -600 | -0.23% |
| Total City | 433,200 | 435,600 | 2,400 | 0.55% |
**Please note that these numbers include only Calgary homes and do change on a community basis and more so for towns. This report does not include rural properties. If you would like to find stats on your community just let me know. If you have any questions about this summary or about Real Estate in general, please feel free to contact us.
Stay ahead of the curve by following our Monthly Market Snapshot of the Calgary Real Estate Market. This shows what’s really happening in the Calgary Real Estate Market. The market is driven by supply and demand so here we show the inventory (supply) and sales (demand) and the effect on the price of Calgary Real Estate. A simple way to keep up to date and ahead of most! The Calgary housing market is deeply entrenched is a Sellers Market with very little supply and strong demand. In July we started seeing a slight shift towards a buyers market but we have a long way to go.
Below are the details along with a few comments, all numbers were taken from the Calgary Real Estate Boards Stats package for Realtors.
Want to see stats specific to your Community? Register for our Market Report at http://www.calgaryareasolds.com/
Calgary Listing Inventory: Inventory levels decreased for single family homes and stayed flat for townhouses and condos. Normally our inventory would show a much higher increase in July. I speculate the reason is that we still have a large backlog of buyers waiting for the perfect home to come on the market. I am surprised that the levels did not increase more than they did.
| Inventory | June 2014 | July 2014 | Change |
| Single Family Home | 3128 | 3056 | -72 |
| Condo Townhouse | 523 | 536 | +13 |
| Condo Apartment | 1071 | 1070 | -1 |
| Total | 4722 | 4662 | -60 |
Calgary Sales:
Sales in July decreased in all categories. Sales numbers decreasing is very normal at this time as people start to go on summer vacations and the city shuts down for the Stampede. No surprises here.
| Sales | June 2014 | July 2014 | Change | % Change |
| Single Family Home | 1769 | 1553 | -216 | -12.2 |
| Condo Townhouse | 427 | 339 | -88 | -20.6 |
| Condo Apartment | 474 | 444 | -30 | -6.3 |
| Total | 2670 | 2336 | -334 | -12.5 |
Calgary Real Estate Sales Prices:
In June, the benchmark price increased for all categories. Based on the inventory change, prices are likely to increase for a few more months as we move from a seller’s market to a more balanced market. If you have been following my reports monthly the increase is smaller than what we have been seeing.
| Sales Prices | June 2014 Benchmark Price | July 2014
Benchmark Price |
Change |
| Single Family Homes | 509,700 | 511,600 | +1900 |
| Condo Townhouse | 326,000 | 327,000 | +1,000 |
| Condo Apartment | 299,700 | 298,100 | -1,600 |
Sales Prices “Year to Date”
Year to date prices – same as above, Prices have increased in all categories. Good news if you are a homeowner.
| Sales Prices | Dec 31 2013 Benchmark Price | July 2014 Benchmark Price | Change
$ |
% Change |
| Single Family Homes | 472,200 | 511,600 | +39,400 | +8.3 |
| Condo Townhouse | 307,100 | 327,000 | +19,900 | +6.5 |
| Condo Apartment | 278,600 | 298,100 | +19,500 | +7.00 |
Absorption Rate (Months of Inventory) (the inventory divided by the number of sales in the last month). What does this mean you might ask?
| Buyer’s Market | >4.0 |
| Balanced Market | Between 2.8 to 4.0 |
| Seller’s Market | <2.8 |
Absorption Rate: For the fourth month in a row our absorption rate has increased. This indicates that the market is changing and we are moving towards a balanced market with apartment condos leading the way. Please note that we are so deep in a Seller’s market that it will take us a few more months of this trend to reach a balanced market. My prediction is that this trend will continue and by September or October we will be approaching a balanced market – sooner for apartment condos.
| Absorption Rate | June 2014 | July 2014 | Change |
| Single Family Homes | 1.77 | 1.97 | +.2 |
| Condo Townhouse | 1.22 | 1.58 | +.36 |
| Condo Apartment | 2.26 | 2.40 | +.14 |
| Total Calgary | 1.77 | 1.99 | +.22 |
**Please note that these numbers do change on a community basis and more so for towns. If you would like to find stats on your community just let me know. If you have any questions about this summary, the attached stats package or any Real Estate questions please feel free to contact us.
New listing today. Fantastic location in Sunnyside only a block away from the river. This building was not affected by 2013 floods. This unit has been completely renovated (2006) and attention to detail is everywhere. Kitchen features Mocha Cabinetry, wine rack, granite counter tops and Stainless steel appliances. Spacious living room features high end laminate flooring, electric fireplace and built in shelving. This unit offers Insuite Laundry, assigned parking stall and a separate storage room (just down the hall). Location is fantastic with a walk score of 90. Right across from the Vendome Café, minutes to river and pathway system, 2 min walk to the LRT, minutes to coop and tons of shopping, short walk to downtown and only 2 blocks to the Sunnyside community garden. To view our video tour visit http://youtu.be/g4XJOrdLmYY


Stay ahead of the curve by following our Monthly Market Snapshot of the Calgary Real Estate Market. This shows what’s really happening in the Calgary Real Estate Market. The market is driven by supply and demand so here we show the inventory (supply) and sales (demand) and the effect on the price of Calgary Real Estate. A simple way to keep up to date and ahead of most! The Calgary housing market is deeply entrenched is a Sellers Market with very little supply and strong demand. In June we started seeing a slight shift towards a buyers market but we have a long way to go.
Below are the details along with a few comments, all numbers were taken from the Calgary Real Estate Boards Stats package for Realtors.
Want to see stats specific to your Community? Register for our Market Report at http://www.calgaryareasolds.com/
Calgary Listing Inventory: Inventory levels increased this month in all categories except townhouses. Increasing inventory levels is very normal at this time of year as many sellers wait until spring to sell. I am actually surprised that the levels did not increase more than they did.
| Inventory | May 2014 | June 2014 | Change |
| Single Family Home | 2947 | 3128 | +181 |
| Condo Townhouse | 576 | 523 | -53 |
| Condo Apartment | 1051 | 1071 | +20 |
| Total | 4574 | 4722 | +148 |
Calgary Sales:
Sales in June decreased in all categories except for Townhouses which increased slightly. Sales numbers decreasing is very normal at this time as people start to go on summer vacations. The increase in sales in Townhouse is most likely that there is still a pent up demand and people were just waiting for the right one to come on the market.
| Sales | May 2014 | June 2014 | Change | % Change |
| Single Family Home | 2027 | 1769 | -258 | -14.5% |
| Condo Townhouse | 410 | 427 | +17 | +3.9 |
| Condo Apartment | 511 | 474 | -37 | -7.8% |
| Total | 2948 | 2670 | -278 | -10.4% |
Calgary Real Estate Sales Prices:
In June, the benchmark price increased for all categories. Based on the inventory change, prices are likely to increase for a few more months as we move from a seller’s market to a more balanced market.
| Sales Prices | May 2014 Benchmark Price | June 2014 Benchmark Price | Change |
| Single Family Homes | 504,300 | 509,700 | +5,400 |
| Condo Townhouse | 321,400 | 326,000 | +4,600 |
| Condo Apartment | 295,400 | 299,700 | +4,300 |
Sales Prices “Year to Date”
Year to date prices – same as above, Prices have increased in all categories. Good news if you are a homeowner.
| Sales Prices | Dec 31 2013 Benchmark Price | June 2014 Benchmark Price | Change$ | % Change |
| Single Family Homes | 472,200 | 509,700 | +37,500 | +7.94 |
| Condo Townhouse | 307,100 | 326,000 | +18,900 | +6.15 |
| Condo Apartment | 278,600 | 299,700 | +21,100 | +7.58 |
Absorption Rate (Months of Inventory) (the inventory divided by the number of sales in the last month). What does this mean you might ask?
| Buyer’s Market | >4.0 |
| Balanced Market | Between 2.8 to 4.0 |
| Seller’s Market | <2.8 |
Absorption Rate: For the third month in a row our absorption rate has increased. This indicates that the market is changing and we are moving towards a balanced market. Please note that we are so deep in a Seller’s market that it will take us a few more months of this trend to reach a balanced market state. My prediction is that this trend will continue and by September or October we will be approaching a balanced market – maybe sooner for apartment condos.
| Absorption Rate | May 2014 | June 2014 | Change |
| Single Family Homes | 1.45 | 1.77 | +.32 |
| Condo Townhouse | 1.40 | 1.22 | -.18 |
| Condo Apartment | 2.06 | 2.26 | +.20 |
| Total Calgary | 1.55 | 1.77 | +.22 |
**Please note that these numbers do change on a community basis and more so for towns. If you would like to find stats on your community just let me know. If you have any questions about this summary, the attached stats package or any Real Estate questions please feel free to contact us.
If you know anyone else who might enjoy seeing our monthly summary please feel free to pass this on. Gord, Eric & Brent
Want to know what’s really happening in the Calgary Real Estate Market. The market is driven by supply and demand so here we show the inventory (supply) and sales (demand) and the effect on the price of Calgary Real Estate. A simple way to keep up to date on the Market. The Calgary housing market is still entrenched is a Sellers Market with limited supply and strong sales and I do not see that changing anytime soon.
Below are the details along with a few comments, all numbers were taken from the Calgary Real Estate Boards Stats package for Realtors.
Calgary Listing Inventory: Inventory levels for all categories dropped substantially this last month. This is simply a seasonal adjustment that happens every year. In the next few days listings will start to hit the market bringing these numbers right back up.
| Inventory |
November 2013 |
December 2013 |
Change |
| Single Family Home |
2171 |
1515 |
-656 |
| Condo Townhouse |
380 |
242 |
-138 |
| Condo Apartment |
605 |
479 |
-126 |
| Total |
3156 |
2236 |
-920 |
Calgary Sales:
Sales in December declined in all categories and again this is very normal for the month of December. Considering the weather I think we faired well. It is also important to note that sales in December were 8.3% higher than in December 2012. I am very confident that January’s numbers will be much higher.
| Sales |
November 2013 |
December 2013 |
Change |
% Change |
| Single Family Home |
1006 |
744 |
-262 |
-26.0 |
| Condo Townhouse |
228 |
179 |
-49 |
-21.5 |
| Condo Apartment |
305 |
221 |
-84 |
-27.5 |
| Total |
1539 |
1144 |
-395 |
-25.6 |
Calgary Real Estate Sales Prices:
In December, the benchmark price increased for all categories except apartment Condos which saw a small decrease. As long as our ratio of sales to listings remains the same this upward trend will continue.
| Sales Prices |
November 2013 Benchmark Price |
December 2013 Benchmark Price |
Change |
| Single Family Homes |
470,600 |
472,200 |
+$1,600 |
| Condo Townhouse |
305,700 |
307,100 |
+$1,400 |
| Condo Apartment |
279,600 |
278,600 |
-$1,000 |
Sales Prices “Year to Date”
Year to date prices have increased in all categories. Good news if you are a homeowner and not so good news for those wanting to get into the market.
| Sales Prices | Dec 31 2012 Benchmark Price |
Dec 31. 2013 Benchmark Price |
Change $ |
% Change |
| Single Family Homes |
434,800 |
472,200 |
+37,400 |
+8.6% |
| Condo Townhouse |
284,100 |
307,100 |
+23,000 |
+8.1% |
| Condo Apartment |
248,700 |
278,600 |
+29,900 |
+12.0% |
Absorption Rate (Months of Inventory) (the inventory divided by the number of sales in the last month). What does this mean you might ask?
|
Buyer’s Market |
>4.0 |
|
Balanced Market |
Between 2.8 to 4.0 |
|
Seller’s Market |
<2.8 |
Absorption Rate: This doesn’t tell us much this month as December is a funny month where lots of people take their home off the market for the holidays and then relist in Jan. We are still in a strong seller’s market position and I don’t see that changing anytime soon. In the starter home price range we are still seeing lots of competing offers.
| Absorption Rate |
November 2013 |
December 2013 |
Change |
| Single Family Homes |
2.15 |
2.03 |
-.12 |
| Condo Townhouse |
1.67 |
1.35 |
-.32 |
| Condo Apartment |
1.98 |
2.17 |
+.19 |
| Total Calgary |
2.05 |
1.96 |
-.09 |
**Please note that these numbers do change on a community basis and more so for towns. If you would like to find stats on your community just let me know. If you have any questions about this summary, the attached stats package or any Real Estate questions please feel free to contact us.
If you know anyone else who might enjoy seeing our monthly summary please feel free to pass this on. Gord, Eric, Brent & Jason
Want to know what’s really happening in the Calgary Real Estate Market. The market is driven by supply and demand so here we show the inventory (supply) and sales (demand) and the effect on the price of Calgary Real Estate. In summary the Calgary housing market is still entrenched is a Sellers Market with limited supply and strong sales.
Below are the details along with a few comments, all numbers were taken from the Calgary Real Estate Boards Stats package for Realtors.
Calgary Listing Inventory: Inventory levels for all categories dropped substantially this month. In my opinion this is of no concern and is simply a seasonal trend. We will see a further decrease in December and then in Jan it should start to increase again. Very few people want to list their home during the holiday season.
| Inventory |
October 2013 |
November 2013 |
Change |
| Single Family Home |
2705 |
2171 |
-534 |
| Condo Townhouse |
444 |
380 |
-64 |
| Condo Apartment |
692 |
605 |
-87 |
| Total |
3841 |
3156 |
-685 |
Calgary Sales:
Sales in November declined at almost the same as rate that inventory dropped. Traditionally this time of year we start to see sales slowing so again I’ll call it a seasonal trend.
| Sales |
October 2013 |
November 2013 |
Change |
% Change |
| Single Family Home |
1336 |
1006 |
-330 |
-24.7 |
| Condo Townhouse |
280 |
228 |
-52 |
-18.9 |
| Condo Apartment |
337 |
305 |
-32 |
-9.4 |
| Total |
1953 |
1539 |
-414 |
-21.1 |
Calgary Real Estate Sales Prices:
In November, the benchmark price increased for all categories. As long as our ratio of sales to listings remains the same this trend will continue.
| Sales Prices |
October 2013 Benchmark Price |
November 2013 Benchmark Price |
Change |
| Single Family Homes |
468,000 |
470,600 |
+2,600 |
| Condo Townhouse |
302,200 |
305,700 |
+3,500 |
| Condo Apartment |
276,100 |
279,600 |
+3,500 |
Sales Prices “Year to Date”
Year to date prices have increased in all categories.
| Sales Prices | Dec 31 2012 Benchmark Price |
November 2013 Benchmark Price |
Change |
% Change |
| Single Family Homes |
434,800 |
470,600 |
+35,800 |
+8.2% |
| Condo Townhouse |
284,100 |
305,700 |
+21,600 |
+7.6% |
| Condo Apartment |
248,700 |
279,600 |
+30,900 |
+12.4% |
Absorption Rate (Months of Inventory) (the inventory divided by the number of sales in the last month). What does this mean you might ask?
|
Buyer’s Market |
>4.0 |
|
Balanced Market |
Between 2.8 to 4.0 |
|
Seller’s Market |
<2.8 |
Absorption Rate: Throughout November our absorption changed but only marginally. We are still in a strong seller’s market position. In the starter home price range we are still seeing lots of competing offers.
| Absorption Rate |
October 2013 |
November 2013 |
Change |
| Single Family Homes |
2.02 |
2.15 |
+.13 |
| Condo Townhouse |
1.58 |
1.67 |
+.09 |
| Condo Apartment |
2.05 |
1.98 |
-.07 |
| Total Calgary |
1.97 |
2.05 |
+.08 |
**Please note that these numbers do change on a community basis and more so for towns. If you would like to find stats or absorption rate for your community just let me know. If you have any questions about this summary, the attached stats package or any Real Estate questions please feel free to contact us
Want to know what’s really happening in the Calgary Real Estate Market. The market is driven by supply and demand so here we show the inventory (supply) and sales (demand) and the effect on the price of Calgary Real Estate. In summary the Calgary housing market is still entrenched is a Sellers Market with limited supply and strong sales. This month put the market into an even stronger Sellers position.
Below are the details along with a few comments, all numbers were taken from the Calgary Real Estate Boards Stats package for Realtors.
Calgary Listing Inventory: Inventory levels for all single family homes dropped a little while all townhouses and apartment condos remained almost flat this month.
| Inventory |
September 2013 |
October 2013 |
Change |
| Single Family Home |
2789 |
2705 |
-84 |
| Condo Townhouse |
450 |
444 |
-6 |
| Condo Apartment |
683 |
692 |
+9 |
| Total |
3922 |
3841 |
-81 |
Calgary Sales:
Sales in October were almost the same as in September. Traditionally this time of year we start to see sales slowing.
| Sales |
September 2013 |
October 2013 |
Change |
% Change |
| Single Family Home |
1354 |
1336 |
-18 |
-1.3 |
| Condo Townhouse |
245 |
280 |
+35 |
+1.4 |
| Condo Apartment |
324 |
337 |
+13 |
+.04 |
| Total |
1923 |
1953 |
+30 |
+.15 |
Calgary Real Estate Sales Prices:
In October, the benchmark price increased for all categories. As long as our ratio of sales to listings remains the same this trend will continue.
| Sales Prices |
September 2013 Benchmark Price |
October 2013 Benchmark Price |
Change |
| Single Family Homes |
463,700 |
468,000 |
+4,300 |
| Condo Townhouse |
299,100 |
302,200 |
+3,100 |
| Condo Apartment |
272,900 |
276,100 |
+3,200 |
Sales Prices “Year to Date”
Year to date prices have increased in all categories.
| Sales Prices | Dec 31 2012 Benchmark Price |
October 2013 Benchmark Price |
Change |
% Change |
| Single Family Homes |
434,800 |
468,000 |
+33,200 |
+7.6 |
| Condo Townhouse |
284,100 |
302,200 |
+18,100 |
+6.3% |
| Condo Apartment |
248,700 |
276,100 |
+27,400 |
+11.1% |
Absorption Rate Defined: (Months of Inventory) (the inventory divided by the number of sales in the last month). What does this mean you might ask?
|
Buyer’s Market |
>4.0 |
|
Balanced Market |
Between 2.8 to 4.0 |
|
Seller’s Market |
<2.8 |
Absorption Rate: Throughout September our absorption rate decreased in all categories putting the market even more in favour for sellers. Especially in the starter home price range we are starting to see lots of competing offers.
| Absorption Rate |
September 2013 |
October 2013 |
Change |
| Single Family Homes |
2.06 |
2.02 |
-.04 |
| Condo Townhouse |
1.84 |
1.58 |
-.26 |
| Condo Apartment |
2.1 |
2.05 |
-.05 |
| Total Calgary |
2.04 |
1.97 |
-.07 |
**Please note that these numbers do change on a community basis and more so for towns. If you would like to find stats on your community just let me know. If you have any questions about this summary, the attached stats package or any Real Estate questions please feel free to contact us.
Search MLS Listings on our website at www.gordpiper.com or at www.gordpiper.ca
Want to know what’s really happening in the Calgary Real Estate Market. The market is driven by supply and demand so here we show the inventory (supply) and sales (demand) and the effect on the price of Calgary Real Estate. In summary the Calgary housing market is still entrenched is a Sellers Market with limited supply and strong sales. It is important to note that for the first time in more than 6 months the absorption rate increased above 2.0 so we are seeing a slight shift.
Below are the details along with a few comments, all numbers were taken from the Calgary Real Estate Boards Stats package for Realtors.
Calgary Listing Inventory: Inventory levels for all categories remained almost flat this month.
| Inventory |
August 2013 |
September 2013 |
Change |
| Single Family Home |
2791 |
2789 |
-2 |
| Condo Townhouse |
417 |
450 |
33 |
| Condo Apartment |
690 |
683 |
-7 |
| Total |
3898 |
3922 |
24 |
Calgary Sales:
Sales decreased marginally in all categories except townhouses which saw a small increase this month. This is very normal as sales typically start slowing at this time of year. To look at another perspective even though sales slowed this month they were 19% higher than in August 2012.
| Sales |
August 2013 |
September 2013 |
Change |
% Change |
| Single Family Home |
1517 |
1354 |
-163 |
-10.7 |
| Condo Townhouse |
282 |
245 |
37 |
13.6 |
| Condo Apartment |
397 |
324 |
-73 |
-18.4 |
| Total |
2196 |
1923 |
-273 |
-12.4 |
Calgary Real Estate Sales Prices:
In September, the benchmark price stayed almost flat for all categories with apartment condo’s showing the largest increase.
| Sales Prices |
August 2013 Benchmark Price |
September 2013 Benchmark Price |
Change |
| Single Family Homes |
464,700 |
463,700 |
-1,000. |
| Condo Townhouse |
298,500 |
299,100 |
600 |
| Condo Apartment |
270,600 |
272,900 |
2,300 |
Sales Prices “Year to Date”
Year to date prices have increased in all categories.
| Sales Prices | Dec 31 2012 Benchmark Price |
September 2013 Benchmark Price |
Change |
% Change |
| Single Family Homes |
434,800 |
463,700 |
28,900 |
6.65 |
| Condo Townhouse |
284,100 |
299,100 |
15,000 |
5.27 |
| Condo Apartment |
248,700 |
272,900 |
24,200 |
9.73 |
Absorption Rate (Months of Inventory) (the inventory divided by the number of sales in the last month). What does this mean you might ask?
|
Buyer’s Market |
>4.0 |
|
Balanced Market |
Between 2.8 to 4.0 |
|
Seller’s Market |
<2.8 |
Absorption Rate: Throughout September our absorption rate increased in all categories. This could be the start of a shift as this is the first time in several months that the absorption rate has exceeded 2.0. Of course we have a long way to move still to move into a buyers market.
| Absorption Rate |
August 2013 |
September 2013 |
Change |
| Single Family Homes |
1.84 |
2.06 |
.22 |
| Condo Townhouse |
1.47 |
1.84 |
.37 |
| Condo Apartment |
1.74 |
2.1 |
.36 |
| Total Calgary |
1.78 |
2.04 |
.26 |
**Please note that these numbers do change on a community basis and more so for towns. If you would like to find stats on your community just let me know. If you have any questions about this summary, the attached stats package or any Real Estate questions please feel free to contact us.
Interest Rates are on the rise – if you are even considering making a move get to your bank and get a mortgage commitment locked in at today’s rates. It looks like they may even go higher.