What is really happening in the Calgary Real Estate Market?
Following is a graph that shows the months of inventory for each housing sector. Looking at a one-year trendline gives you an indication of where things are really heading. As you can see our months of inventory is heading up.
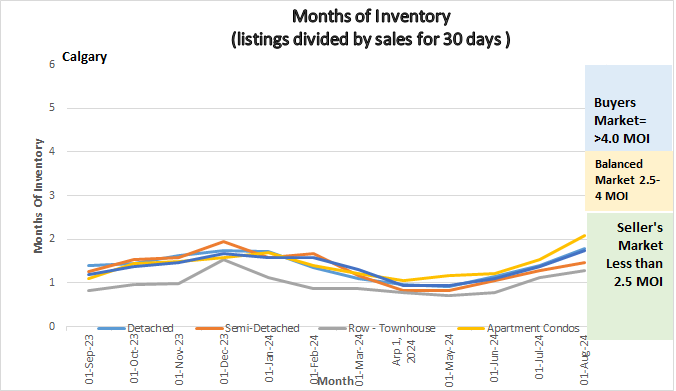
Graph showing Months of Inventory for Calgary Real Estate Market
Gord’s commentary for the month (my opinion).
July 2024 Highlights
Change is here:
- Our Months of Inventory continues to rise. We are still technically in a Sellers Market, but we are trending quickly towards a more balanced market.
- Inventory continues to rise a little each week.
- Overall Benchmark Prices stayed much the same over July.
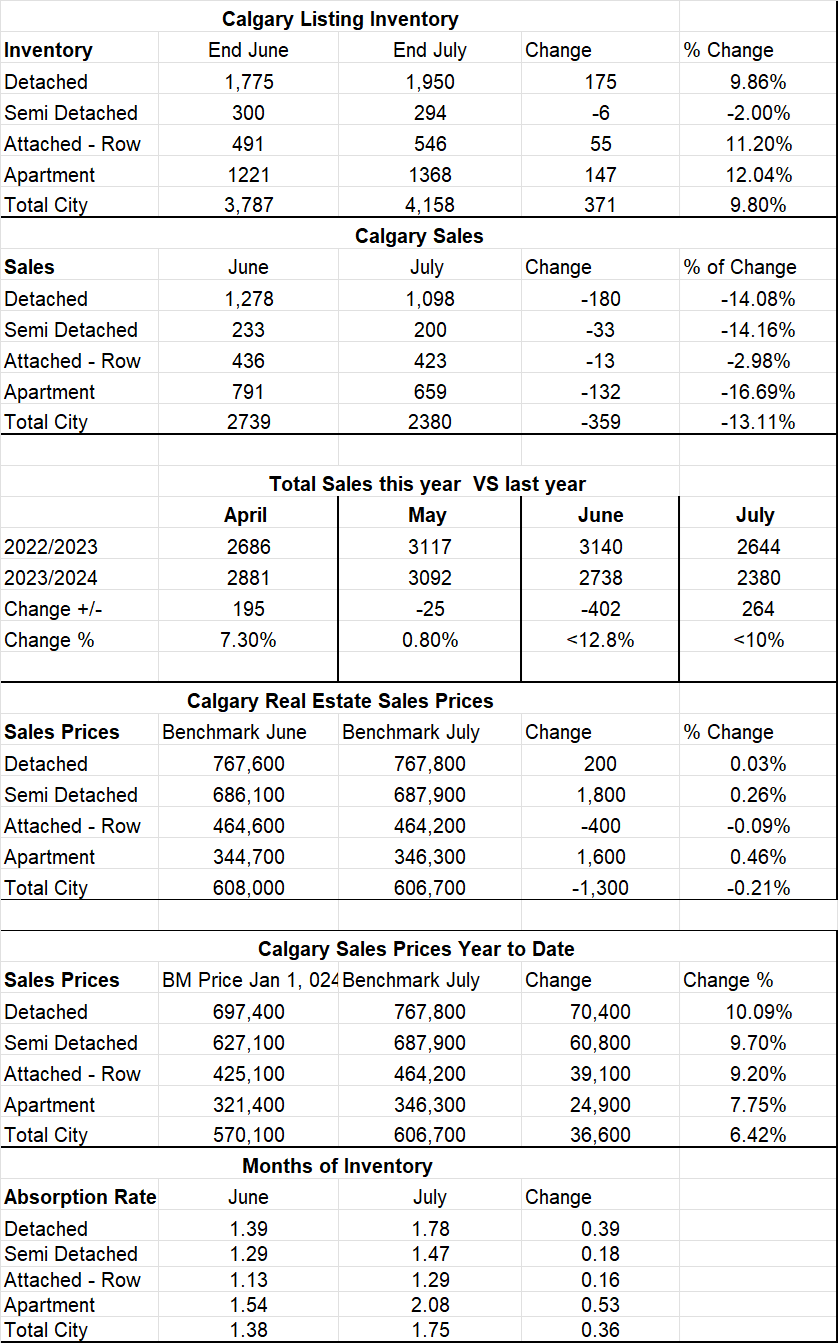
Calgary Listing Inventory
Our listing inventory increased again in July. All sectors increased by between 9.5%-12% except the Semi-Detached sector where the Inventory decreased by 2%.
Calgary Sales:
Sales in July slowed and ended up being 13.11% lower than Junes Sales. Part of this is the normal
trend of sales slowing in the summer due to vacations, but I believe a larger part of it is less buyers
pulling the trigger on a home purchase.
Sales Compared to 2023:
Sales in July compared to 2023 were down 264 sales or 10.0% which tells me the slowdown is not just seasonal.
This is another indication to me that the market is finally starting to slow.
| Jan | Feb | Mar | Apr | May | June | |
| 2023 | 1198 | 1738 | 2135 | 2686 | 3117 | 3140 |
| 2024 | 1650 | 2135 | 2664 | 2881 | 3092 | 2738 |
| Change | +452 | +397 | +529 | +195 | -25 | -402 |
| % Change | 37.7% | 22.8% | 24.8% | 7.3% | – .8% | -12.8% |
| July | Aug | Sept | Oct | Nov | Dec | |
| 2022 | 2644 | |||||
| 2023 | 2380 | |||||
| Change | -264 | |||||
| % Change | <10% |
Calgary Real Estate Benchmark Sales Prices:
The overall Benchmark price declined by a total of $1300. Or .21% so a small change. which is a much smaller increase than what we have been seeing.
Calgary Real Estate Benchmark Year to Date Sales Price: See chart below.
Year to date the entire market has increased by $36,600 or 6.42% which is substantial.
Current Months of Inventory (Absorption Rate): Our Months of Inventory increased in all sectors. The increases were quite substantial compared to what we have seen in the last 8 months. Increases were: Semi-Detached – .18, Detached -.39, Attached Row- .16, Apartment Condos -.36
My Prediction for what is ahead:
I believe the landscape has changed and the market will continue to soften over the next few months. I believe we will get back to a balanced market and prices will stabilize. My gut feel is that we will not get into a buyer’s market soon as Calgary is still seeing vast numbers of people moving here which is likely to keep the market active.
*Below is a summary of numbers in chart form. All numbers are taken from the Calgary Real Estate Boards monthly Stats package.
*All numbers vary by community and price ranges, if you would like stats specifically for your neighbourhood, please contact us.
Calgary Real Estate Boards Stats