What is really happening in the Calgary Real Estate Market?
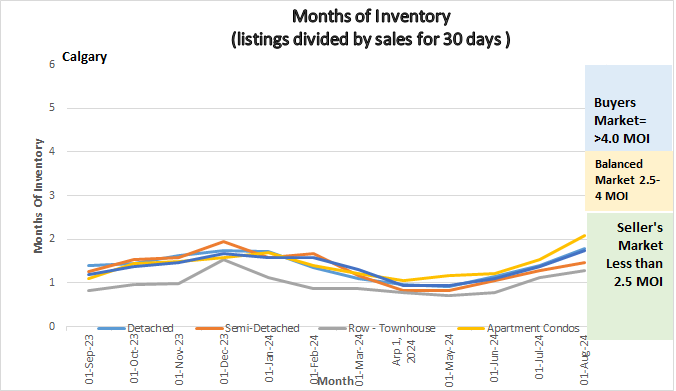
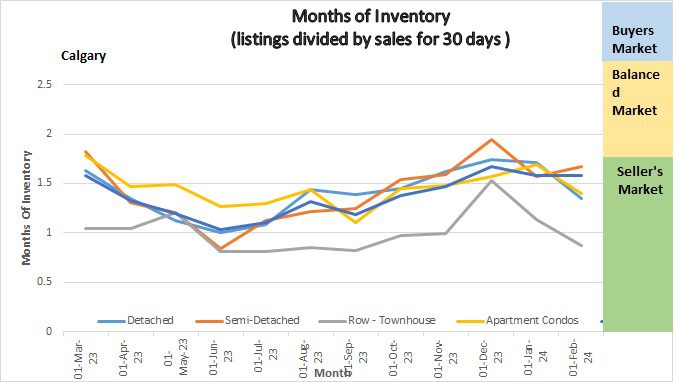
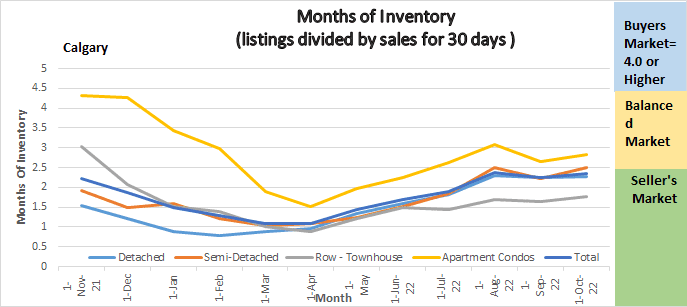
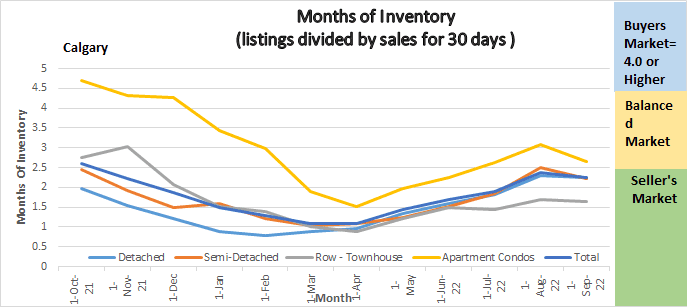
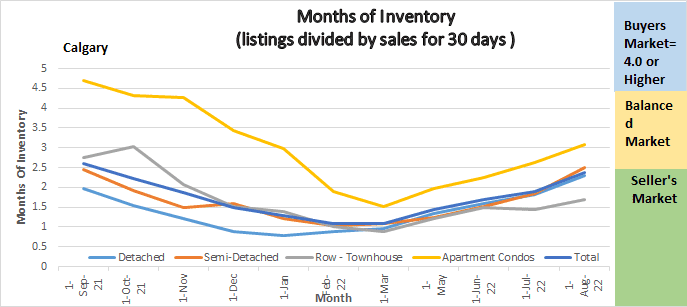
The following graph shows the months of inventory for each housing sector. Looking at a one-year trendline gives you an indication of where things are really heading.
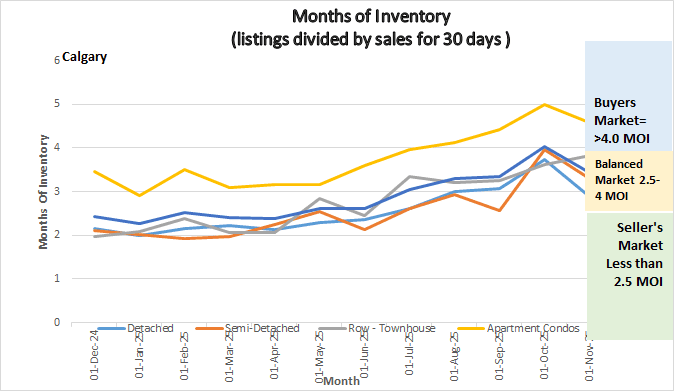
Graph shows the months of inventory for all sectors in the Calgary Real Estate Market
Gord’s commentary for the month (just my opinion).
November 1, 2025, Highlights
Pace of new listings growth slows, preventing further inventory gains. October we saw a decrease in Inventory along with an increase in Sales lowering our Months of Inventory. This is a reverse to our normal trend as normally as we get closer to the new year sales go down.
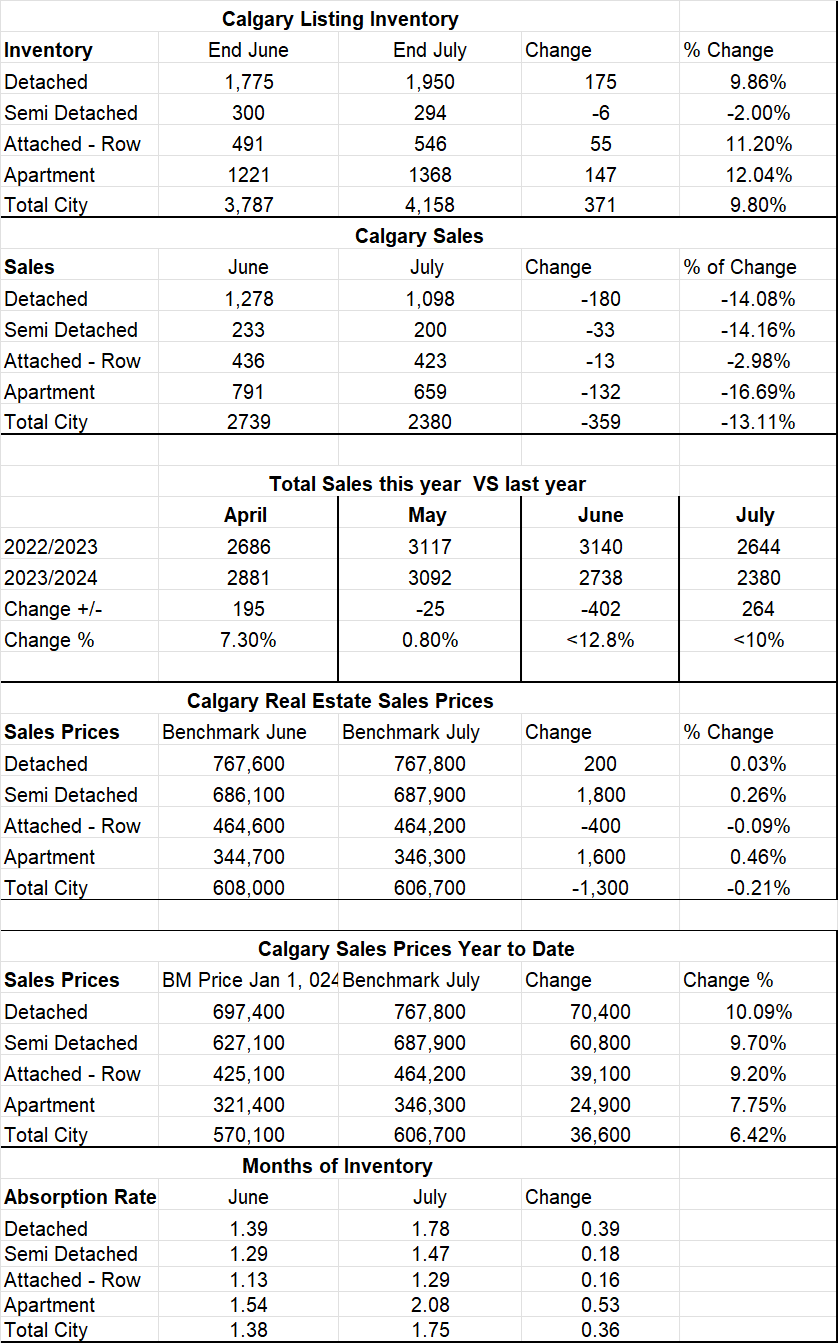
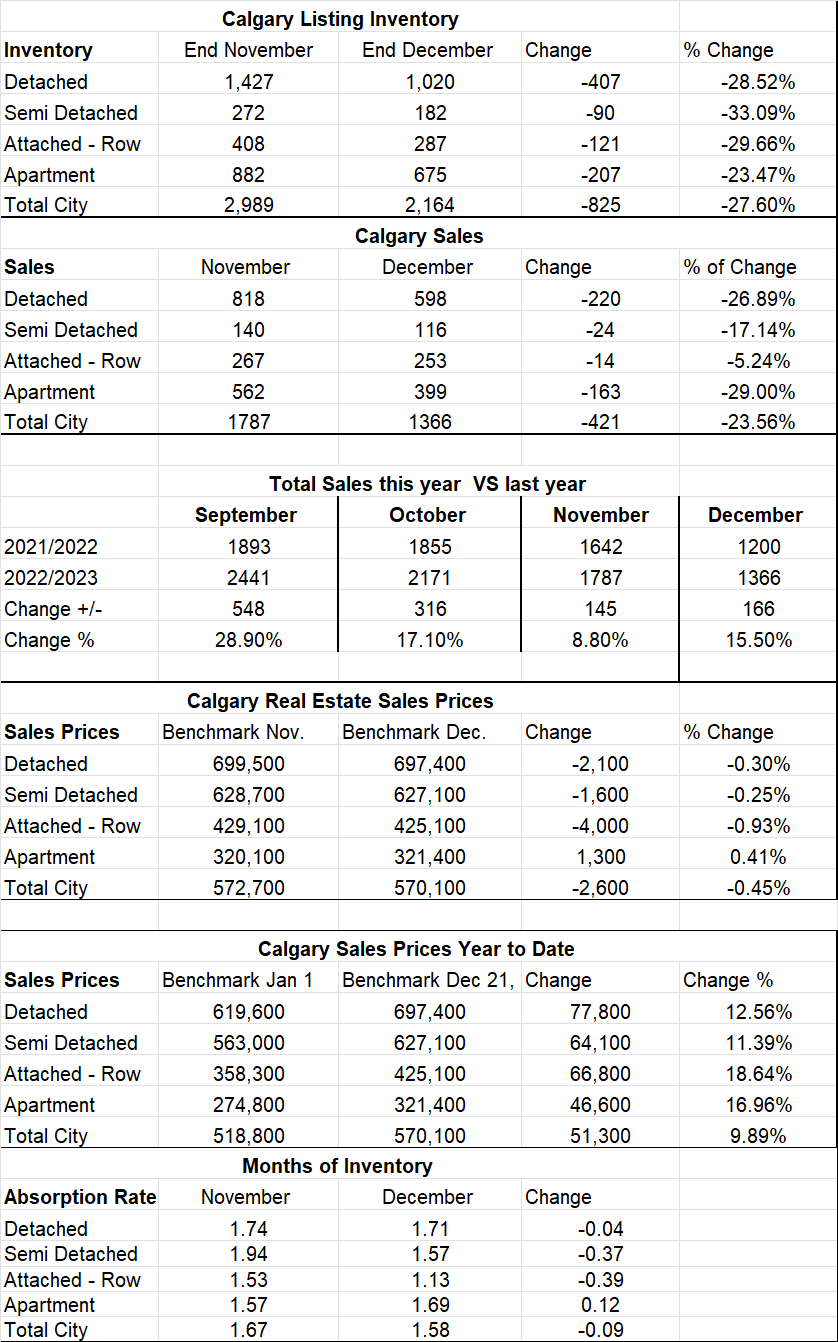
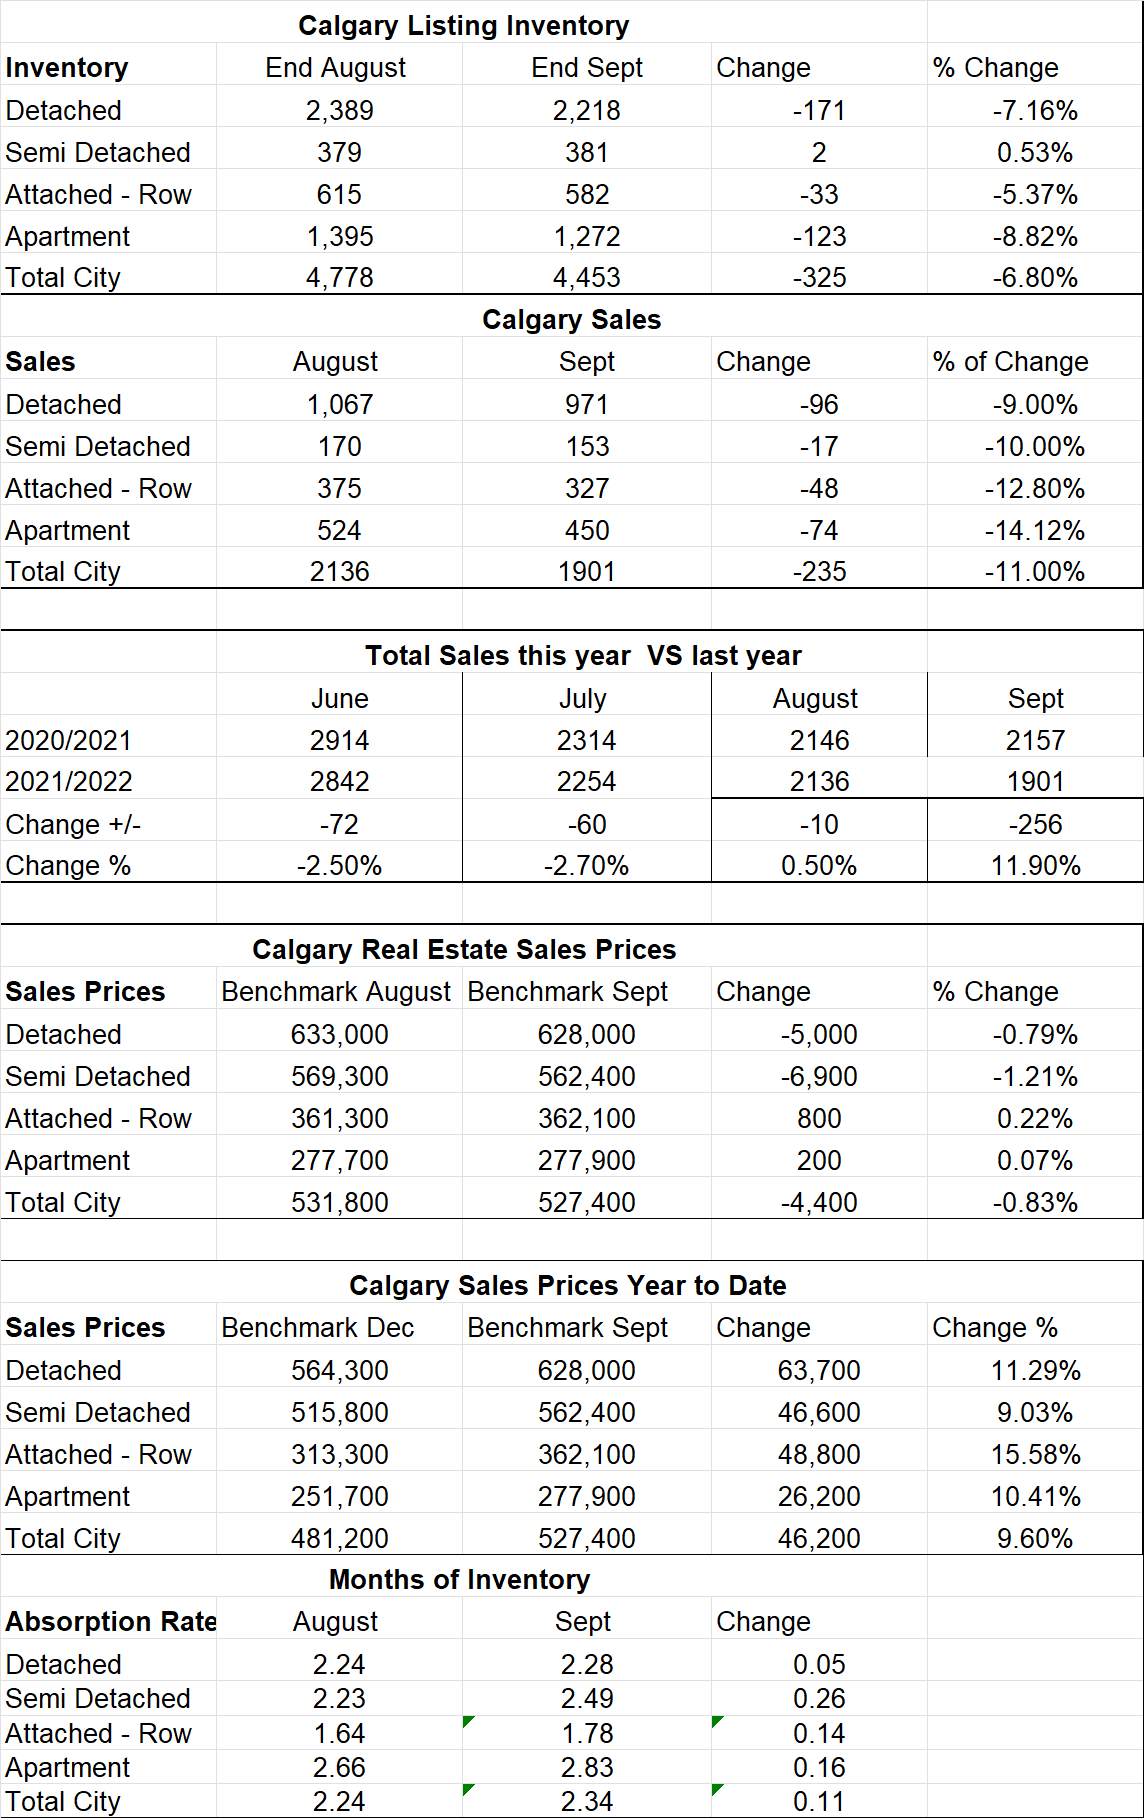
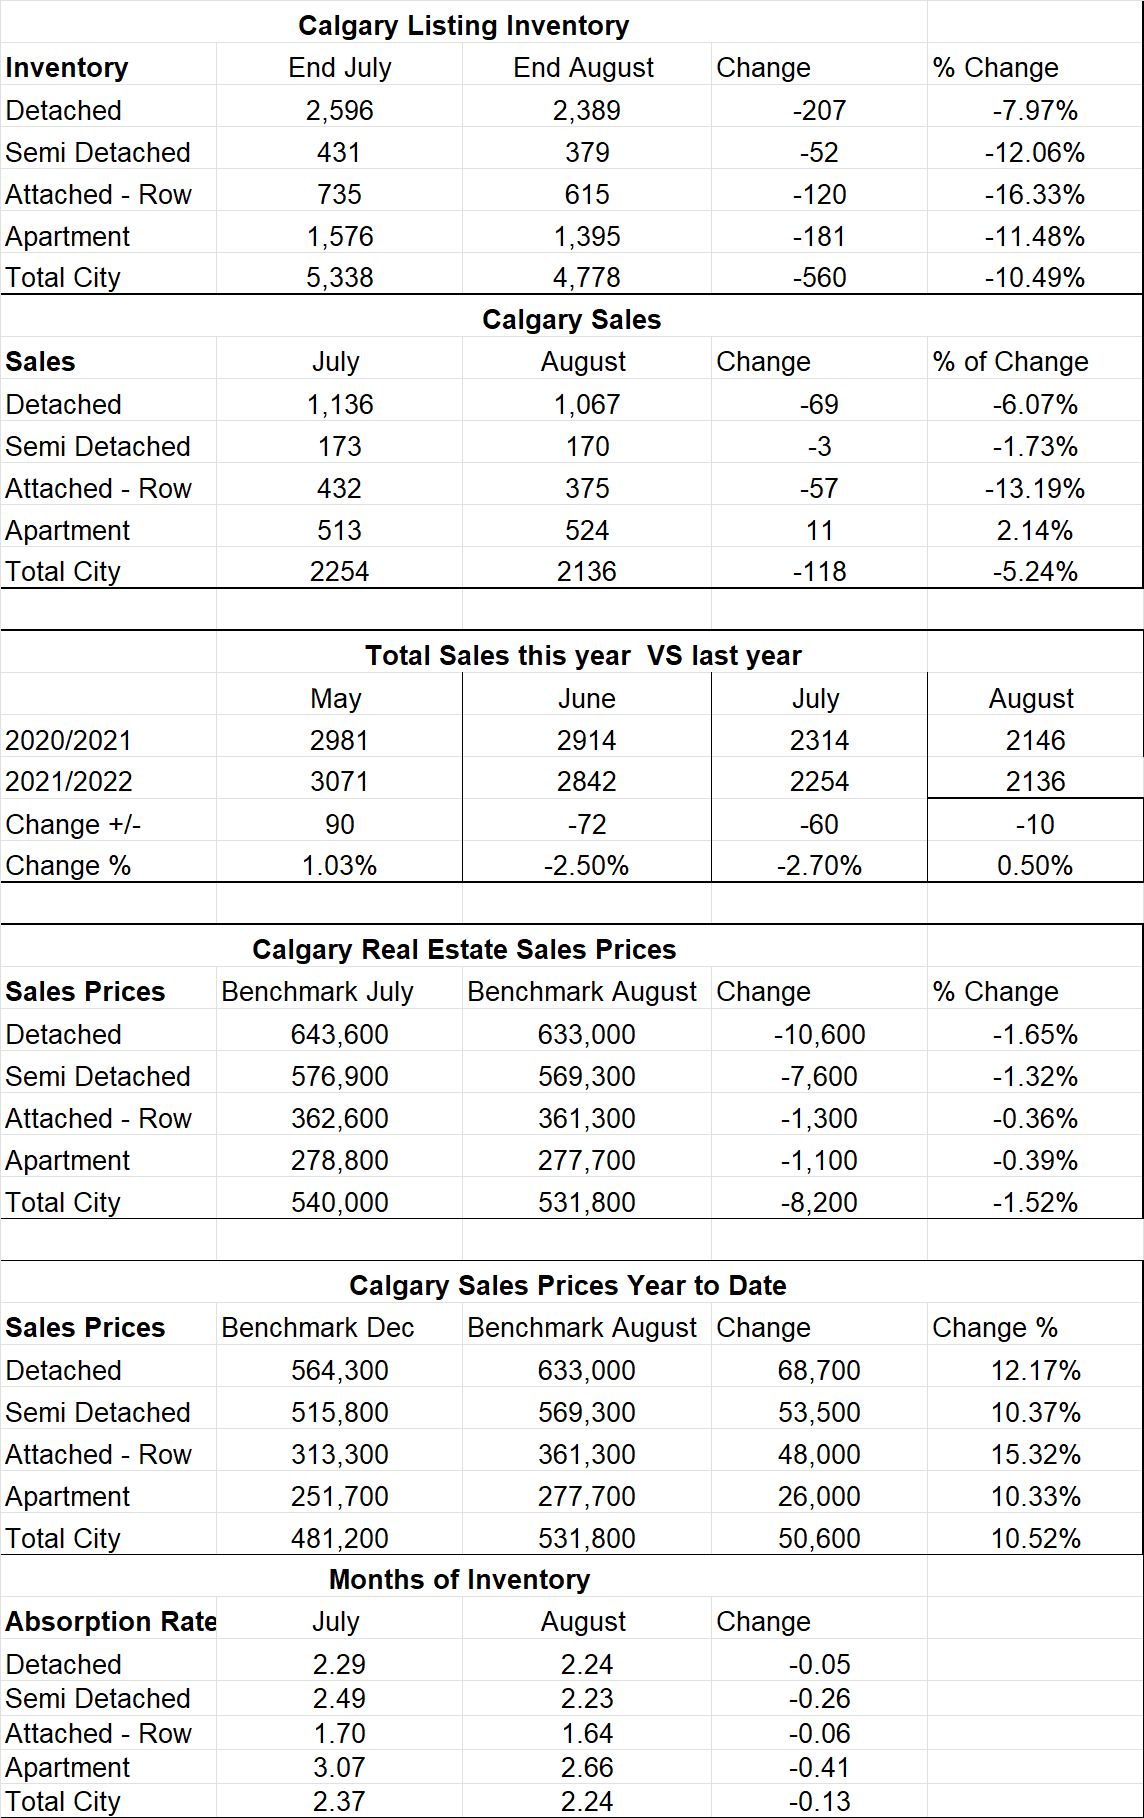
Calgary Listing Inventory
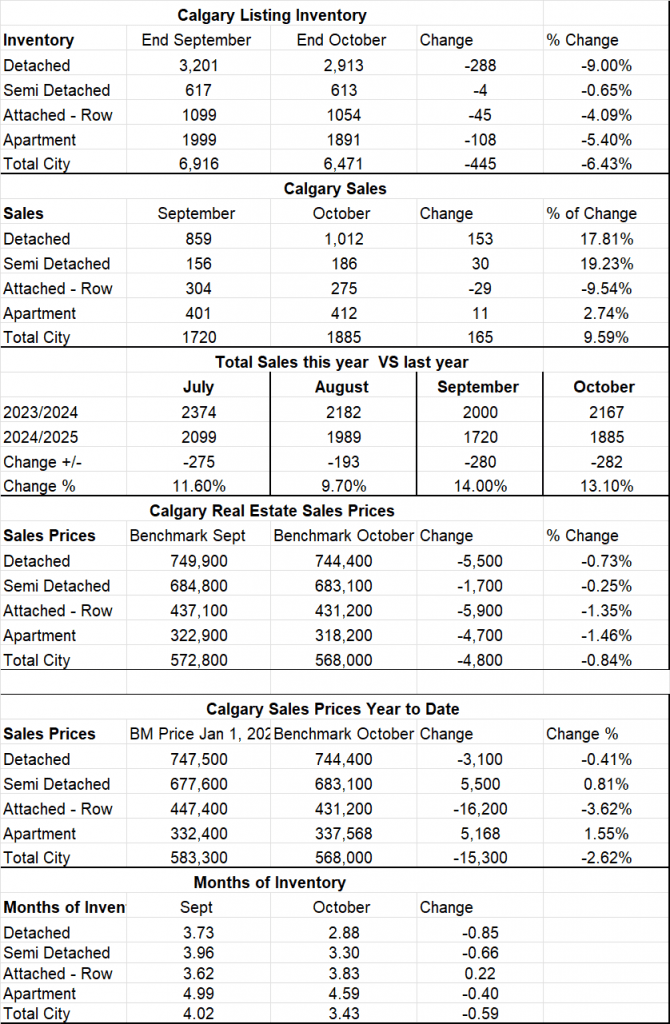
In October, our listing inventory decreased marginally by 6.64% or 445 listings. The largest decrease was in detached homes (9.0%). One important thing to note is that 71% of this decrease was in the last week of the month. Often Realtors set their listings to expire are the end of the month so we might see a very quick rebound if those listings get relisted.
Calgary Sales
For October, our sales increase by 165 sales or 9.59% which is the opposite direction of what normally happens in October and what we were all expecting. I have also personally noticed an increase in the number of Buyer’s I’m assisting. This leads me to believe that some of those people who have been sitting on the sidelines are now making the move so our market may start to change direction again.
Sales Compared to 2024:
September saw a decline in sales from August (14%.). This is higher than the last 3 months of 9.7%, 11.6% showing that the market continues to cool.
| May | June | July | August | Sept | October | |
| 2024 | 3090 | 2374 | 2374 | 2182 | 2000 | 2167 |
| 2025 | 2568 | 2286 | 2099 | 1989 | 1720 | 1885 |
| Change | -522 | 88 | -275 | -193 | -280 | -282 |
| % Change | -16.89 | -.04 | -11.6% | -9.7% | -14. % | -13.1 |
Calgary Real Estate Benchmark Sales Prices:
The overall Benchmark price for August decreased by .84%. The lowest decrease was in the Semi-Detached sector at .25% and the highest price decline was in the Attached Row sector at -1.35%.
Current Months of Inventory (Absorption Rate):
The total months of Inventory as of November 1 decreased by .59 die to lower inventory and higher sales. The only sector that saw and increase in months of inventory was the Attached Row sector and its increase was only .22.
My Prediction for what is ahead:
Although we saw a shift in a lower inventory and increased sales this month, I still believe we will stay in a balanced/buyers’ market for some time until there is a little more certainty in Canada with US Tariffs etc. I do however believe when we get some certainty, we could end up back in a strong Sellers market as there are a lot of people sitting on the fence right now.
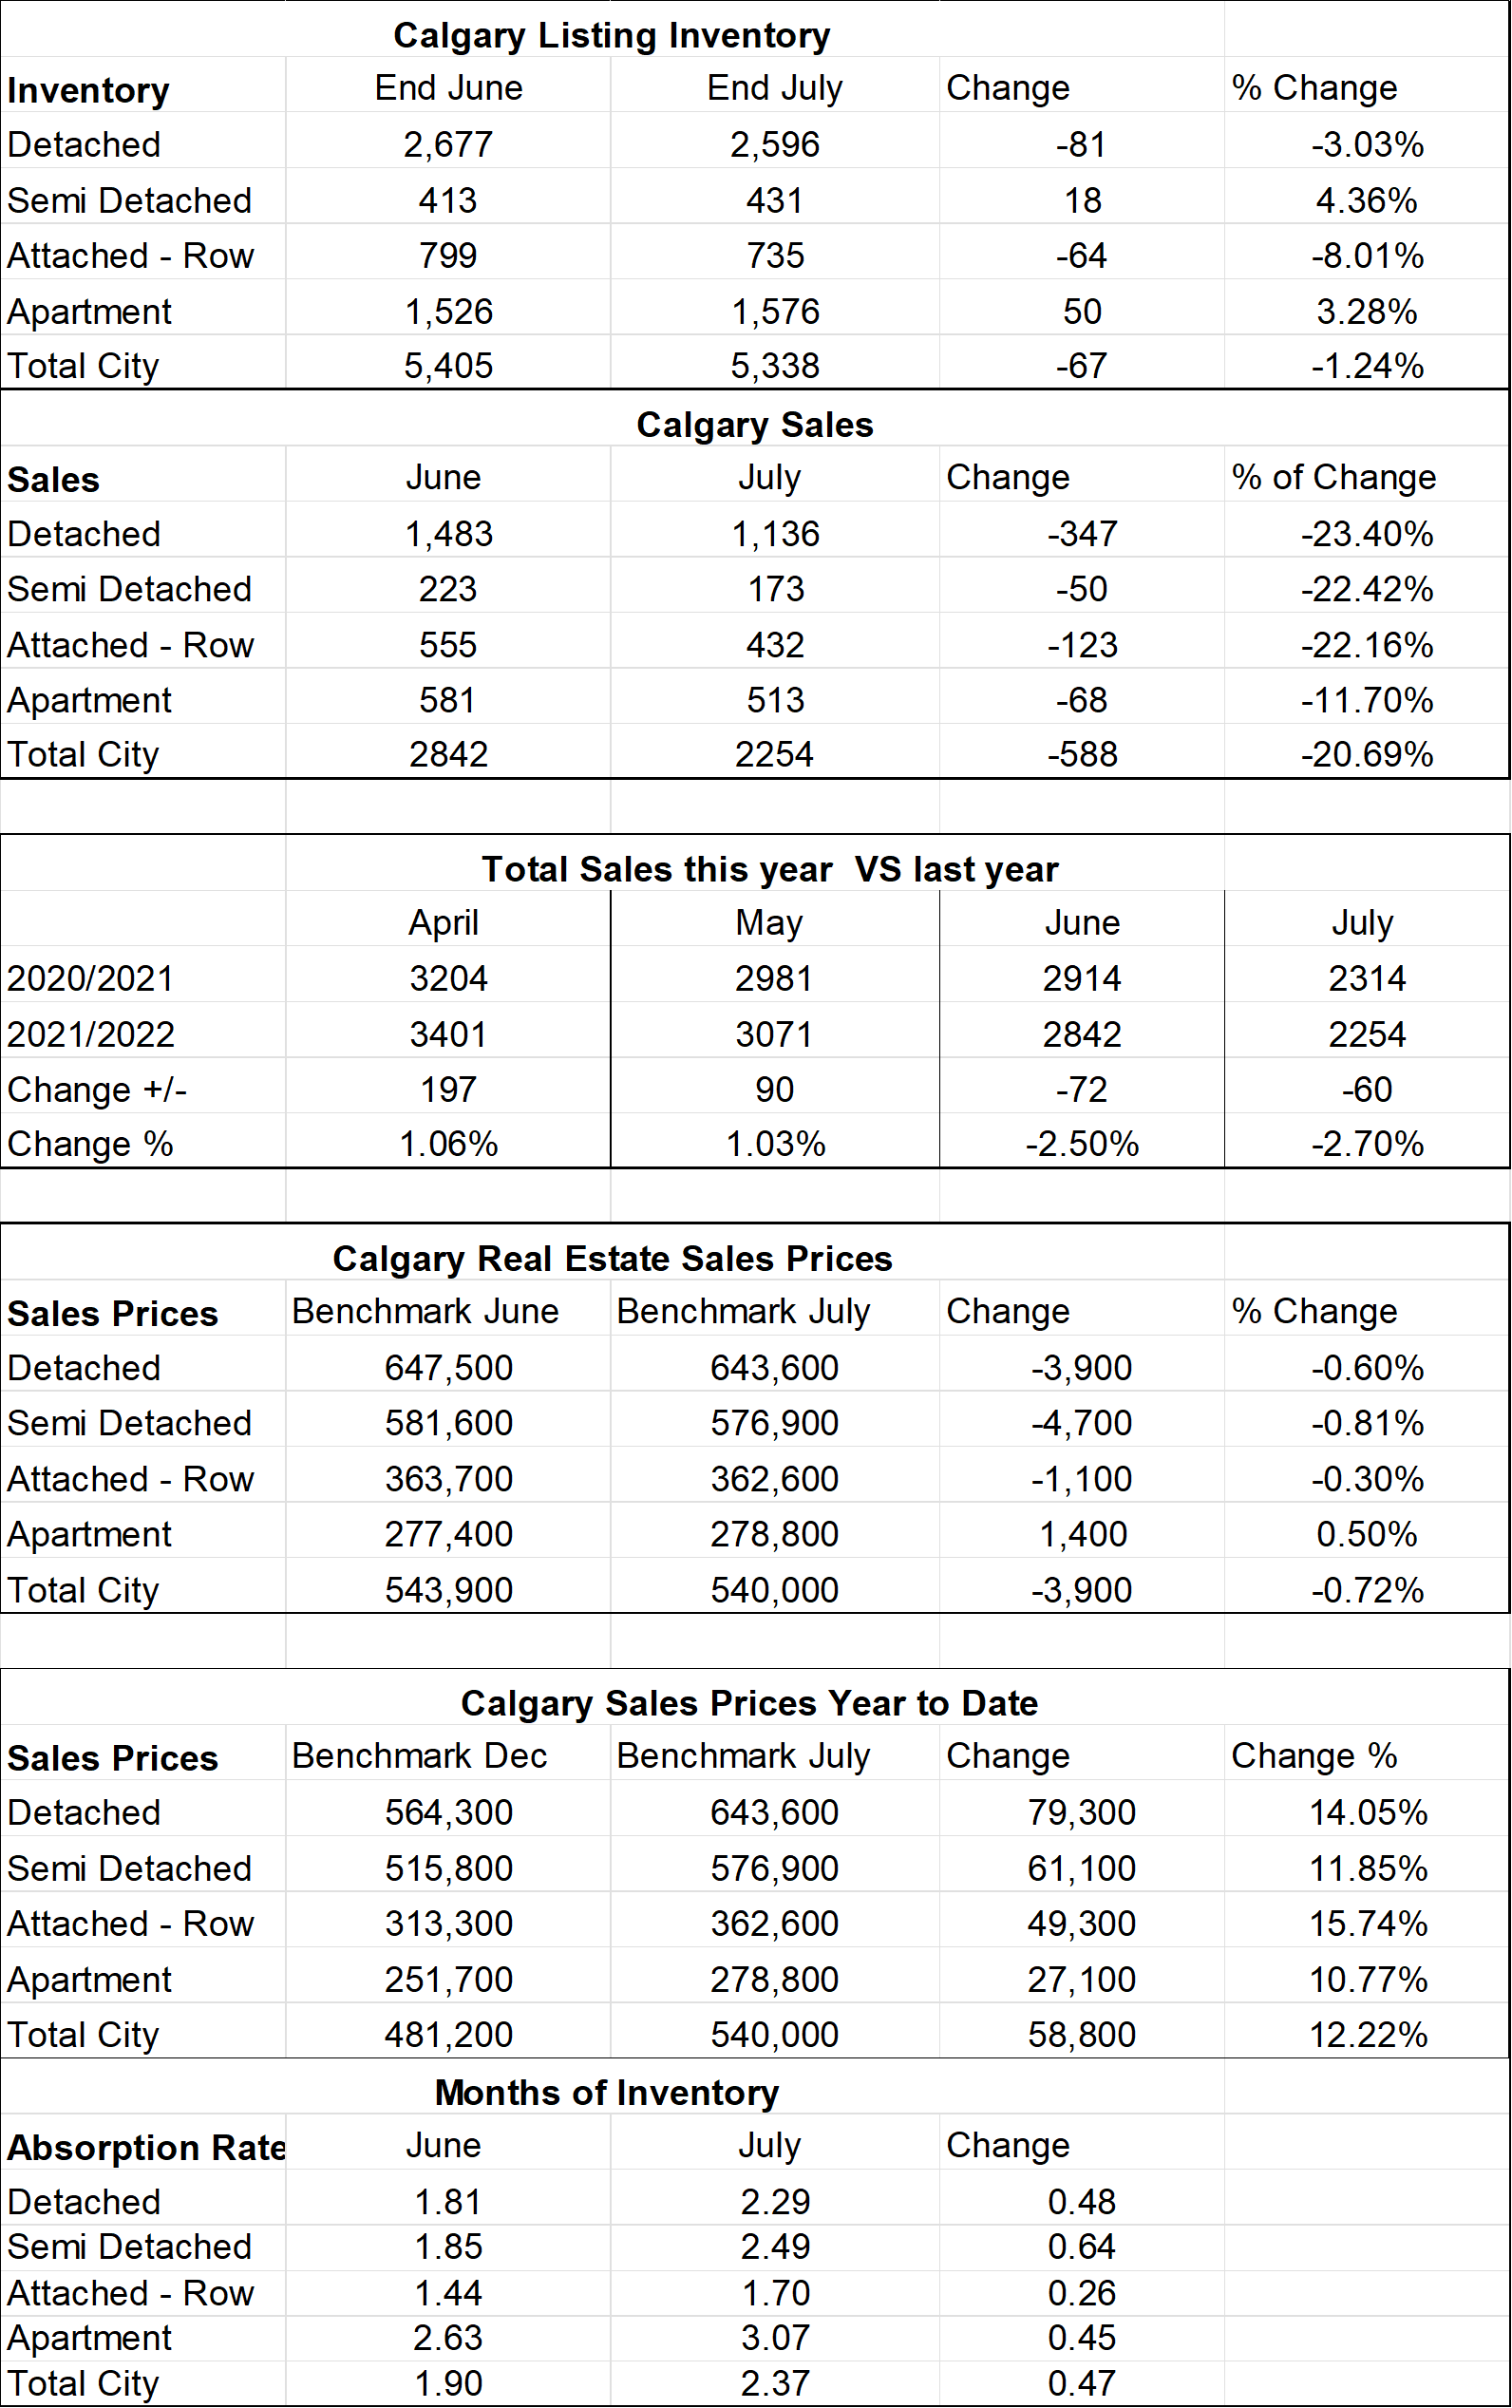
*Below is a summary of numbers in chart form. All numbers are taken from the Calgary Real Estate Boards monthly Stats package.
* All numbers vary by community and price ranges, if you would like stats specifically for your neighbourhood, please contact us.
Graph shows the months of inventory for all sectors in the Calgary Real Estate Market