Posts Tagged ‘June 1’

June 1, 2021 Calgary Real Estate Market Snapshot

Tuesday, June 1st, 2021

What is really happening in the Calgary Real Estate Market?

The market is a result of Supply and Demand therefore we look at both Supply (inventory) and Demand (Sales) and the relationship between the two.  We also update you on the current benchmark price for all housing sectors.

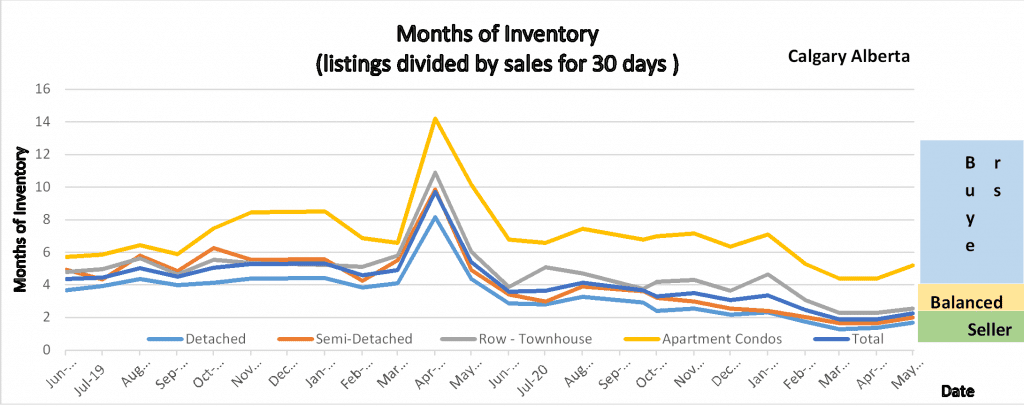
Following is a graph that shows the months of inventory for each housing sector.  Looking at a 2-year trendline gives you an indication of where things are really heading.

2 year trend – Months of Inventory


Gord’s commentary for the month (just my opinion).

Another huge month for Calgary Real Estate although Change is on the way again.

“Buyers Beware” The booming market has already brought out sellers who are fishing for huge dollars, yes there are more than a normal number of homes listed substantially above what the market will bear.


Calgary Listing Inventory

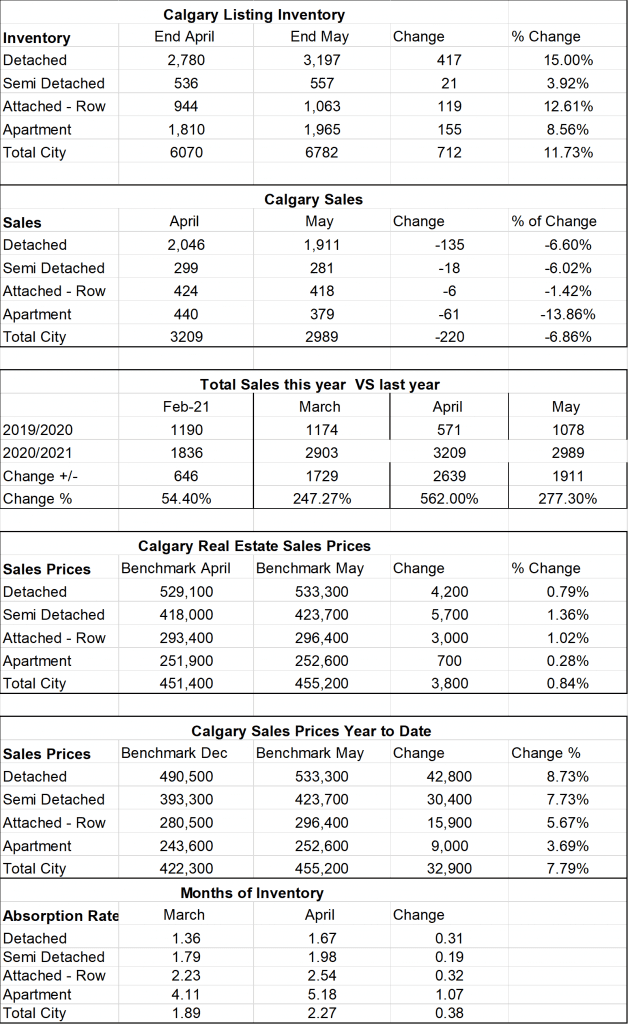
Listing inventory in Calgary increased in every sector with the largest increase in the Detached Sector at 15%.  The lowest increase was in Semi-Detached homes at 3.92. The overall market increased by 11.73%

Calgary Sales:

Sales in all sectors are booming although we are seeing signs of a slight slowdown across all sectors. The largest decrease was in Apartment condos at 13.86% decline, the lowest decline in sales was Attached-Row homes at 1.42% Overall decline in sales was 6.86% from April highs.

I do not for a minute believe the demand has gone down, what I believe is causing the decline is the availability of homes.

 Sales Compared to 2020:

Normally this is a good category to watch however we are now comparing sales this year to when we were

in a collapsed market due to Covid and the First Shutdown.


  Jan Feb Mar Apr May June
2020 861 1190 1175 573 1080
2021 1208 1836 2903 3209 2989
Change +347 +646 +1729 +2639 1,911
% Change +7.49 +54.4 247% +562% 277.3%


  July Aug Sept Oct Nov Dec
2020 1835 80 1702 1764 1437 1199
2021            
Change            
% Change            


 Calgary Real Estate Benchmark Sales Prices:

Overall, the benchmark price in Calgary increased again in May by $3,800.

The largest gain was in Semi-Detached at $5,700 Detached homes at $4,200, Attached Row at $3,000, and Apartment Condos at $700.


Current Months of Inventory (Absorption Rate): 

With the increases in inventory and the reduction in sales our Months of Inventory is starting to rise again.  Still positioned in a Seller’s market are Detached and Semi-Detached homes.  Attached Row homes just came out of the seller’s market to a balanced market position.  Apartment condos are still sitting at 5.18 Months of inventory so very much in a buyer’s market.

It is also important to note that these numbers vary by community, and by price range.  If you would like numbers for your community, or more specific numbers for your home please contact us.

Below is a summary of numbers in chart form.  All numbers are taken from the Calgary Real Estate Boards monthly Stats package.
 

Data taken from the Calgary Real Estate Boards Monthly Stats Package.

Calgary Real Estate Market -June 1, 2018

Saturday, June 2nd, 2018

What is really happening in the Calgary Real Estate Market? 

What is really happening in the Calgary Real estate Market

What is really happening in the Calgary Real estate Market

What is really happening in the Calgary Real Estate Market?

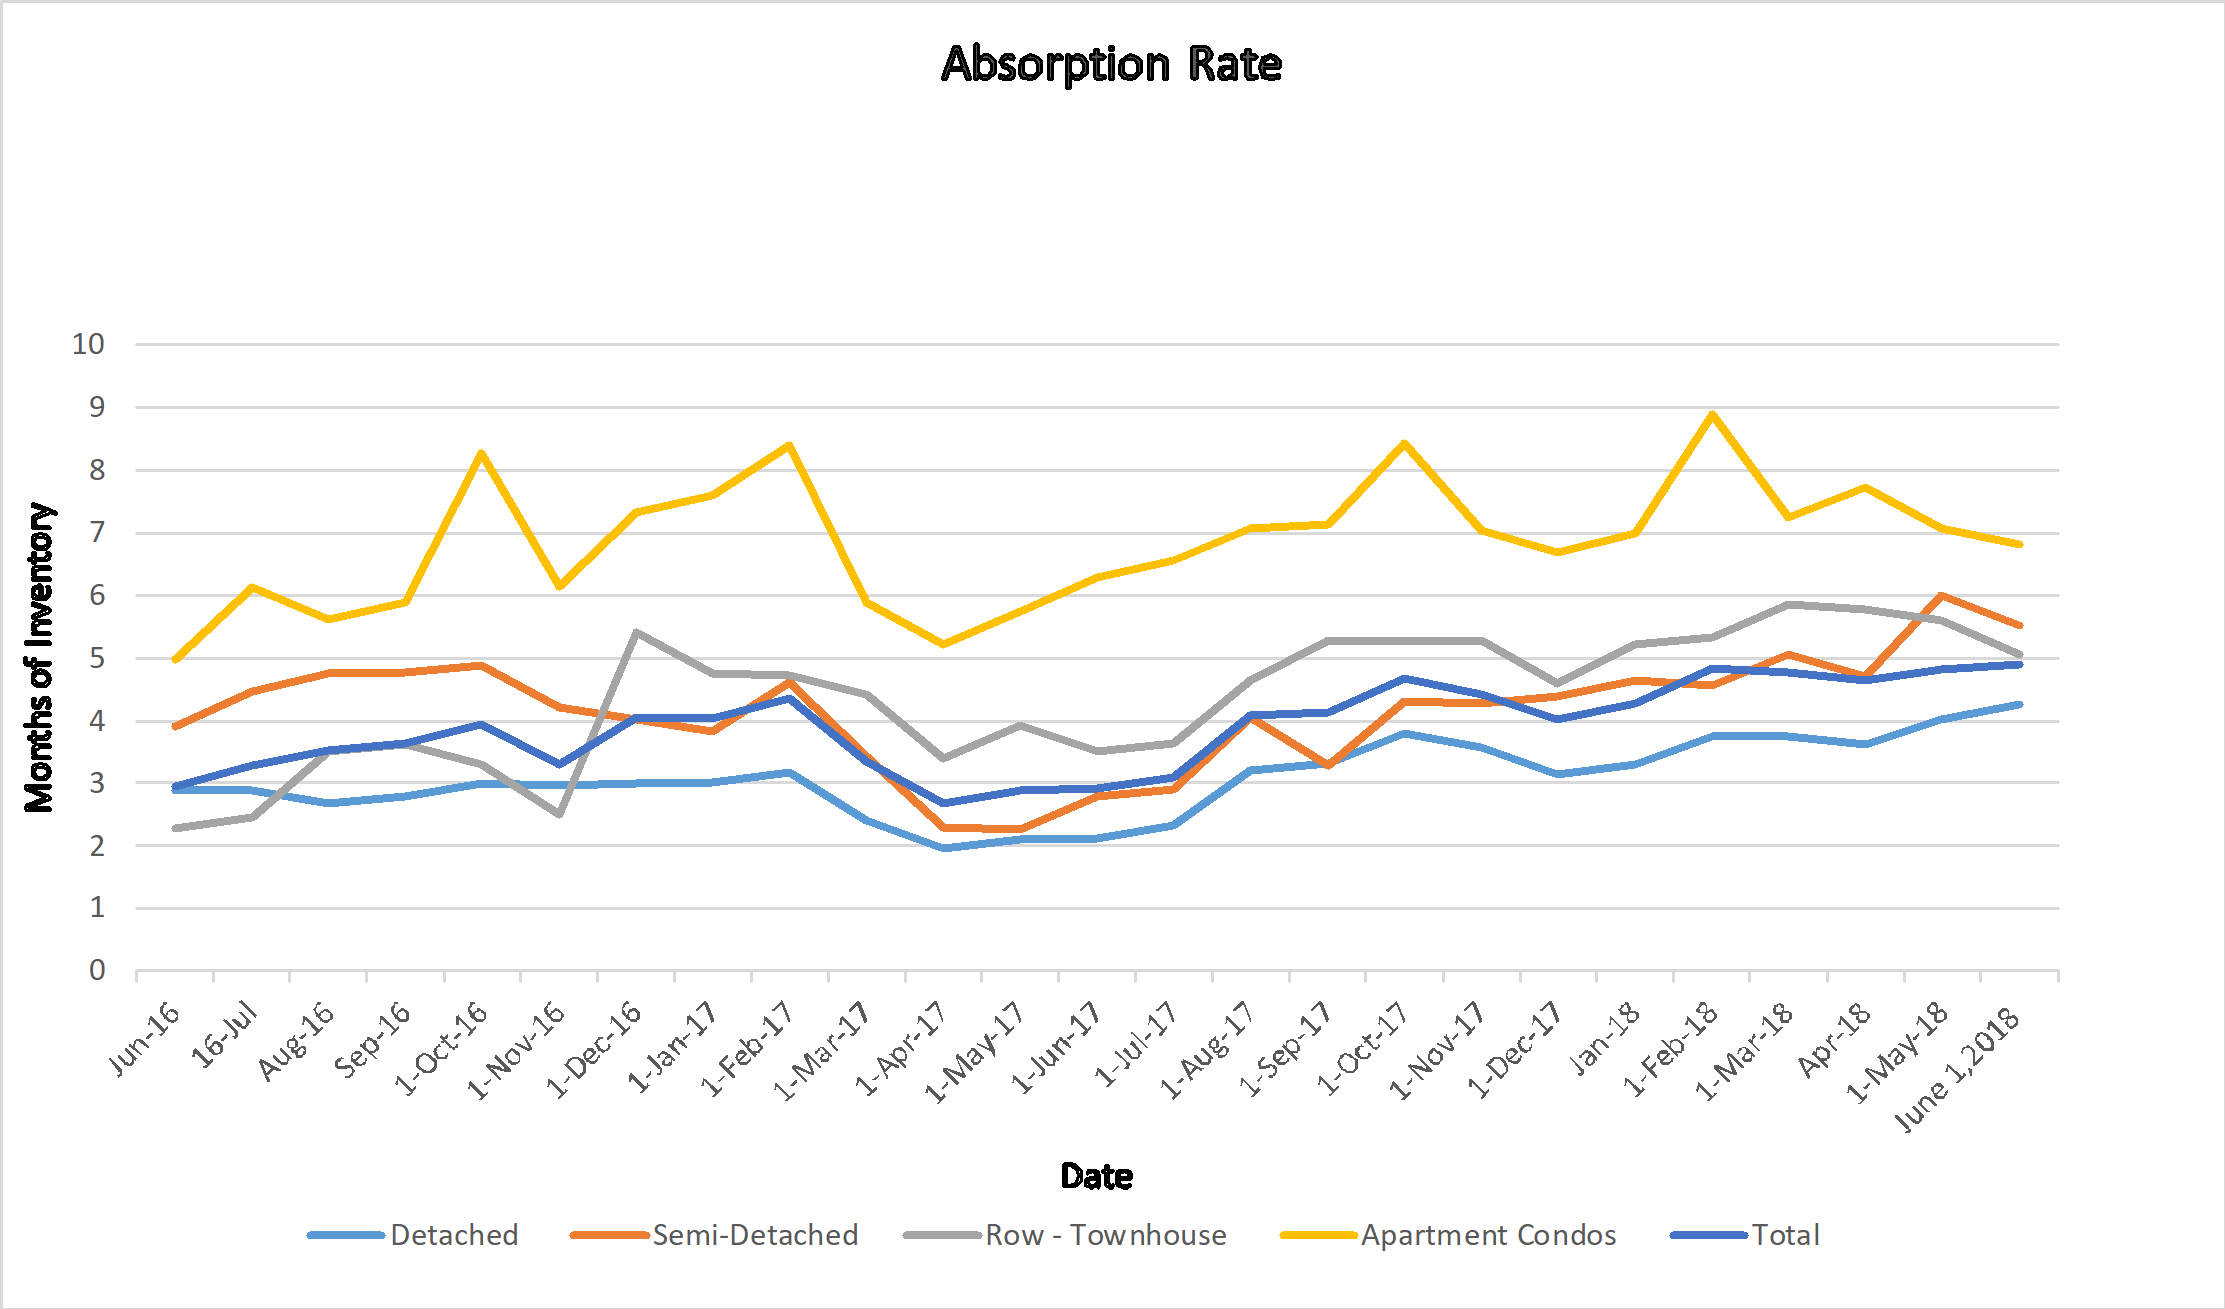
Stay ahead of everyone else by following our Monthly Market Snapshot of the Calgary Real Estate Market. This shows what’s really happening! The market is driven by supply and demand so here we show the inventory (supply) and sales (demand) and most importantly the relationship between the two and how it affects the price of Calgary Real Estate.  A simple way to keep up to date with how the market is trending and to stay ahead of most! All numbers are taken from the Calgary Real Estate Boards Stats package for Realtors. I have also included some general comments which are simply my opinion.

Absorption Rate (Months of Inventory) – the inventory divided by the number of sales in the last month). What does this mean you might ask?

Buyer’s Market >4.0 Drives prices down
Balanced Market Between 2.4 to 4.0 Prices typically remain stable
Seller’s Market <2.4 Drives prices up


Current Absorption Rate

No major fluctuations here this month.  Detached homes went up a little while all other categories went down between .25 and .54

End of Apr 2018    May 2018    Change
Detached 4.01 4.26 0.25
Semi Detached 6.00 5.53 -0.47
Attached – Row 5.60 5.06 -0.54
Apartment 7.06 6.81 -0.25
Total City 4.82 4.90 0.07


 Calgary Listing Inventory

In April, our inventory increased in all Sectors. This is totally expected at this time of year and we should expect this trend to continue for another month anyways.

Inventory Apr 2018    May 2018    Change
Detached 3642 4504 862
Semi Detached 756 862 106
Attached – Row 1075 1163 88
Apartment 1851 1921 70
Total City 7324 8450 1126


Calgary Sales:

The good news is that sales are up from last month in all categories.  Looking at the bigger picture we are still substantially down from last year’s  sales.  May showed 18.4% less sales than May 2017.   This however is an improvement as April sales were down 20.3% from last April.

Calgary Sales  Apr 2018    May 2018    Change % Change
Detached 908 1058 150 16.52%
Semi Detached 126 156 30 23.81%
Attached – Row 192 230 38 19.79%
Apartment 262 282 20 7.63%
Total City 1518 1726 208 13.70%


Calgary Real Estate Sales Prices:

Prices in April showed very little change.  Attached-Row houses showed the largest gain of $3,200. while Semi-Detached homes showed the largest decrease of $1,000.

  Sales Prices Apr 2018   Benchmark Price   May 2018   Benchmark Price Change
Detached 504,500 504,500 0
Semi Detached 420,000 419,000 -1,000
Attached – Row 300,000 303,200 3,200
Apartment 256,700 256,200 -500
Total City 436,500 436,900 400


Sales Prices “Year to Date”  

Same as monthly number

Sales Prices Jan 1, 2018    Benchmark Price  May 2018   Benchmark Price Change

$

% Change
Detached 499,600 504,500 4,900 0.98%
Semi Detached 416,600 419,000 2,400 0.58%
Attached – Row 299,500 303,200 3,700 1.24%
Apartment 257,700 256,200 -1,500 -0.58%
Total City 433,200 436,900 3,700 0.85%


**Please note that these numbers include only Calgary homes and do change on a community basis and more so for towns.  This report does not include rural properties.  If you would like to find stats on your community just let me know.  If you have any questions about this summary or about Real Estate in general, please feel free to contact us.