What is really happening in the Calgary Real Estate Market?
Following is a graph that shows the months of inventory for each housing sector. Looking at a one-year trendline gives you an indication of where things are really heading.
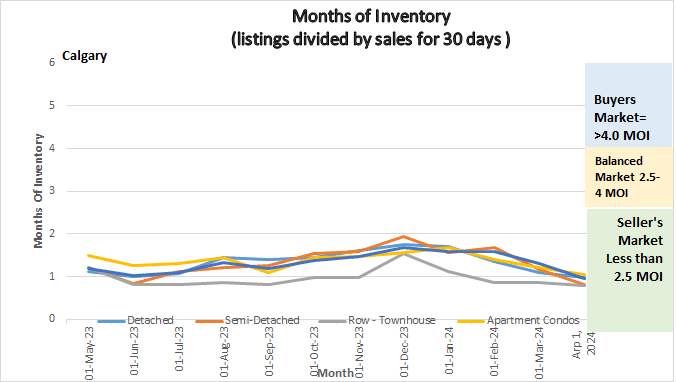
Graph showing Months of Inventory for Calgary Real Estate Market
Gord’s commentary for the month (just my opinion).
March 2024 Highlights
A booming start to 2024!
- Inventory increased but only marginally.
- Sales Increased 10% over last year and are much higher than long term trends
- Prices increased again!
- Seller’s market continues….
Calgary Listing Inventory
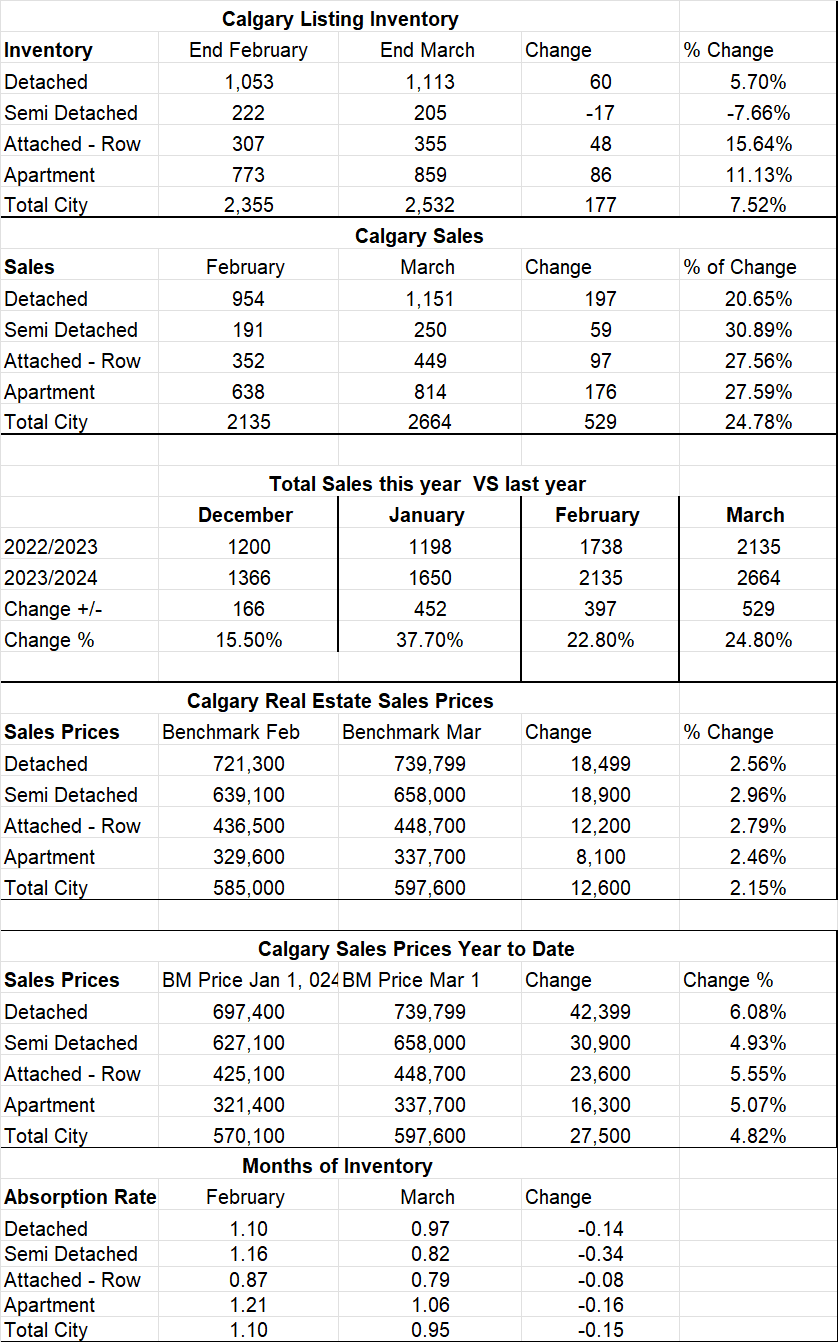
Our listing inventory increased in March but only by 177 listings across all sectors. The only sector the inventory decreased was in the Semi- Detached sector and that was by only 17 listings.
Calgary Sales:
Sales increased by 529 over last month. While it is normal to see sales increase in March over February this is a significant increase. I attribute this to new listings picking up in March.
Sales Compared to 2023:
Sales in March were 529 (or24.8%) over March of last year. I attribute this to new listings picking up a bit. Demand in Calgary is still substantially higher than supply.
| Jan | Feb | Mar | Apr | May | June | |
| 2023 | 1198 | 1738 | 2135 | |||
| 2024 | 1650 | 2135 | 2664 | |||
| Change | +452 | +397 | +529 | |||
| % Change | 37.7% | 22.8% | 24.8% |
| July | Aug | Sept | Oct | Nov | Dec | |
| 2022 | 2249 | 2133 | 1893 | 1855 | 1642 | 1200 |
| 2023 | 2647 | 2729 | 2441 | 2171 | 1787 | 1366 |
| Change | +398 | +596 | +548 | 316 | +145 | +166 |
| % Change | +17.7% | 27.9% | +28.9% | +17.1% | 8.8% | 15.5% |
Calgary Real Estate Benchmark Sales Prices:
The overall Benchmark price increased by another $12,600 or 2.15%. Increases were evenly distributed between all sectors except Apartment Condos which only saw an increase of $8,100 or 2.46%.
Calgary Real Estate Benchmark Year to Date Sales Price: See chart below.
Year to date the entire market has increases by $27,500 or 4.82% which is substantial.
Current Months of Inventory (Absorption Rate): Our Months of Inventory declined again, this month by .15 putting us into an even deeper Sellers Market. No sectors increased this month. Keep in mind that anything below 2.5 is in a seller’s market position so we are deep in Seller’s market territory and prices will continue to rise.
My Prediction for what is ahead: Anything below 2.5 months of Inventory is in a seller’s market position so at .95 months of inventory we are deep in Seller’s market and prices will continue to rise. On the street I am seeing more offers on listings and the amount over list price appears to be rising.
*Below is a summary of numbers in chart form. All numbers are taken from the Calgary Real Estate Boards monthly Stats package.
See Calgary Real Estate Stats Below
Calgary Real Estate Board Stats