Archive for August, 2022
Legal and Illegal Basement Suites in Calgary
Friday, August 19th, 2022Calgary Real Estate Market Snapshot, Aug 1, 2022
Tuesday, August 2nd, 2022What is really happening in the Calgary Real Estate Market?
PS: The sky is not falling!
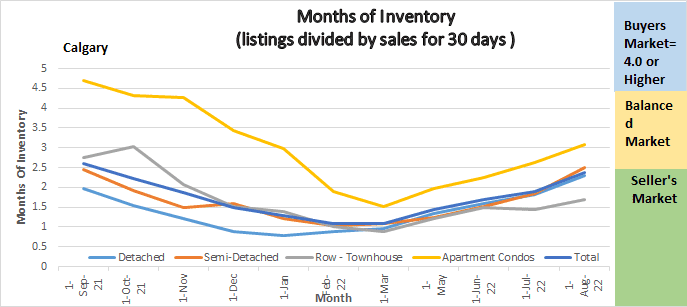
Following is a graph that shows the months of inventory for each housing sector. Looking at a one year trendline gives you an indication of where things are really heading.
Gord’s commentary for the month (just my opinion).
July 2022 Highlights
- The sky is not falling
- We are seeing a decrease in Inventory and a slight decrease in sales.
- Overall market is still in a Sellers Market position
- Overall, we saw a marginal decrease in prices.
Calgary Listing Inventory
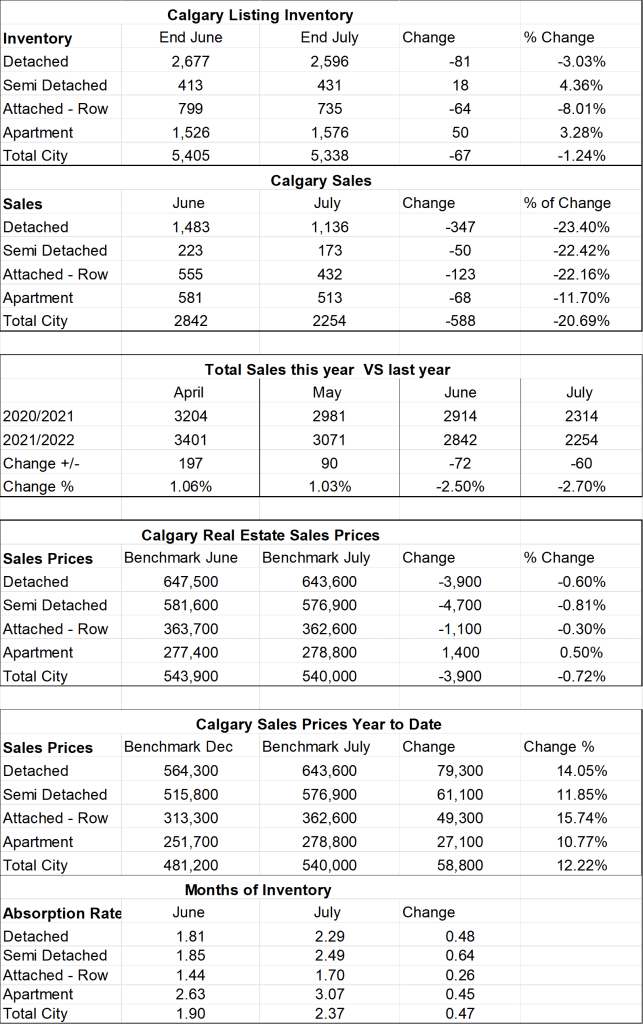
Listing inventory increased in all Semi-detached and Apartment sectors while Detached homes and Row homes saw a decrease in inventory. Overall inventory is 67 listings less than last month. Typically in July we see inventories start to rise.
Calgary Sales:
All sectors saw a decrease in Sales in July. Overall sales in July were 2254 down from 2842 in June. Seeing sales decrease in July is what we would typically expect for July. People are focused on summer and vacations. We will likely see this trend until the end of the year.
Sales Compared to 2021:
Calgary home sales for July were just slightly lower than July of 2021. July sales this year were down by 60 over 2021 or 2.7%. This is telling me that our reduced sales are more seasonal and less to do with higher interest rates.
| Jan | Feb | Mar | Apr | May | June | July | |
| 2021 | 1207 | 1831 | 2903 | 3204 | 2981 | 2914 | 2314 |
| 2022 | 2009 | 3305 | 4107 | 3401 | 3071 | 2842 | 2254 |
| Change | + 802 | 1474 | +1204 | +197 | 90 | -72 | -60 |
| % Change | + 66.4% | +180.5% | +141.5% | +1.06 | +1.03% | 2.5% | 2.7% |
| Aug | Sept | Oct | Nov | Dec | |
| 2020 | 1574 | 1702 | 1763 | 1438 | 1199 |
| 2021 | 2151 | 2162 | 2186 | 2110 | 1737 |
| Change | +577 | +456 | + 423 | +672 | +538 |
| % Change | 136.6% | 126.7% | 123.9% | 146.7% | 144.9% |
Calgary Real Estate Benchmark Sales Prices:
The benchmark price for all sectors combined decreased by $3900 for the month.
It is interesting that even though we are technically in a seller’s market we are seeing price decreases. In my opinion this is being driven by the national media stating housing is falling and therefore buyers are acting cautiously and acting like it is a buyer’s market.
Calgary Real Estate Benchmark Year to Date Sales Price: See chart below.
Year to date all sectors have seen substantial increases with the highest increases being in the detached sector. See chart below for details.
Current Months of Inventory (Absorption Rate):
The months of inventory continues to increase at a slow rate. Over all sectors, the months of Inventory increased by .47 so twice as fast as in June. We are still in a sellers market position in the Detached, Semi-detached and the Attached Row sectors while the Apartment Condo sector has now moved into balanced market territory.
What might the last half of 2022 bring: (again just my opinion)
Based on what I am seeing we are on our way towards a more balanced market. As noted above apartment condos have already entered balanced territory. If we keep up at the same pace, we will move into an overall balanced market by mid September. What is interesting is this is after mortgage rates went up which seems to be having little affect on the market so far. Time will tell, but Alberta’s economy seems to be doing much better and lots of people are moving to Calgary which may keep our market relatively strong compared to other parts of Canada.
Below is a summary of numbers in chart form. All numbers are taken from the Calgary Real Estate Boards monthly Stats package.
If you would like to find out how the Market is fairing in your community please contact us.

