What is really happening in the Calgary Real Estate Market?
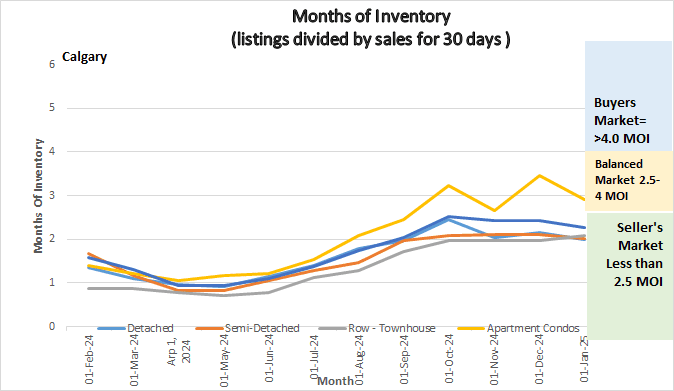
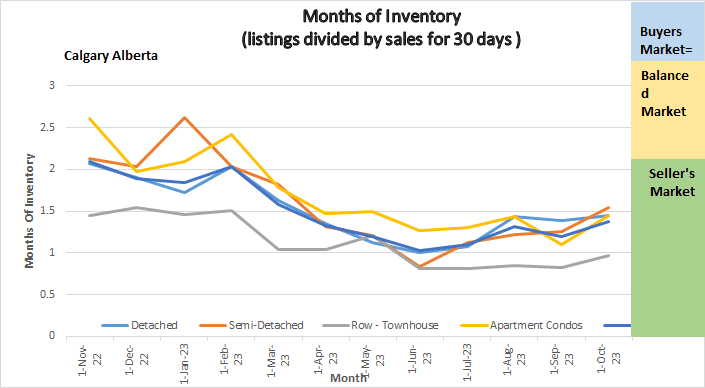
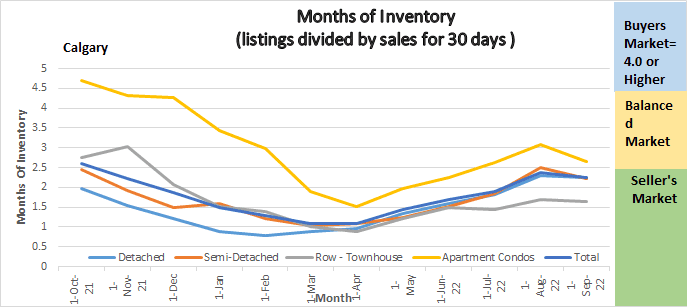
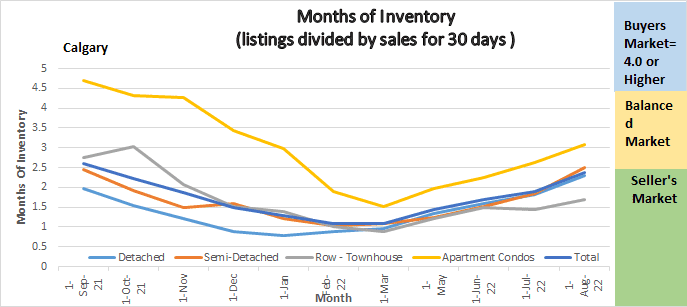
The following graph shows the months of inventory for each housing sector. Looking at a one-year trendline gives you an indication of where things are really heading.
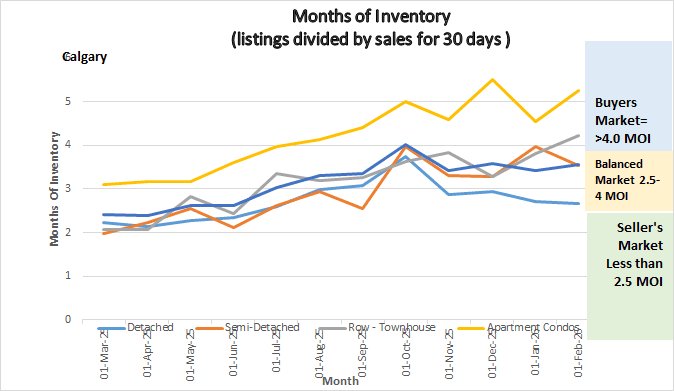
Graph shows the months of inventory for all sectors in the Calgary Real Estate Market
Gord’s commentary for the month (just my opinion).
Hope everyone had a wonderful holiday season!
January Highlights
Months of Inventory in the Detached and Semi-Detached sectors stayed flat while the Months of inventory in the Attached – Row and Apartment sectors increased.
Typical Sales levels for a January and prices remained almost flat.
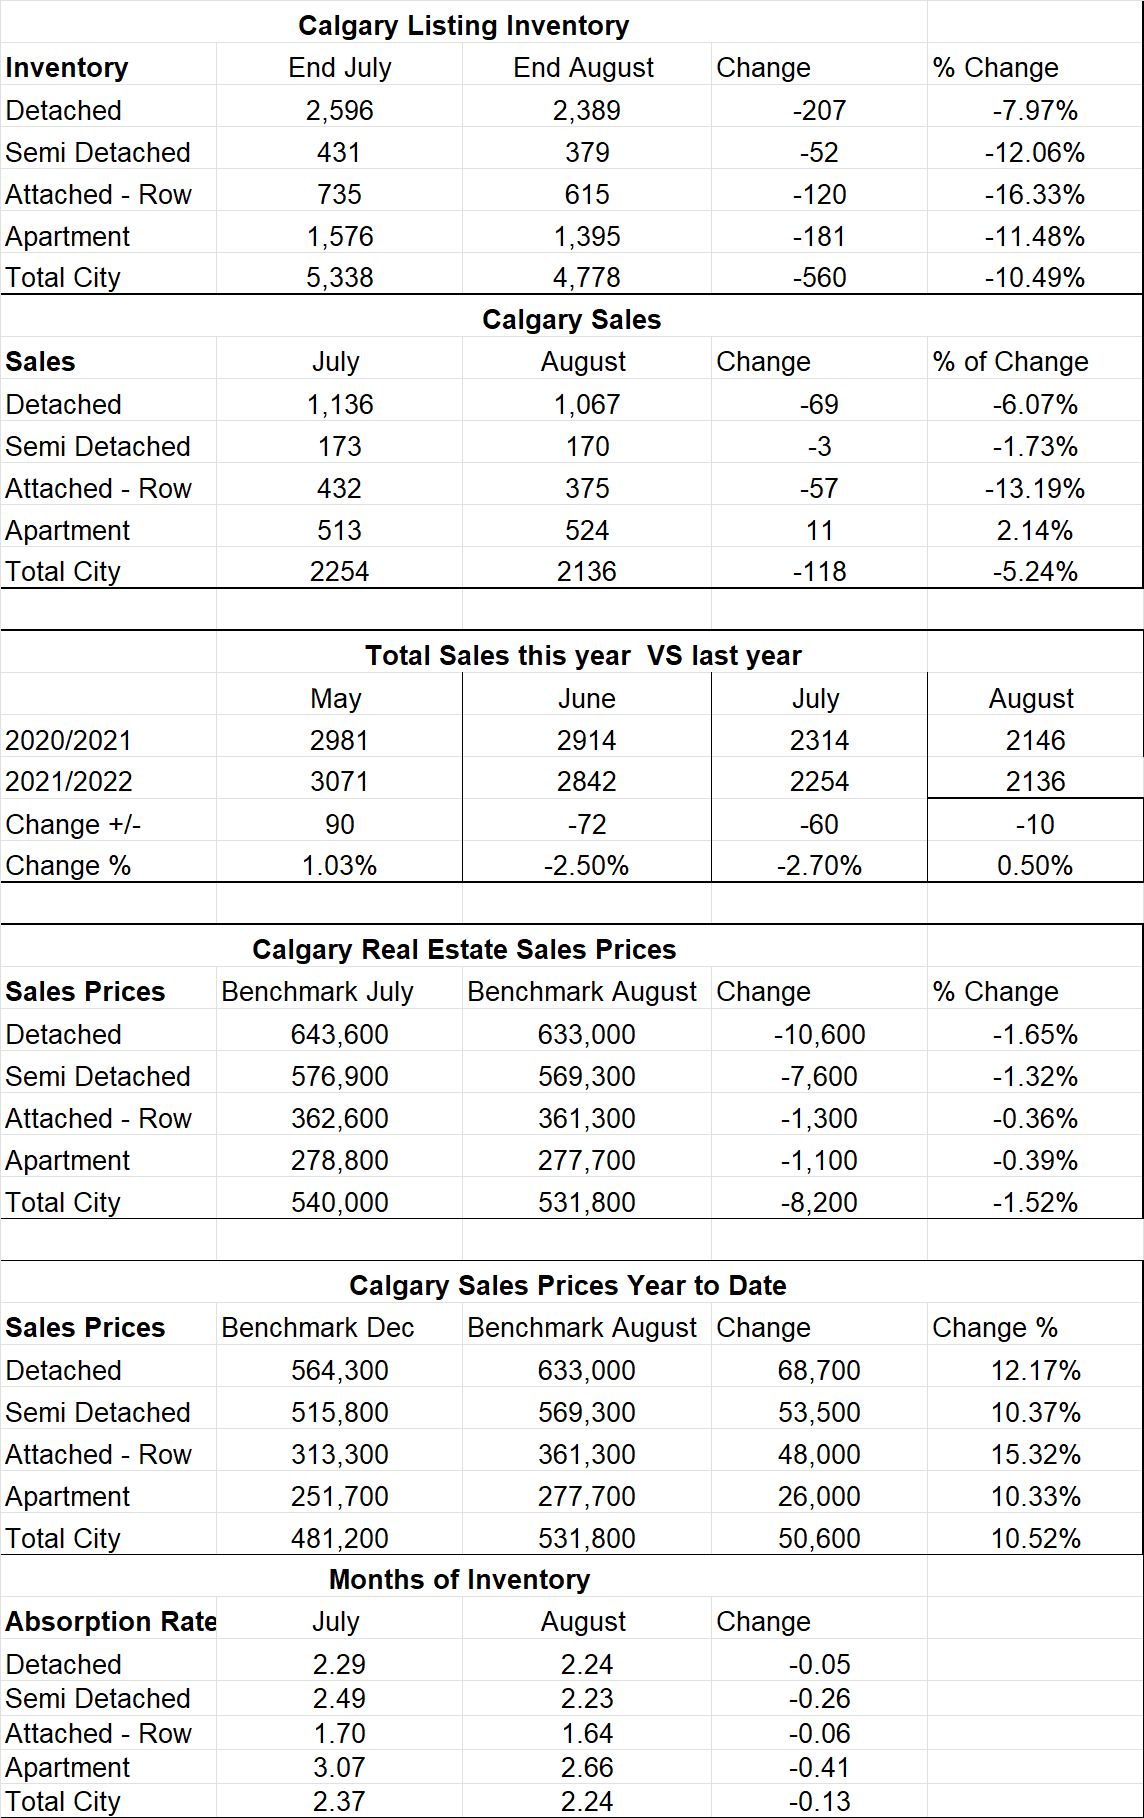
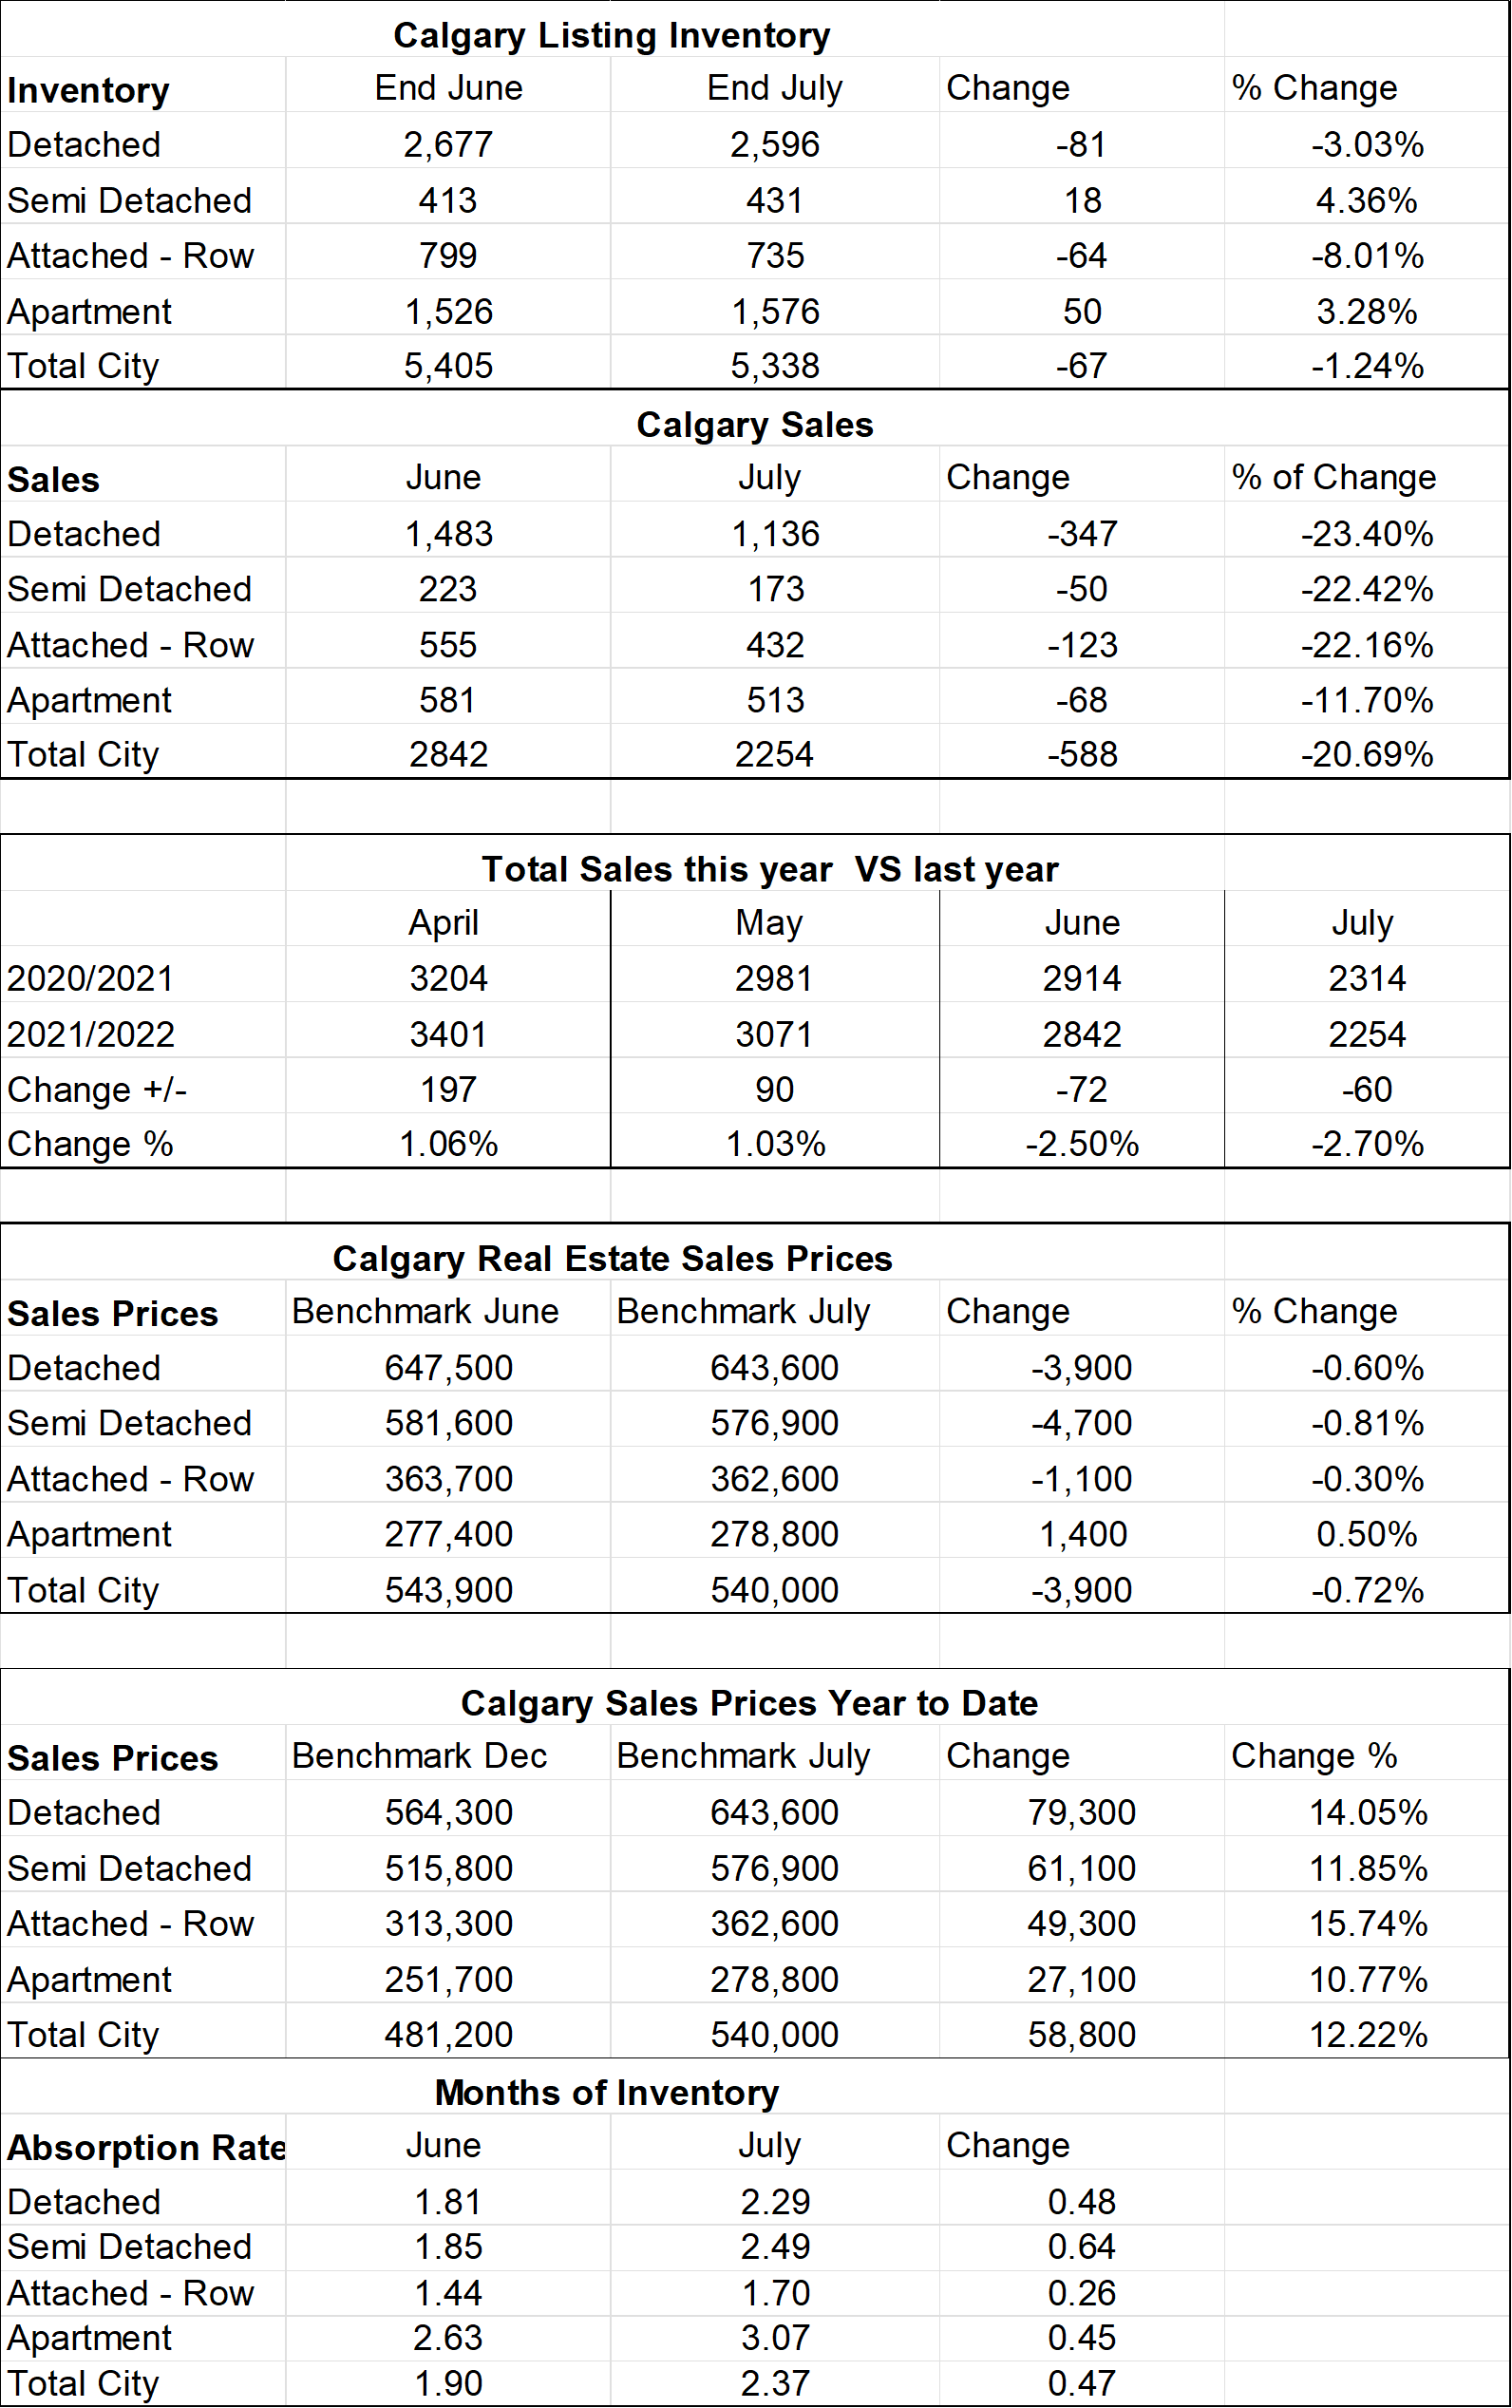
Calgary Listing Inventory
The Calgary listing inventory 13.76 % through January. This is very normal as many people wait until the new year to list.
Calgary Sales
Sales in January increased by 9.49% in January. Again, this is normal for January to see increased sales over December.
Sales Compared to 2025:
January saw a decrease in sales compared to January 2025. Looking at the last 6 months sales are consistently lower than in 2025.
| August | Sept | October | November | December | January | |
| 2025 | 2182 | 2000 | 2167 | 1793 | 1318 | 1449 |
| 2026 | 1989 | 1720 | 1885 | 1553 | 1126 | 1234 |
| Change | -193 | -280 | -282 | -240 | -192 | -192 |
| % Change | -9.7% | -14. % | -13.1 | -13.4% | -14.5% | 14.9% |
Calgary Real Estate Benchmark Sales Prices:
The overall Benchmark price decreased by only $300 in January. Both the Detached home sector and the Apartment Condo Sectors decreased by $2900 and $2400 respectively which are exceedingly small decreases.
Current Months of Inventory (Absorption Rate):
The overall months of Inventory increased by .13 Again this was driven mostly by the Apartment Condo Sector (.7) and the Attached Row sector (.40). The only sector that saw a decrease was the Semi-Detached Sector which decreased by .44%.
My Prediction for what is ahead:
In late January, I attended the Calgary Real Estate Boards forecast put on by CREB’s economist.
To summarize her message the prediction for 2026 is for the Detached and Semi-Detached sectors to remain similar to last years levels. She is also forecasting the supply levels for the Attached- Row and the Apartment Sectors to increase due to construction levels that are already in progress resulting in a further softening within those sectors.
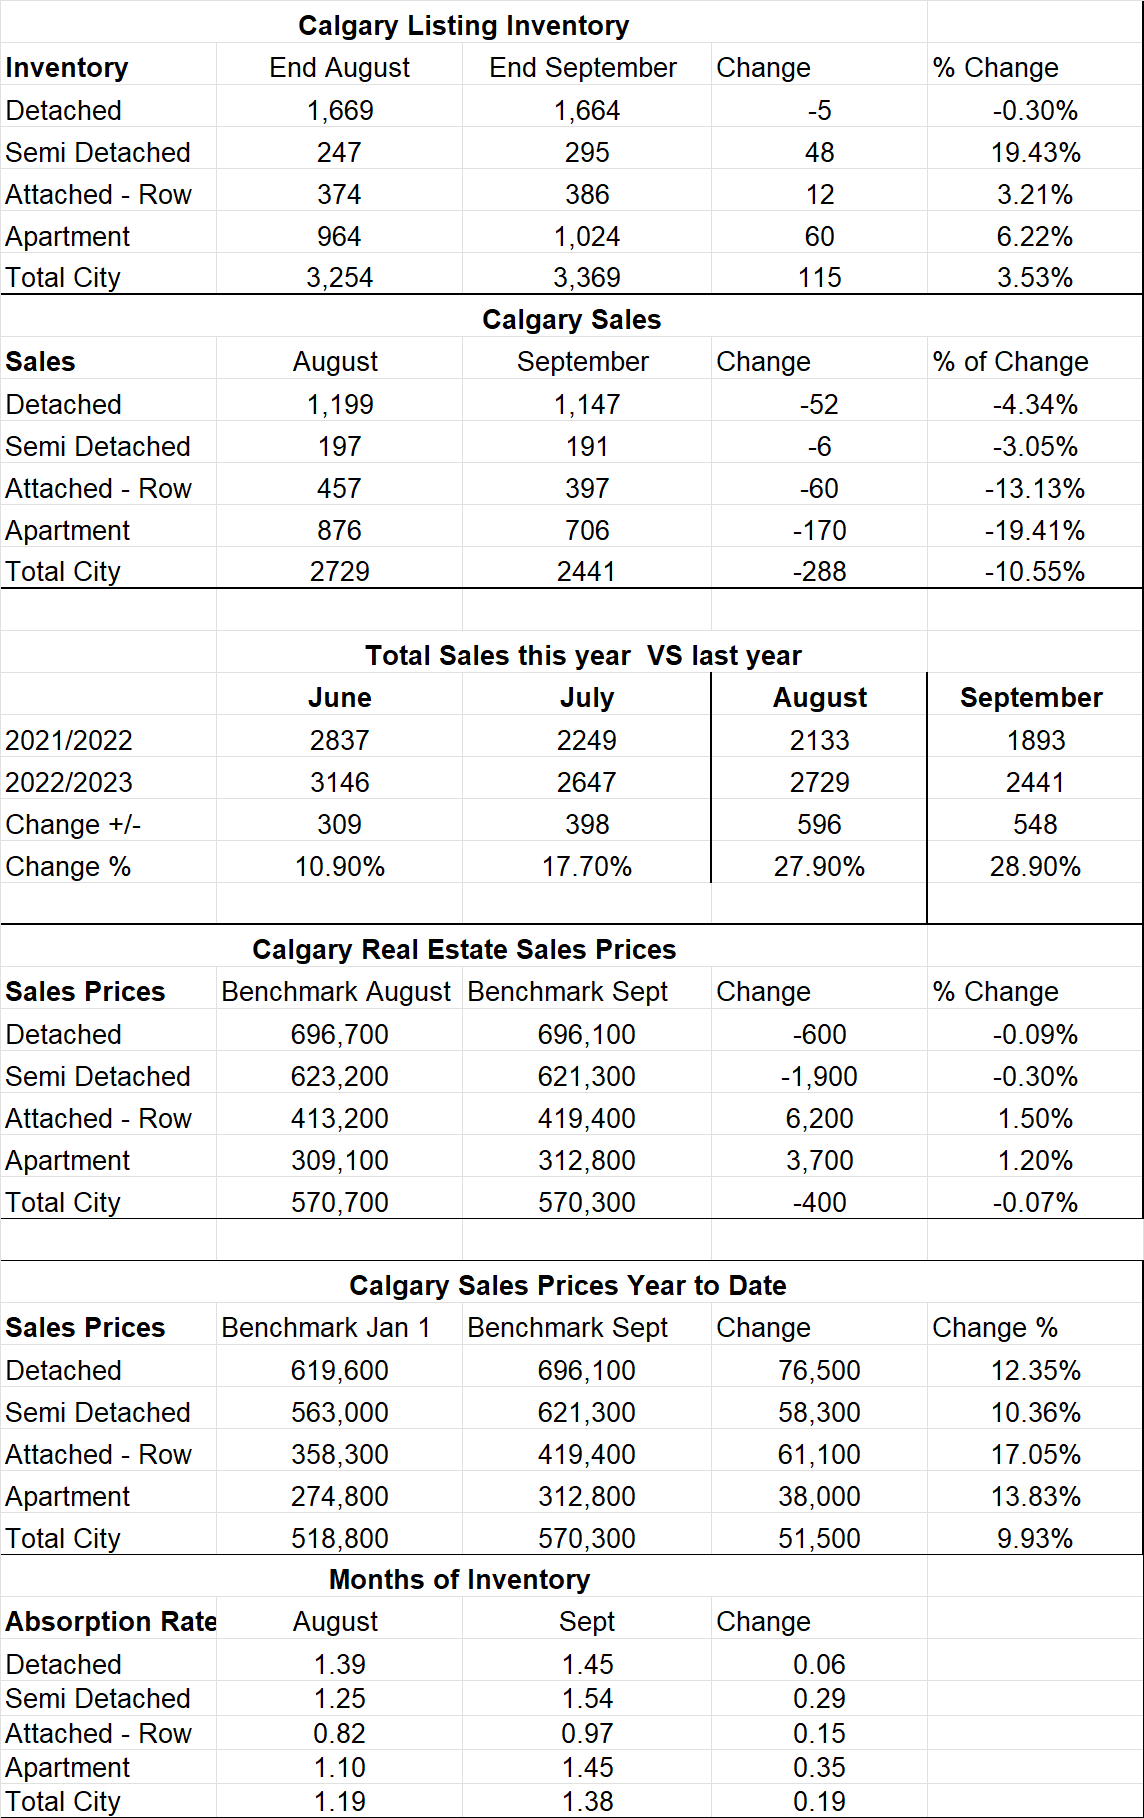
*Below is a summary of numbers in chart form. All numbers are taken from the Calgary Real Estate Boards monthly Stats package.
* All numbers vary by community and price ranges, if you would like stats specifically for your neighbourhood, please contact us.
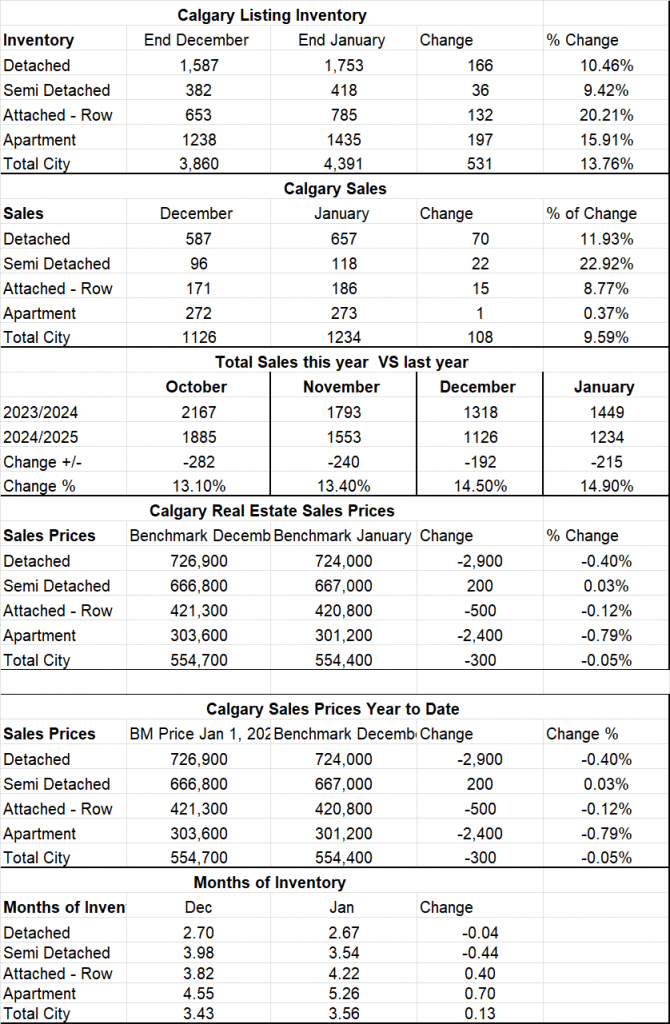
Summary of the Calgary Real Estate Board Realtors Stats