Archive for the ‘Blog’ Category

Sept 1, 2016 Calgary Real Estate Market Snapshot

Friday, September 2nd, 2016

Stay ahead of everyone else by following our Monthly Market Snapshot of the Calgary Real Estate Market This shows what’s really happening! The market is driven by supply and demand so here we show the inventory (supply) and sales (demand) and most importantly the relationship between the two and how it affects the price of Calgary Real Estate.  A simple way to keep up to date with how the market is trending and ahead of most! All numbers are taken from the Calgary Real Estate Boards Stats package for Realtors. I have also included some general comments which are simply my opinion.

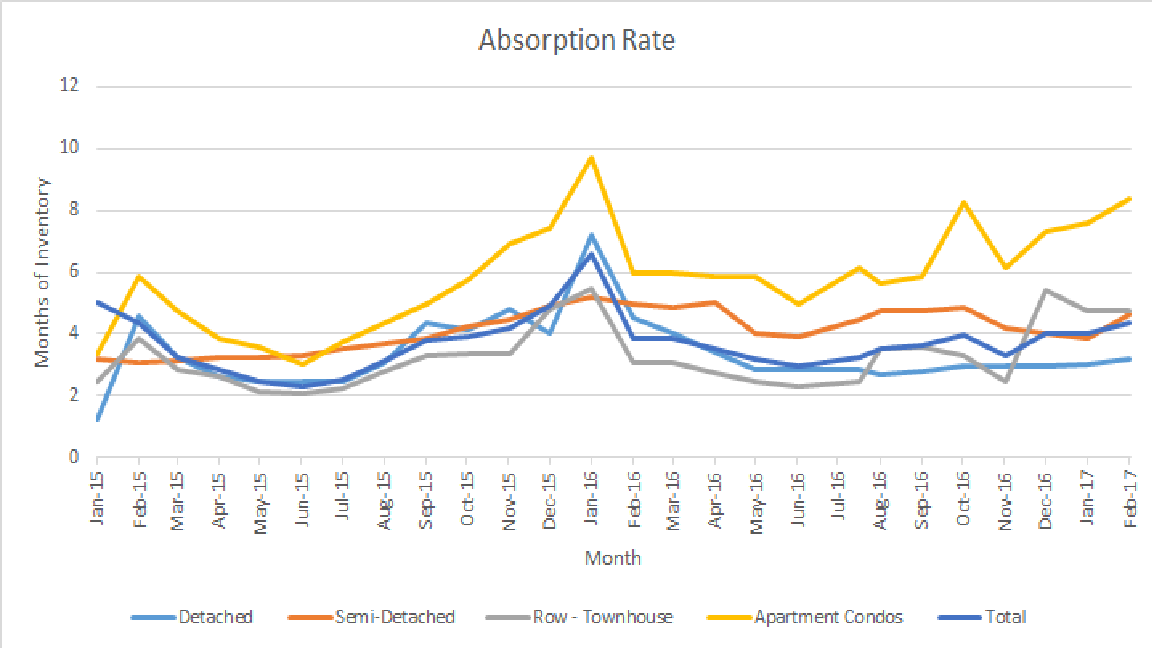
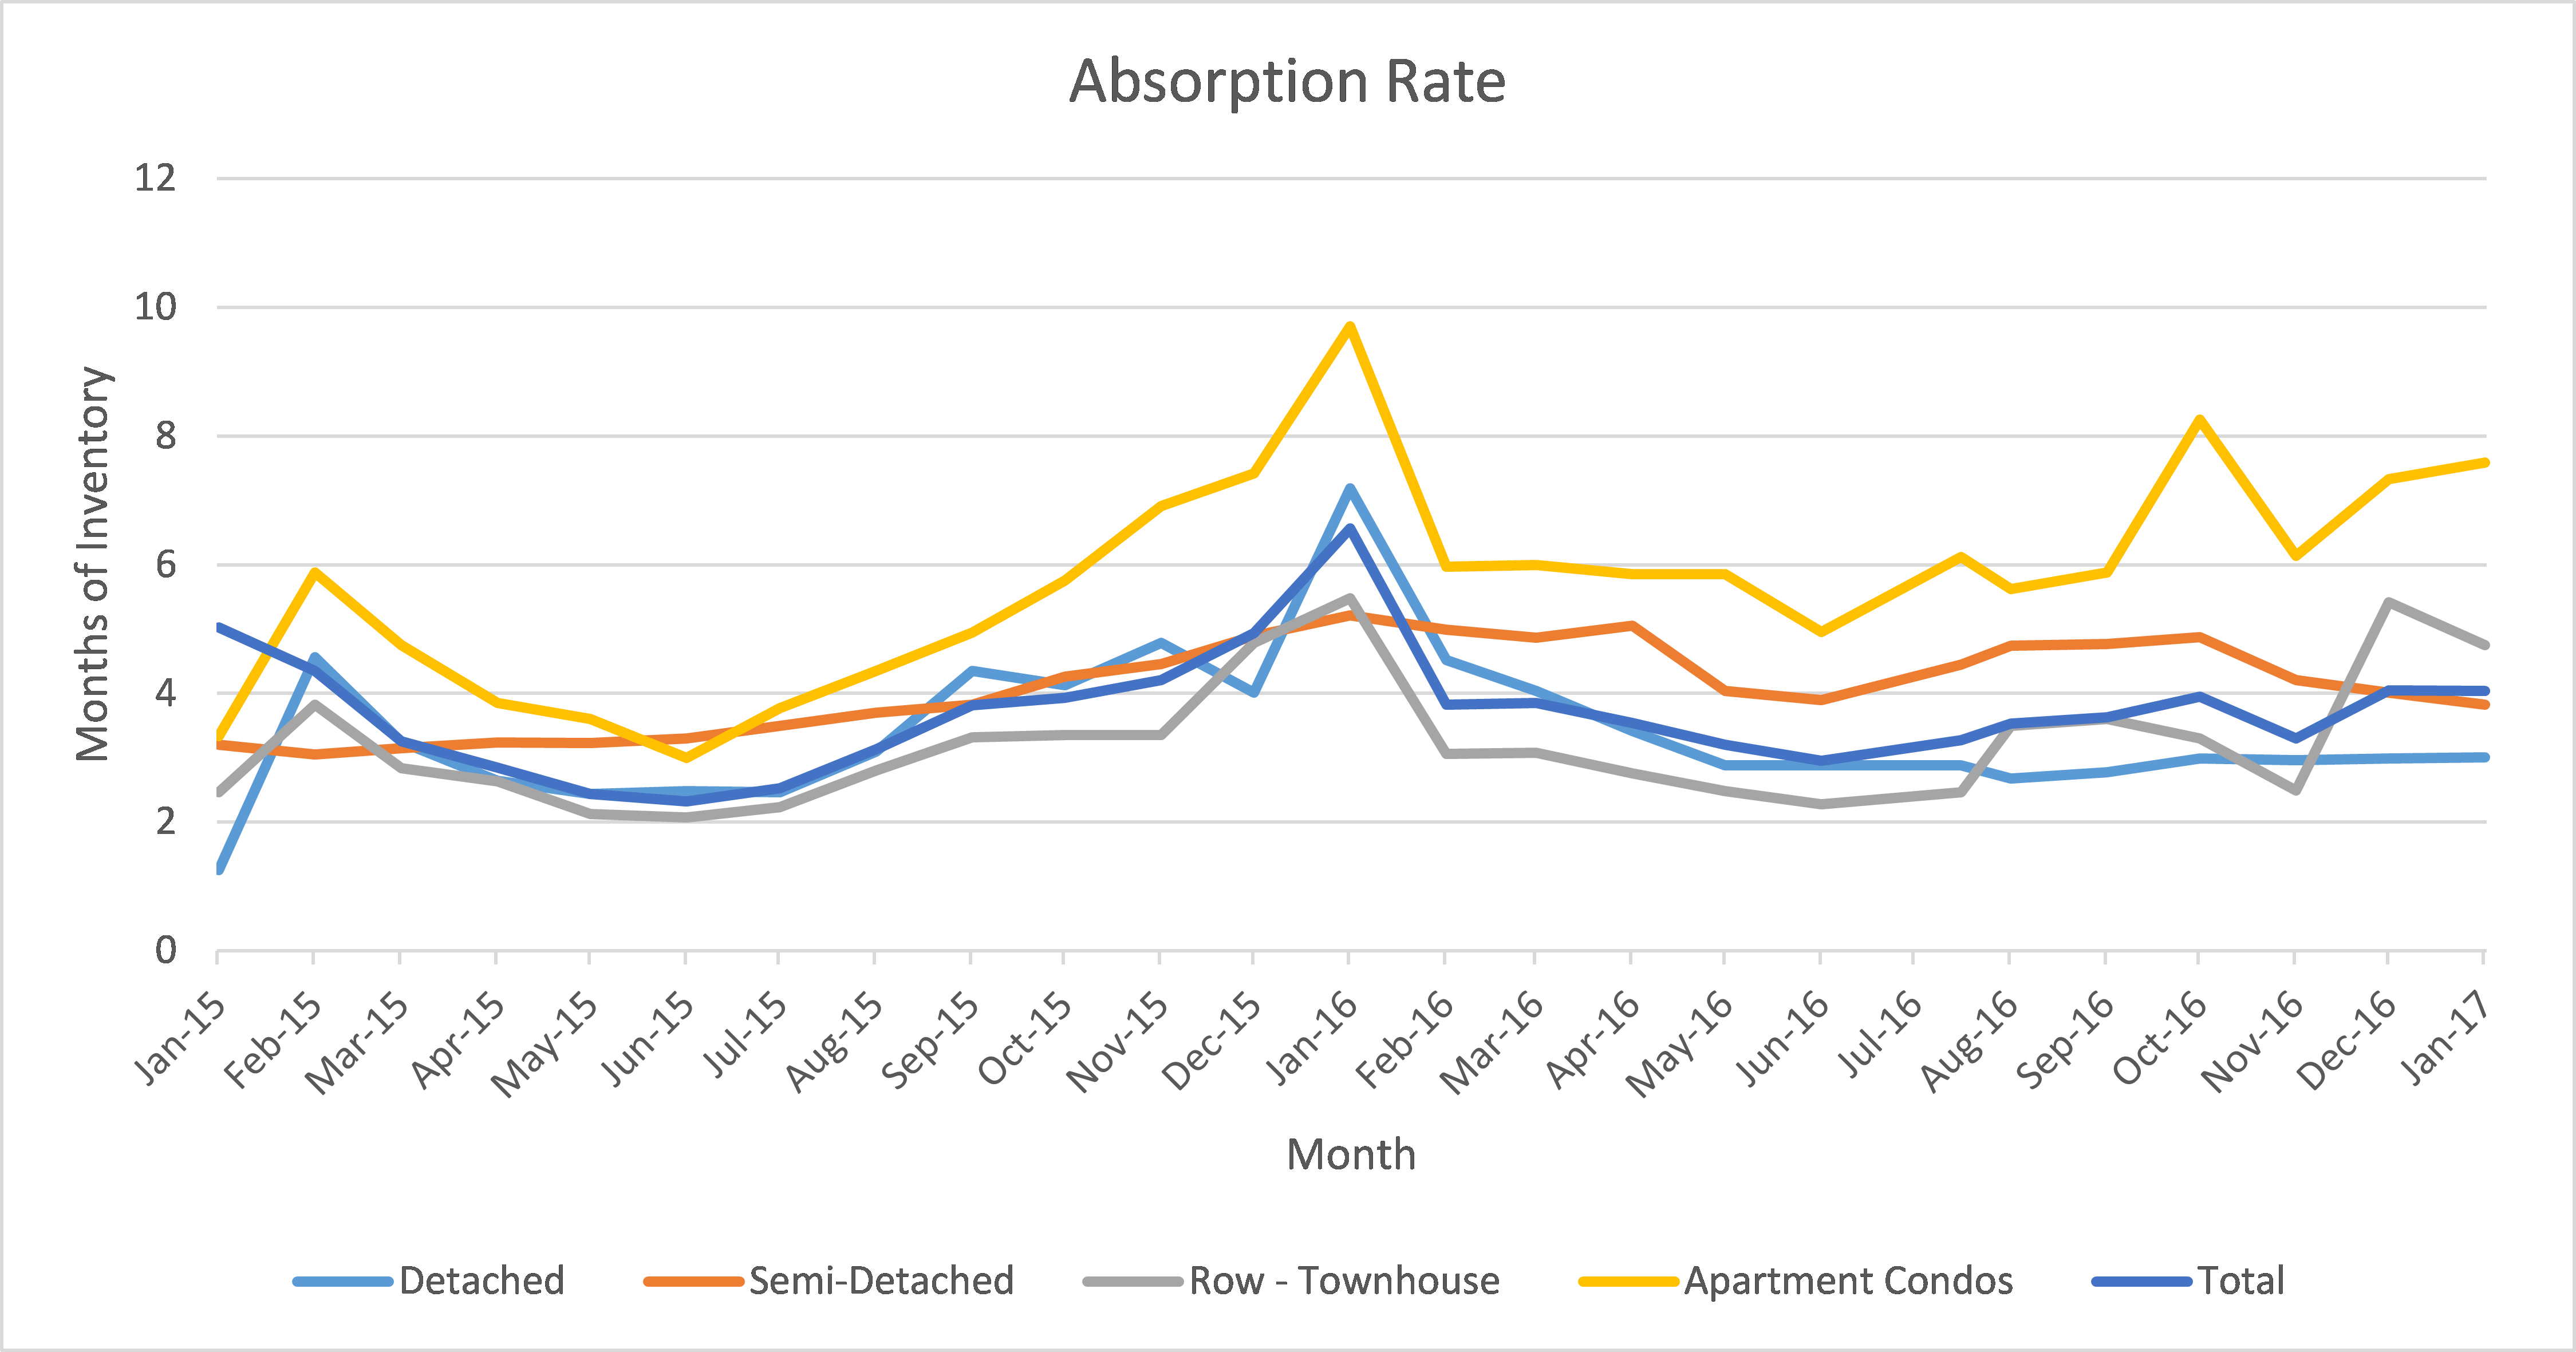
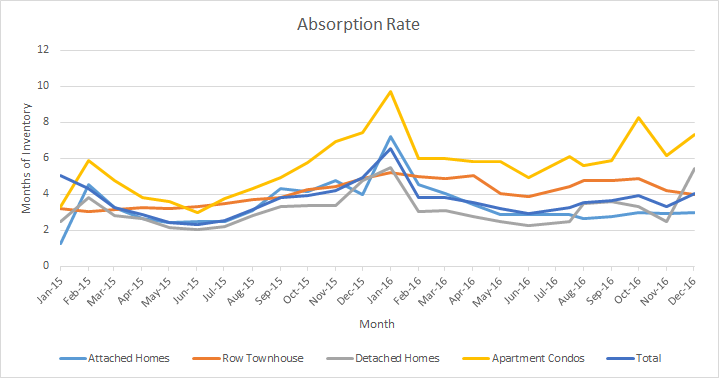
Absorption Rate (Months of Inventory)   (the inventory divided by the number of sales in the last month). What does this mean you might ask?

Buyer’s Market >4.0 Drives prices down
Balanced Market Between 2.4 to 4.0 Prices typically remain stable
Seller’s Market <2.4 Drives prices up

*** Absorption Rate***  

In my opinion this is the most critical number to look at.  All categories except for apartment condos increased slightly this month.  Apartment condos took a small decrease and this is most likely balancing out from last month when it increased substantially.  In summary Detached and Attached homes are doing well while row houses and apartment condos are showing an oversupply of inventory compared to sales.

  July 2016 August  2016 Change
Detached 2.47 2.78 0.30
Semi Detached 2.88 3.60 0.72
Attached – Row 4.43 4.77 0.34
Apartment 6.11 5.88 -0.23
Total City 3.27 3.61 0.34


Calgary Listing Inventory

August inventory levels stayed almost the same as July Levels

Inventory July 2016 August  2016 Change
Detached 2746 2720 -26
Semi Detached 521 497 -24
Attached – Row 886 868 -18
Apartment 1558 1571 13
Total City 5711 5656 -55


Calgary Sales:

Sales in all categories decreased this month which in my opinion is very normal for this time of year with summer holidays and many peoples focusing on getting kids ready to go back to school.

Important note:  Sales from July to August 2015 decreased by 193 or 11.7%  compared to 10.2% this year.

Calgary Sales   July 2016 August  2016 Change % Change
Detached 1110 980 -130 -11.71%
Semi Detached 181 138 -43 -23.76%
Attached – Row 200 182 -18 -9.00%
Apartment 255 267 12 4.71%
Total City 1745 1567 -178 -10.20%


Calgary Real Estate Sales Prices: 

Pricing changes in August were not drastic.  Detached and Semi Detached increased while Attached-Row and Apartment categories decreased with the largest decrease in the Apartment category which is the sector with the highest absorption rate.   I would expect further price declines in the Apartment condo sector.

  Sales Prices July 2016 Benchmark Price    August  2016

Benchmark Price

Change
Detached 502,300 503,200 900
Semi Detached 385,200 387,100 1,900
Attached – Row 310,300 310,000 -300
Apartment 277,000 274,900 -2,100
Total City 440,000 440,200 200


Sales Prices “Year to Date”   

Year to date prices

Sales Prices Dec 31, 2015   Benchmark Price  August 2016 Benchmark Price Change

$

% Change
Detached 514100 503,200 -10,900 -2.12%
Semi Detached 393100 387,100 -6,000 -1.53%
Attached – Row 318500 310,000 -8,500 -2.67%
Apartment 288,000 274,900 -13,100 -4.55%
Total City 452800 440,200 -12,600 -2.78%

Point of Interest

Just my personal opinion but it is important to note that buyers are still acting as if it is a buyer’s market. What I mean here is they are shopping carefully looking for value and taking their time to make decisions.

 Price Sensitivity

It is also important to note that homes in the lower price ranges are still moving much quicker than homes in the higher price ranges.

**Please note that these numbers do change on a community basis and more so for towns.  This report does not include rural properties.  If you would like to find stats on your community just let me know.  If you have any questions about this summary, would like to receive it monthly or Real Estate questions please feel free to contact us.


486 Chaparral Ravine View SW Calgary T2X 0A5

Saturday, August 27th, 2016

Beautiful 2546 sq. family home in the Ravine area of Chaparral with Lake Privileges.  Features an open floor plan and 9 ft. ceilings on the main and bmst levels.  Kitchen boasts granite counter tops and stainless steel appliances, a large island and extended eating bar.  Dining nook allows access to you back yard.  Large mud room with plenty of closet/storage space, enjoy the convenience of a huge Walk through Pantry.  Complete the main floor with living room with gas fireplace, a great room, and a 2 piece bath.  Upstairs you will find 3 bedrooms, bath, an office area and a large bonus room.  Master retreat features a raised section for your bed or favorite reading chairs.  Spa like ensuite features dual sinks, soaker tub and separate shower, complete the master with a walk in closet.  Basement has been left untouched and is awaiting your creative design.  Yard features underground sprinkler system, a gorgeous deck and trellis, kids dream playhouse and a dog run.

Price: $575,000

MLS C4078736

For more information contact us


August 1, 2016 Calgary Real Estate Market Snapshot

Tuesday, August 2nd, 2016

Stay ahead of everyone else by following our Monthly Market Snapshot of the Calgary Real Estate Market This shows what’s really happening! The market is driven by supply and demand so here we show the inventory (supply) and sales (demand) and most importantly the relationship between the two and how it affects the price of Calgary Real Estate.  A simple way to keep up to date with how the market is trending and ahead of most! All numbers are taken from the Calgary Real Estate Boards Stats package for Realtors. I have also included some general comments which are simply my opinion.

Absorption Rate (Months of Inventory)   (the inventory divided by the number of sales in the last month). What does this mean you might ask?

Buyer’s Market >4.0 Drives prices down
Balanced Market Between 2.4 to 4.0 Prices typically remain stable
Seller’s Market <2.4 Drives prices up


*** Absorption Rate***  

In my opinion this is the most critical number to look at.   All categories increased slightly this month except Apartment condos which increased by 1.16.   This is a reverse trend from last month where all categories decreased.   As you can see the apartment condo market is still favouring Buyers the most.

  June 2016 July 2016 Change
Detached 2.28 2.46 0.18
Semi Detached 2.88 2.88 0.01
Attached – Row 3.90 4.45 0.55
Apartment 4.96 6.12 1.16
Total City 2.95 3.27 0.32


Calgary Listing Inventory

July saw a decrease in inventory in all categories except Apartment Condos which increased very slightly.   This decrease is due to less new listings coming to market.


Inventory June 2016 July 2016 Change
Detached 2923 2727 -196
Semi Detached 532 522 -10
Attached – Row 975 882 -93
Apartment 1543 1554 11
Total City 5973 5685 -288


Calgary Sales:

Sales in all categories decreased this month which in my opinion is very normal for this time of year with summer holidays many peoples focus.

Calgary Sales   June 2016 July 2016 Change % Change
Detached 1282 1108 -174 -13.57%
Semi Detached 185 181 -4 -2.16%
Attached – Row 250 198 -52 -20.80%
Apartment 311 254 -57 -18.33%
Total City 2028 1741 -287 -14.15%


Calgary Real Estate Sales Prices: 

Pricing changes in July were minimal with all categories decreasing slightly.  Again apartment condos decreased a little more and this make sense to me with the higher absorption rate.  I would expect further price declines in the Apartment condo sector.

  Sales Prices June  2016

Benchmark Price 

  July 2016

Benchmark Price

Change
Detached 502,400 502,300 -100
Semi Detached 385,600 385,200 -400
Attached – Row 310,800 310,300 -500
Apartment 278,200 277,000 -1,200
Total City 440,400 440,000 -400


 Sales Prices “Year to Date”   

Year to date prices

Sales Prices Dec 31, 2015   Benchmark Price  July  2016

Benchmark Price

Change

$

% Change
Detached 514100 502,300 -11,800 -2.30%
Semi Detached 393100 385,200 -7,900 -2.01%
Attached – Row 318500 310,300 -8,200 -2.57%
Apartment 288,000 277,000 -11,000 -3.82%
Total City 452800 440,000 -12,800 -2.83%


Price Sensitivity

It is also important to note that homes in the lower price ranges are still moving much quicker than homes in the higher price ranges.

**Please note that these numbers do change on a community basis and more so for towns.  This report does not include rural properties.  If you would like to find stats on your community just let me know.  If you have any questions about this summary or Real Estate questions please feel free to contact us.


93 20 Street NW Calgary Ab T2N 4Y9

Friday, July 29th, 2016

Bright and beautiful open concept living in a fantastic location in the desired community of West Hillhurst.  Live the inner city lifestyle, walk to river and pathway system, bike to downtown, transit a few steps away, Kensington nearby and boasts City skyline views from 2 levels.  Features of this home include Birch hardwood flooring, 9 foot ceilings, crown moldings, In-floor heat (lower), Central Air and Hunter Douglas blinds throughout.   Beautiful kitchen with Stainless Steel appliances, Island with eating bar, maple cabinetry, and a large walk in pantry.  Spacious eating area for entertaining. Living room is bright and features a free standing gas stove, small balcony and views of downtown.  The upper level offers a large Master that features full ensuite, walk in closet, vaulted ceilings and a fantastic view of downtown.  Complete the upper level with a spacious second bedroom and full bath.  Ground level features, laundry, a flex room (for office, exercise and or TV room) with French doors to your private fenced yard.  Don’t forget the attached garage. MLS C4075090

View Full Listing here

View our Video Tour

Contact us:

003_Open2view_ID6788-_93_20_St_NW 022_Open2view_ID6788-_93_20_St_NW


012_Open2view_ID6788-_93_20_St_NW

018_Open2view_ID6788-_93_20_St_NW


019_Open2view_ID6788-_93_20_St_NW

035_Open2view_ID6788-_93_20_St_NW


039_Open2view_ID6788-_93_20_St_NW


Surprising Ways Buyers Find Homes

Tuesday, July 12th, 2016

Do you ever wonder how most people find the homes they eventually buy? You might imagine them driving by a “For Sale” sign or seeing a home for sale in the newspaper and then calling to enquire. Of course, many buyers find out about listed properties that way. But, according to research by the National Association of Realtors, there are many other — sometimes surprising — ways buyers find their next dream home.

For example:

• 88% of buyers find a home with the help of a real estate agent.

• 90% of buyers search online as part of the home buying process. (Such as viewing a property’s profile on the agent’s website.)

• 69% of buyers searching for a home using Google, use a specific local term, such as “Calgary – Northwest- homes for sale”.

• 29-46% of buyers attend an Open House as part of their home hunting activities.

Overall, the research shows that buyers are using a multitude of ways — combining online and offline methods — to find homes. What does all this mean to you? If means that if you’re preparing your home for sale, you need to ensure your marketing plan takes into account all the ways buyers are finding properties — so you can be sure that they will find yours.

Looking for a REALTOR® who knows how to market your home for maximum exposure? Contact us today.

Buyers vs. Sellers Market—What is the Difference?

Wednesday, July 6th, 2016

There are many factors which affect the real estate market–interest rates, employment, investment growth, legislative changes and new construction, to name a few. All of these factors influence the real estate market in some way.

In a buyer’s market, there are more homes for sale than there are buyers. This could be a result of high unemployment, fear of interest rate increases or other factors which make people think twice about purchasing a home for the first time or moving up into a larger home. The advantage buyers have in a buyers’ market is that they can typically take their time and look at all of their options before buying. Overall, home prices may go down in a buyer’s market.

In a seller’s market, there are fewer homes for sale to a larger pool of buyers. The factors at work could be sustained low interest rates, high employment rate, legislative changes which make it easier to purchase a property–events and conditions that make buyers think it would be a good time to buy a big ticket item like a home.

The advantage goes to the seller in a seller’s market–typically home prices will rise as buyers are quick to make an offer to secure the property.

July1, 2016 Calgary Real Estate Market Snapshot

Tuesday, July 5th, 2016

Stay ahead of everyone else by following our Monthly Market Snapshot of the Calgary Real Estate Market. This shows what’s really happening! The market is driven by supply and demand so here we show the inventory (supply) and sales (demand) and most importantly the relationship between the two and how it affects the price of Calgary Real Estate.  A simple way to keep up to date with how the market is trending and ahead of most! All numbers are taken from the Calgary Real Estate Boards Stats package for Realtors. I have also included some general comments which are simply my opinion.

Absorption Rate (Months of Inventory)   (the inventory divided by the number of sales in the last month). What does this mean you might ask?

Buyer’s Market >4.0 Drives prices down
Balanced Market Between 2.8 to 4.0 Prices typically remain stable
Seller’s Market <2.8 Drives prices up


*** Absorption Rate***  

In my opinion this is the most critical number to look at.   All categories decreased this month meaning the market balance is continuing to shift.  As you can see the apartment condo market is still the slowest however shifted the most this month.

May 2016 June  2016 Change
Detached 2.48 2.28 -0.20
Semi Detached 2.88 2.88 -0.01
Attached – Row 4.04 3.90 -0.14
Apartment 5.85 4.96 -0.89
Total City 3.20 2.95 -0.25


Calgary Listing Inventory

June saw a slight decrease in inventory in all categories except Attached row homes (Townhouses) which increased by only 1 listing.

Inventory May 2016 June  2016 Change
Detached 3018 2923 -95
Semi Detached 548 532 -16
Attached – Row 974 975 1
Apartment 1608 1543 -65
Total City 6148 5973 -175


Calgary Sales:

Sales in all categories increased moderately again this month except for Semi-Detached homes which dropped by 5 sales and detached homes which increased by 65 or 5.34%.   This is very typical for a spring market and we will most likely start seeing a slight drop in sales numbers with summer holidays approaching.  It is important to note that Sales are still down from normal levels but the trend shows increases.

Calgary Sales   May 2016 June  2016 Change % Change
Detached 1217 1282 65 5.34%
Semi Detached 190 185 -5 -2.63%
Attached – Row 241 250 9 3.73%
Apartment 275 311 36 13.09%
Total City 1923 2028 105 5.46%


Calgary Real Estate Sales Prices: 

Pricing changes in June were minimal with Detached and Semi Detached increasing slightly and Attached- Row and Apartment decreasing slightly. This is very consistent with what the overall Absorption rate is telling us.  Expect further price declines in the Apartment condo sector.

  Sales Prices May  2016

Benchmark Price 

  June  2016

Benchmark Price

Change
Detached 500500 502,400 1,900
Semi Detached 383100 385,600 2,500
Attached – Row 313200 310,800 -2,400
Apartment 278500 278,200 -300
Total City 439700 440,400 700


Sales Prices “Year to Date”   

Year to date prices

Sales Prices Dec 31, 2015   Benchmark Price  June  2016

Benchmark Price

Change

$

% Change
Detached 514100 502,400 -11,700 -2.28%
Semi Detached 393100 385,600 -7,500 -1.91%
Attached – Row 318500 310,800 -7,700 -2.42%
Apartment 288,000 278,200 -9,800 -3.40%
Total City 452800 440,400 -12,400 -2.74%


Point of Interest

Just my personal opinion but it is important to note that buyers are still acting as if it is a buyer’s market. What I mean here is they are shopping carefully looking for value and taking their time to make decisions.


Price Sensitivity

It is also important to note that homes in the lower price ranges are still moving much quicker than homes in the higher price ranges.

**Please note that these numbers do change on a community basis and more so for towns.  This report does not include rural properties.  If you would like to find stats on your community just let me know.  If you have any questions about this summary or Real Estate questions please feel free to contact us.

Home Insurance what Insurance?

Saturday, June 11th, 2016

There are many types of insurance involved when buying and owning a house and I have found this leads to confusion among my clients. In this commentary I will summarize each one and highlight what role it takes.

Mortgage Default Insurance

This type of insurance allows home buyers to purchase a home with a low down payment.

There are two types of mortgage options:

  1. conventional mortgages – on loans with a minimum 20 per cent down payment
  2. high-ratio mortgages – on loans with less than 20 per cent down payment

In Canada, mortgage insurance is required federally on high-ratio mortgages – that is, mortgages with a down payment of 20 per cent or less. This insurance, which protects the lender in case of borrower default, gives lenders the flexibility to offer borrowers with low down payments the same low interest rates they would offer to homebuyers with more equity.

Title Insurance

Title insurance works like a standard insurance policy. It protects against future discoveries about a property, some title-related and some non-title-related. It is a form of indemnity insurance for a mortgaged property that covers the loss of an interest in a property due to discovered legal defects. There are two types of title insurance:

  1. Owner’s title insurance: This is a policy where either the buyer or seller may pay the insurance premiums to protect the buyer’s equity in the property. This title insurance may provide coverage for title and some non-title issues. The purchaser of the insurance must disclose any known issues or defects regarding the property’s title or non-title items to the insurer prior to purchasing a policy.
  1. Lender’s title insurance: The borrower usually pays for lender’s title insurance even though it is for the sole benefit of the mortgage lender. This type of title insurance gives protection to the lender with respect to the priority, validity and enforceability of the mortgage. If your lender requires a title insurance policy as part of the transaction, that policy is for the benefit of the lender and will not cover you as the buyer.

Homeowners Insurance

This is a form of property insurance designed to protect an individual’s home against damages to the house itself, or to possessions in the home. Homeowners insurance also provides liability coverage against accidents in the home or on the property. Lenders will require that this be setup prior to funding the mortgage.

Mortgage Life Insurance

Mortgage life insurance is a form of insurance specifically designed to repay a mortgage. If the policyholder were to die while the mortgage life insurance was in force, the policy would pay out a capital sum that will be just sufficient to repay the outstanding mortgage. There are many forms of this insurance and you are best talking with an insurance broker about your options.

Should you have any questions about this commentary, please let me know

This Article was written by our friend Bob Alexander.  Please Contact Bob Alexander For Further Information About This Commentary or To Discuss Your Mortgage Action Plan. To receive his monthly commentary directly send an email to   bob@mortgagedoctors.ca

Your Mortgage Doctor
Bob Alexander, B.Comm, CMA, AMP

Phone: 403-875-5270
Email: bob@mortgagedoctors.ca
www.mortgagedoctors.ca

June 1, 2016 Calgary Real Estate Market Snapshot

Thursday, June 2nd, 2016

Stay ahead of everyone else by following our Monthly Market Snapshot of the Calgary Real Estate Market. This shows what’s really happening! The market is driven by supply and demand so here we show the inventory (supply) and sales (demand) and most importantly the relationship between the two and how it affects the price of Calgary Real Estate.  A simple way to keep up to date and ahead of most! All numbers are taken from the Calgary Real Estate Boards Stats package for Realtors. I have also included some general comments which are simply my opinion.

Absorption Rate (Months of Inventory)   (the inventory divided by the number of sales in the last month). What does this mean you might ask?

Buyer’s Market >4.0 Drives prices down
Balanced Market Between 2.8 to 4.0 Prices typically remain stable
Seller’s Market <2.8 Drives prices up


*** Absorption Rate***  

In my opinion this is the most critical number to look at.  Detached homes & Semi – detached homes are now back in a seller’s market. The only category not to decrease in absorption rate was apartment condos and they stayed flat.

April  2016 May  2016 Change
Detached 2.76 2.48 -0.28
Semi Detached 3.42 2.88 -0.54
Attached – Row 5.05 4.04 -1.01
Apartment 5.85 5.85 0.00
Total City 3.54 3.20 -0.34


Calgary Listing Inventory

May saw a slight decrease in Detached and Semi – Detached while Attached – Row and Apartment condos increased slightly.

Inventory April  2016 May  2016 Change
Detached 3127 3018 -109
Semi Detached 595 548 -47
Attached – Row 930 974 44
Apartment 1590 1608 18
Total City 6242 6148 -94


Calgary Sales:

Sales in all categories increased moderately again this month.  This is very typical for a spring market.  It is important to note that Sales are still down from normal levels but are increasing.  The big jump in sales this month was in the Attached – Row homes which increased by 31%.

Calgary Sales   April  2016 May  2016 Change % Change
Detached 1134 1217 83 7.32%
Semi Detached 174 190 16 9.20%
Attached – Row 184 241 57 30.98%
Apartment 272 275 3 1.10%
Total City 1764 1923 159 9.01%


Calgary Real Estate Sales Prices: 

Interesting that all categories decreased in prices.  In my opinion, I believe it is simply because of what is happening in the general Calgary economy and Buyers and Sellers are not aware of how the market has shifted direction and everyone is still acting like it’s a buyer’s market.  Buyers are bringing low offers, and sellers are happy just to get an offer and are willing to settle a little lower.

  Sales Prices April  2016

Benchmark Price 

   May   2016

Benchmark Price

Change
Detached 501500 500500 -1000
Semi Detached 383600 383100 -500
Attached – Row 314800 313200 -1600
Apartment 280400 278500 -1900
Total City 441000 439700 -1300


Sales Prices “Year to Date”   

Year to date prices

Sales Prices Dec 31, 2015   Benchmark Price  May  2016

Benchmark Price

Change

$

% Change
Detached 514100 501500 -12600 -2.45%
Semi Detached 393100 383600 -9500 -2.42%
Attached – Row 318500 314800 -3700 -1.16%
Apartment 288000 280,400 -7,600 -2.64%
Total City 452800 441000 -11800 -2.61%


 Price Sensitivity

It is also important to note that homes in the lower price ranges are still moving much quicker than homes in the higher price ranges.

**Please note that these numbers do change on a community basis and more so for towns.  This report does not include rural properties.  If you would like to find stats on your community just let me know.  If you have any questions about this summary or Real Estate questions please contact us.


TSW Real Estate Group

Housing Market Outlook Calgary

Thursday, May 19th, 2016

Every quarter Canadian Mortgage and Housing Corporation  Issues a Calgary Housing Report.  This reports on new build, inventory, MLS Sales, Rental Vacancies and the why behind their predictions.

Date Released: Spring 2016

Below are some highlights on the Existing Home market.

To view the entire report and find out how you can get your’s delivered to your inbox click here.

Existing home market: Average house prices forecast to decline in 2016 Following a 29 per cent decline in 2015 to 23,994 units, MLS® residential sales in Calgary are forecast to move lower for the second consecutive year in 2016. Job losses, especially among full-time positions, and reduced consumer sentiment will keep many buyers on the sidelines. In addition, income growth will also be muted and migration to the region will decrease. While mortgage rates are expected to remain low throughout the forecast period, weakness in the other primary drivers of housing demand will keep sales from rising. Sales in 2016 are forecast to range between 19,800 and 22,200 transactions. Oil prices in 2017 are expected to stabilize at higher levels compared to the year before, leading to modest improvements in economic activity and consumer confidence. MLS® residential sales in 2017 are forecast to range between 20,200 and 22,600 units. Following a pronounced increase of over 40 per cent in 2015, the rise in active listings has slowed down in 2016. In the first quarter, active listing were at elevated levels, and up four per cent from the previous year. The increase in supply has provided prospective buyers more selection compared to a year earlier. Not only are sellers under more pressure to accept lower prices, but new home builders are also facing more competition from the existing home market. Although trending up in the last several months, active listings have started to plateau and will move lower later in 2016 and into 2017. New listings in 2016 are not expected to change significantly compared to a year earlier. After three months, new listings were down three per cent from the corresponding period in 2015. As housing demand has moderated and prices have declined, homeowners are not rushing to list their houses for sale. In addition, newly listed homes will also be competing with 0 5 10 15 20 25 30 35 40 thousands Inner range Source: CREA, (F): CMHC Forecast Figure 2 Calgary CMA, MLS® Sales (000s) Housing Market Outlook – Calgary CMA – Date Released – Spring 2016 Canada Mortgage and Housing Corporation 4 an already well-supplied resale market where homes on average are taking longer to sell. New listings in Calgary are not expected to rise substantially until home prices post stronger gains. The average MLS® residential price in 2016 is forecast to post another decline and range between $444,500 and $449,500, compared to $453,814 in 2015. The sales-to-active listings ratio declined to 21 per cent in the first quarter and is expected to remain relatively low for most of 2016. The increase in supply and lower demand has given buyers an edge over home sellers, putting downward pressure on prices. CMHC’s Housing Market Assessment2 framework had also detected moderate evidence of overvaluation as house prices have not been fully supported by economic and demographic fundamentals. In 2017, house prices in the resale market are anticipated to gradually stabilize as the market shifts to more balanced levels. Improvements in economic conditions and housing demand combined with less supply will help support home prices. The MLS® average residential price in 2017 is forecast to range from $450,400 to $455,600.