What is really happening in the Calgary Real Estate Market?
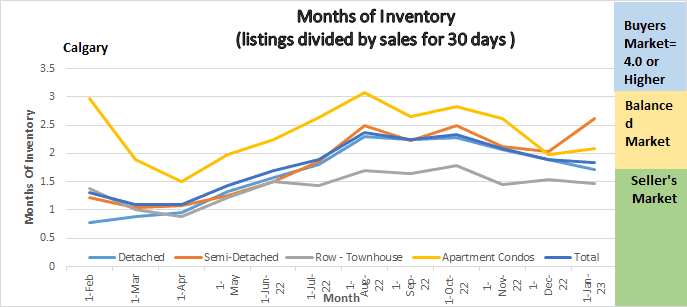
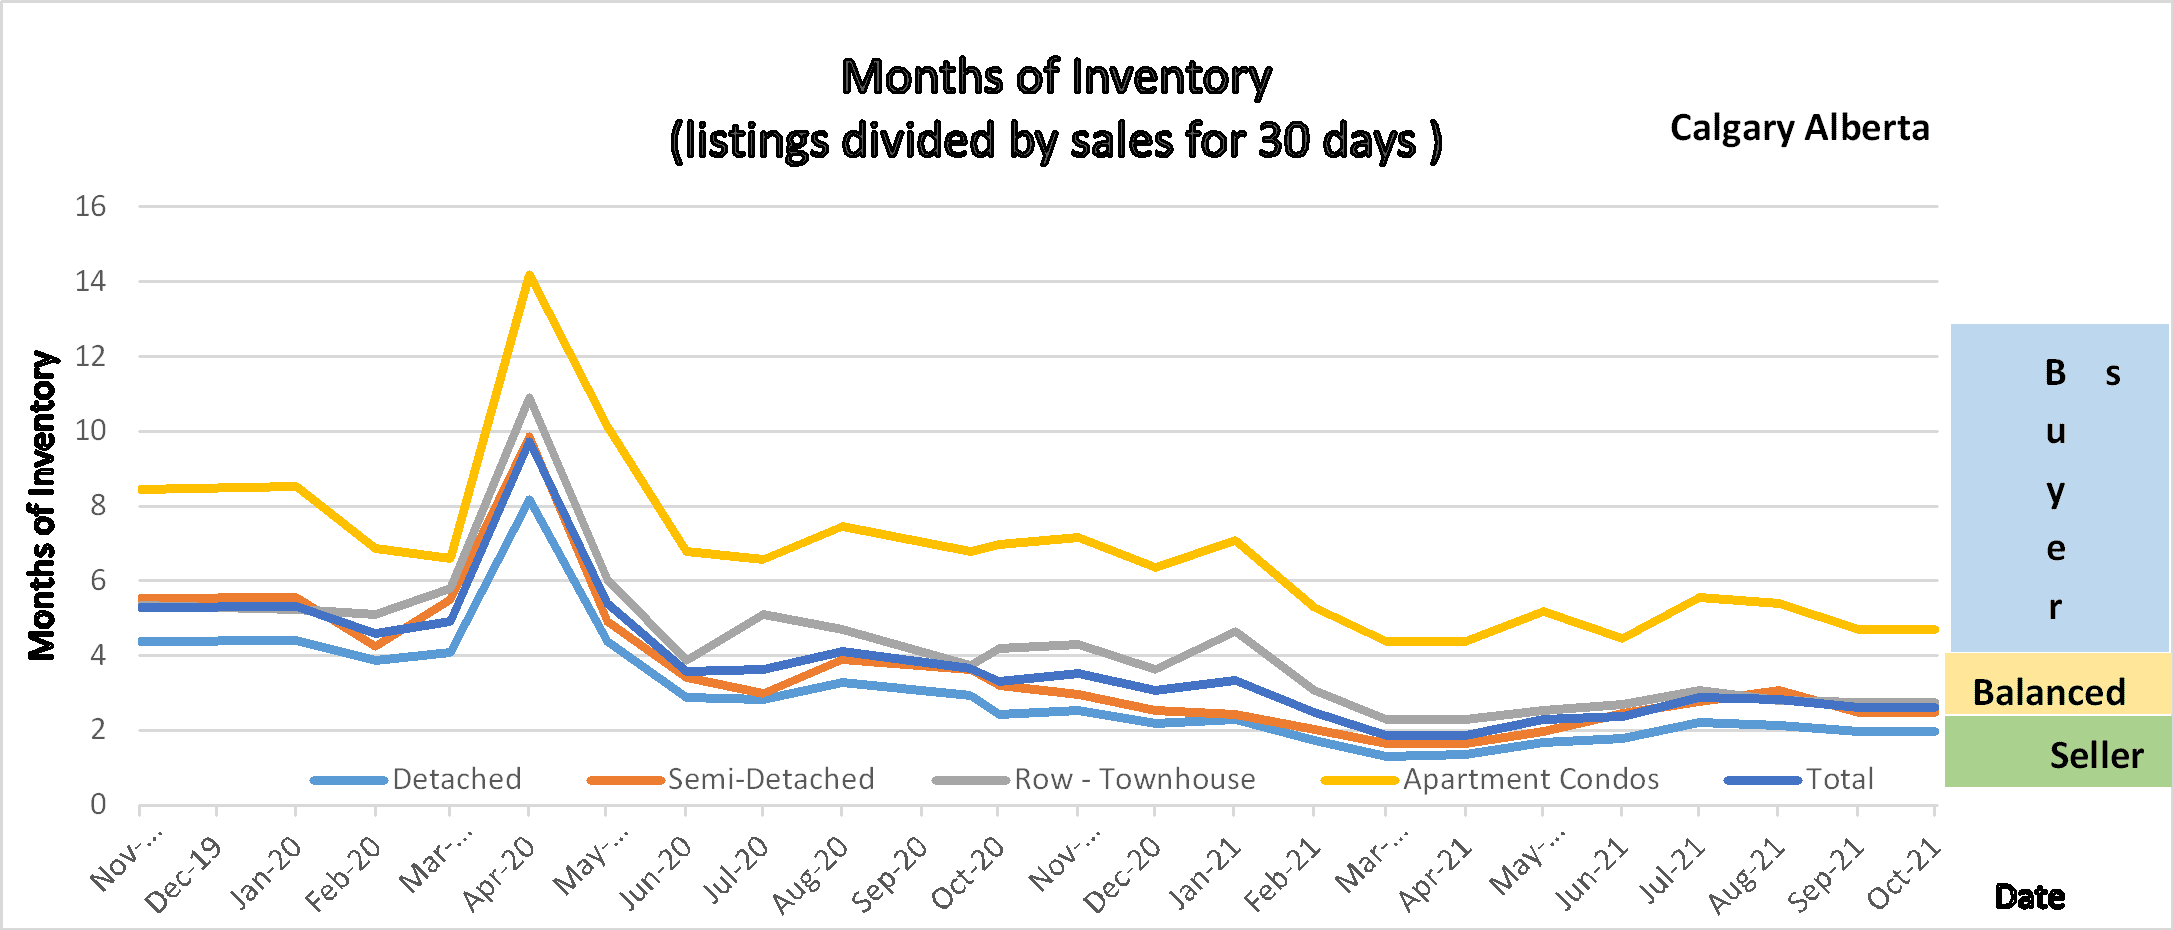
Following is a graph that shows the months of inventory for each housing sector. Looking at a one-year trendline gives you an indication of where things are really heading.
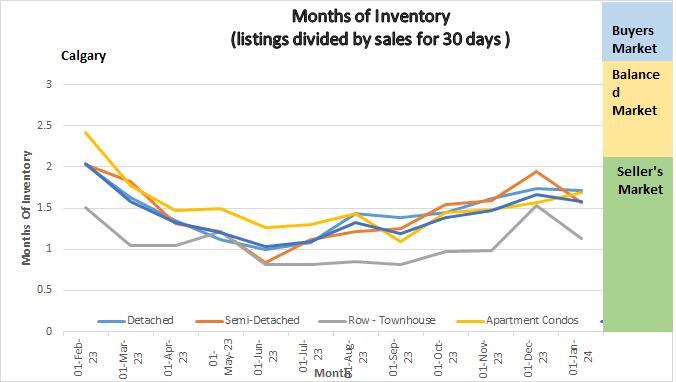
Graph of Months of Inventory
Gord’s commentary for the month (just my opinion).
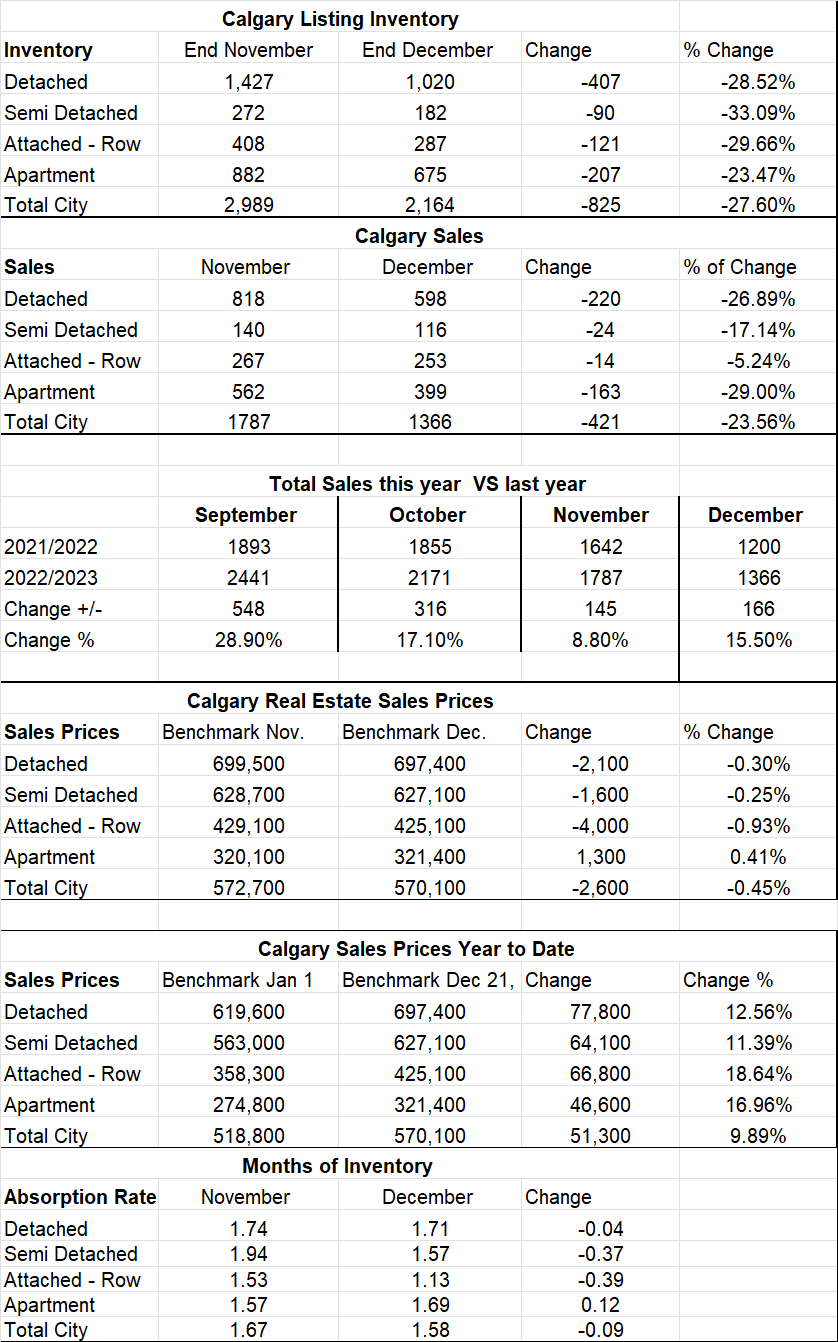
December 2023 Highlights
The Calgary Market remains tight – exceptionally low in supply.
- Sales declined by 11.06%
- Sales are up from last December.
- Prices declined marginally.
- Seller’s market continues….
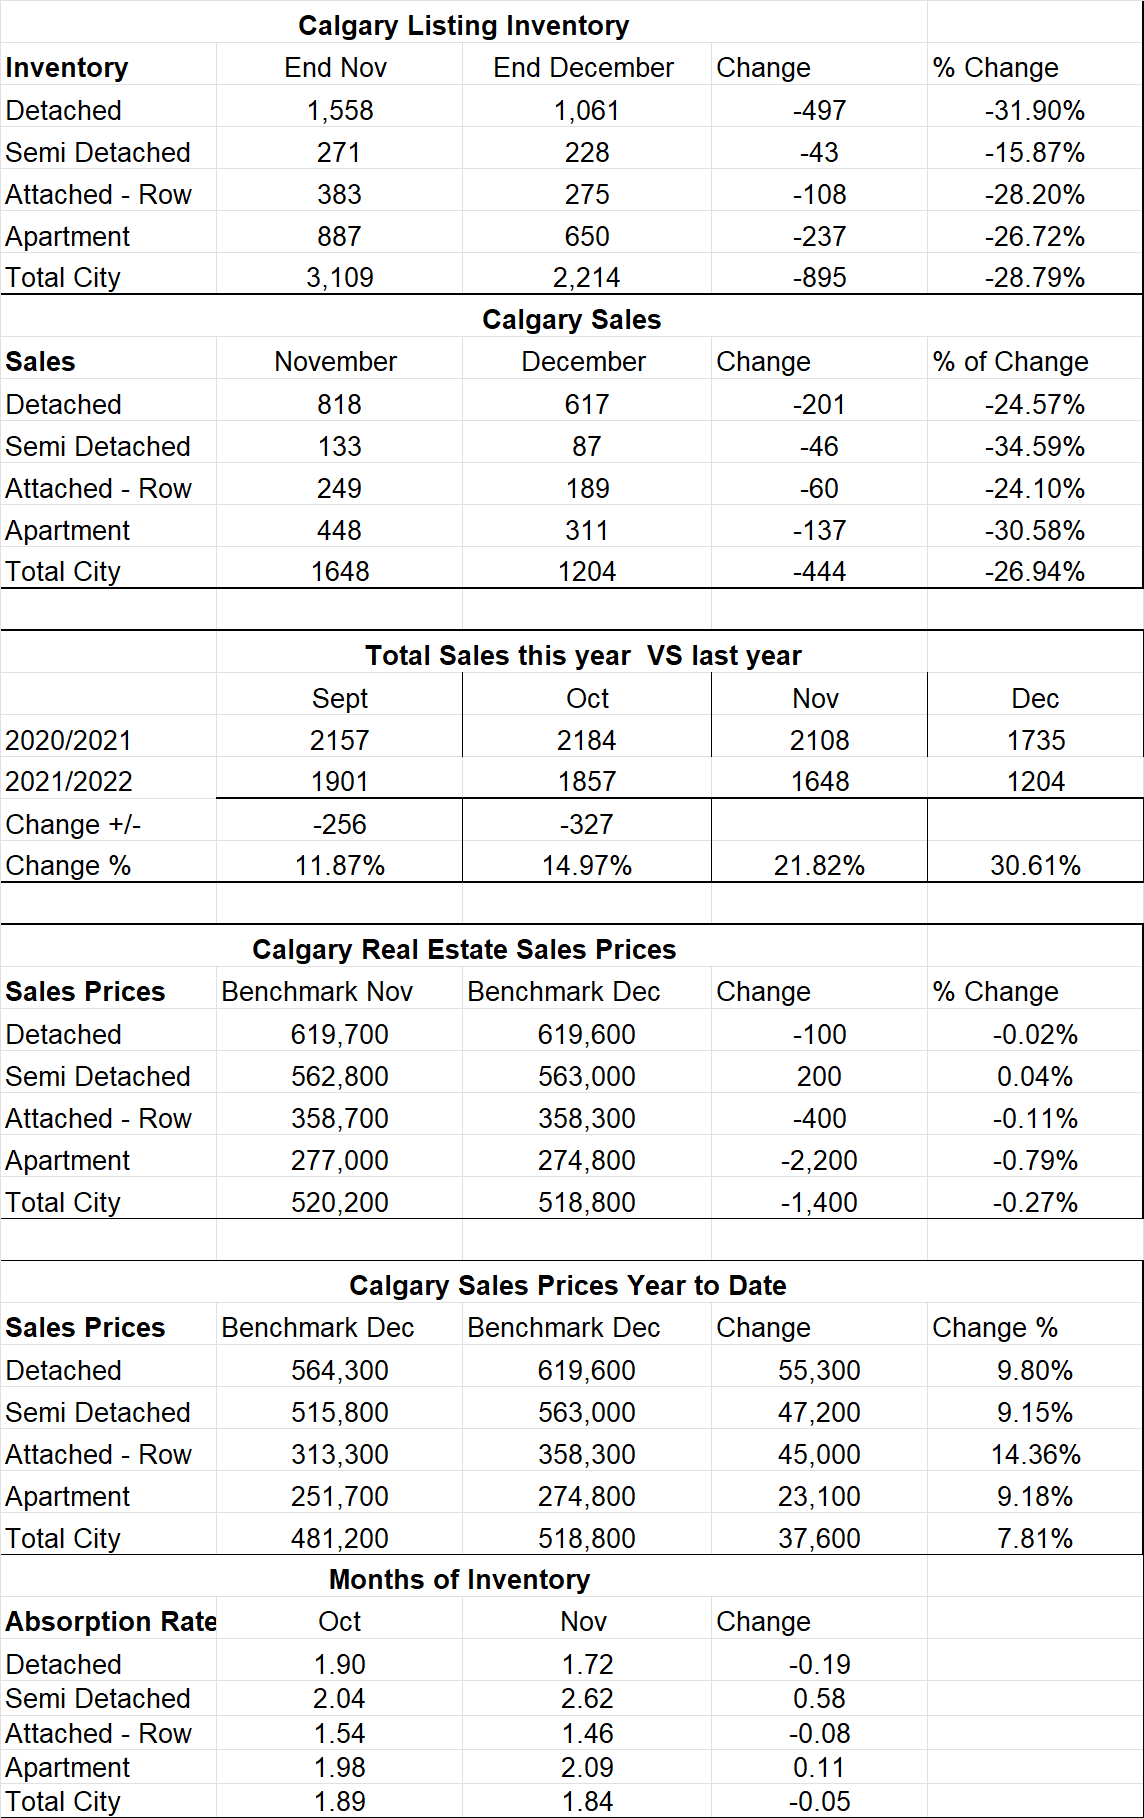
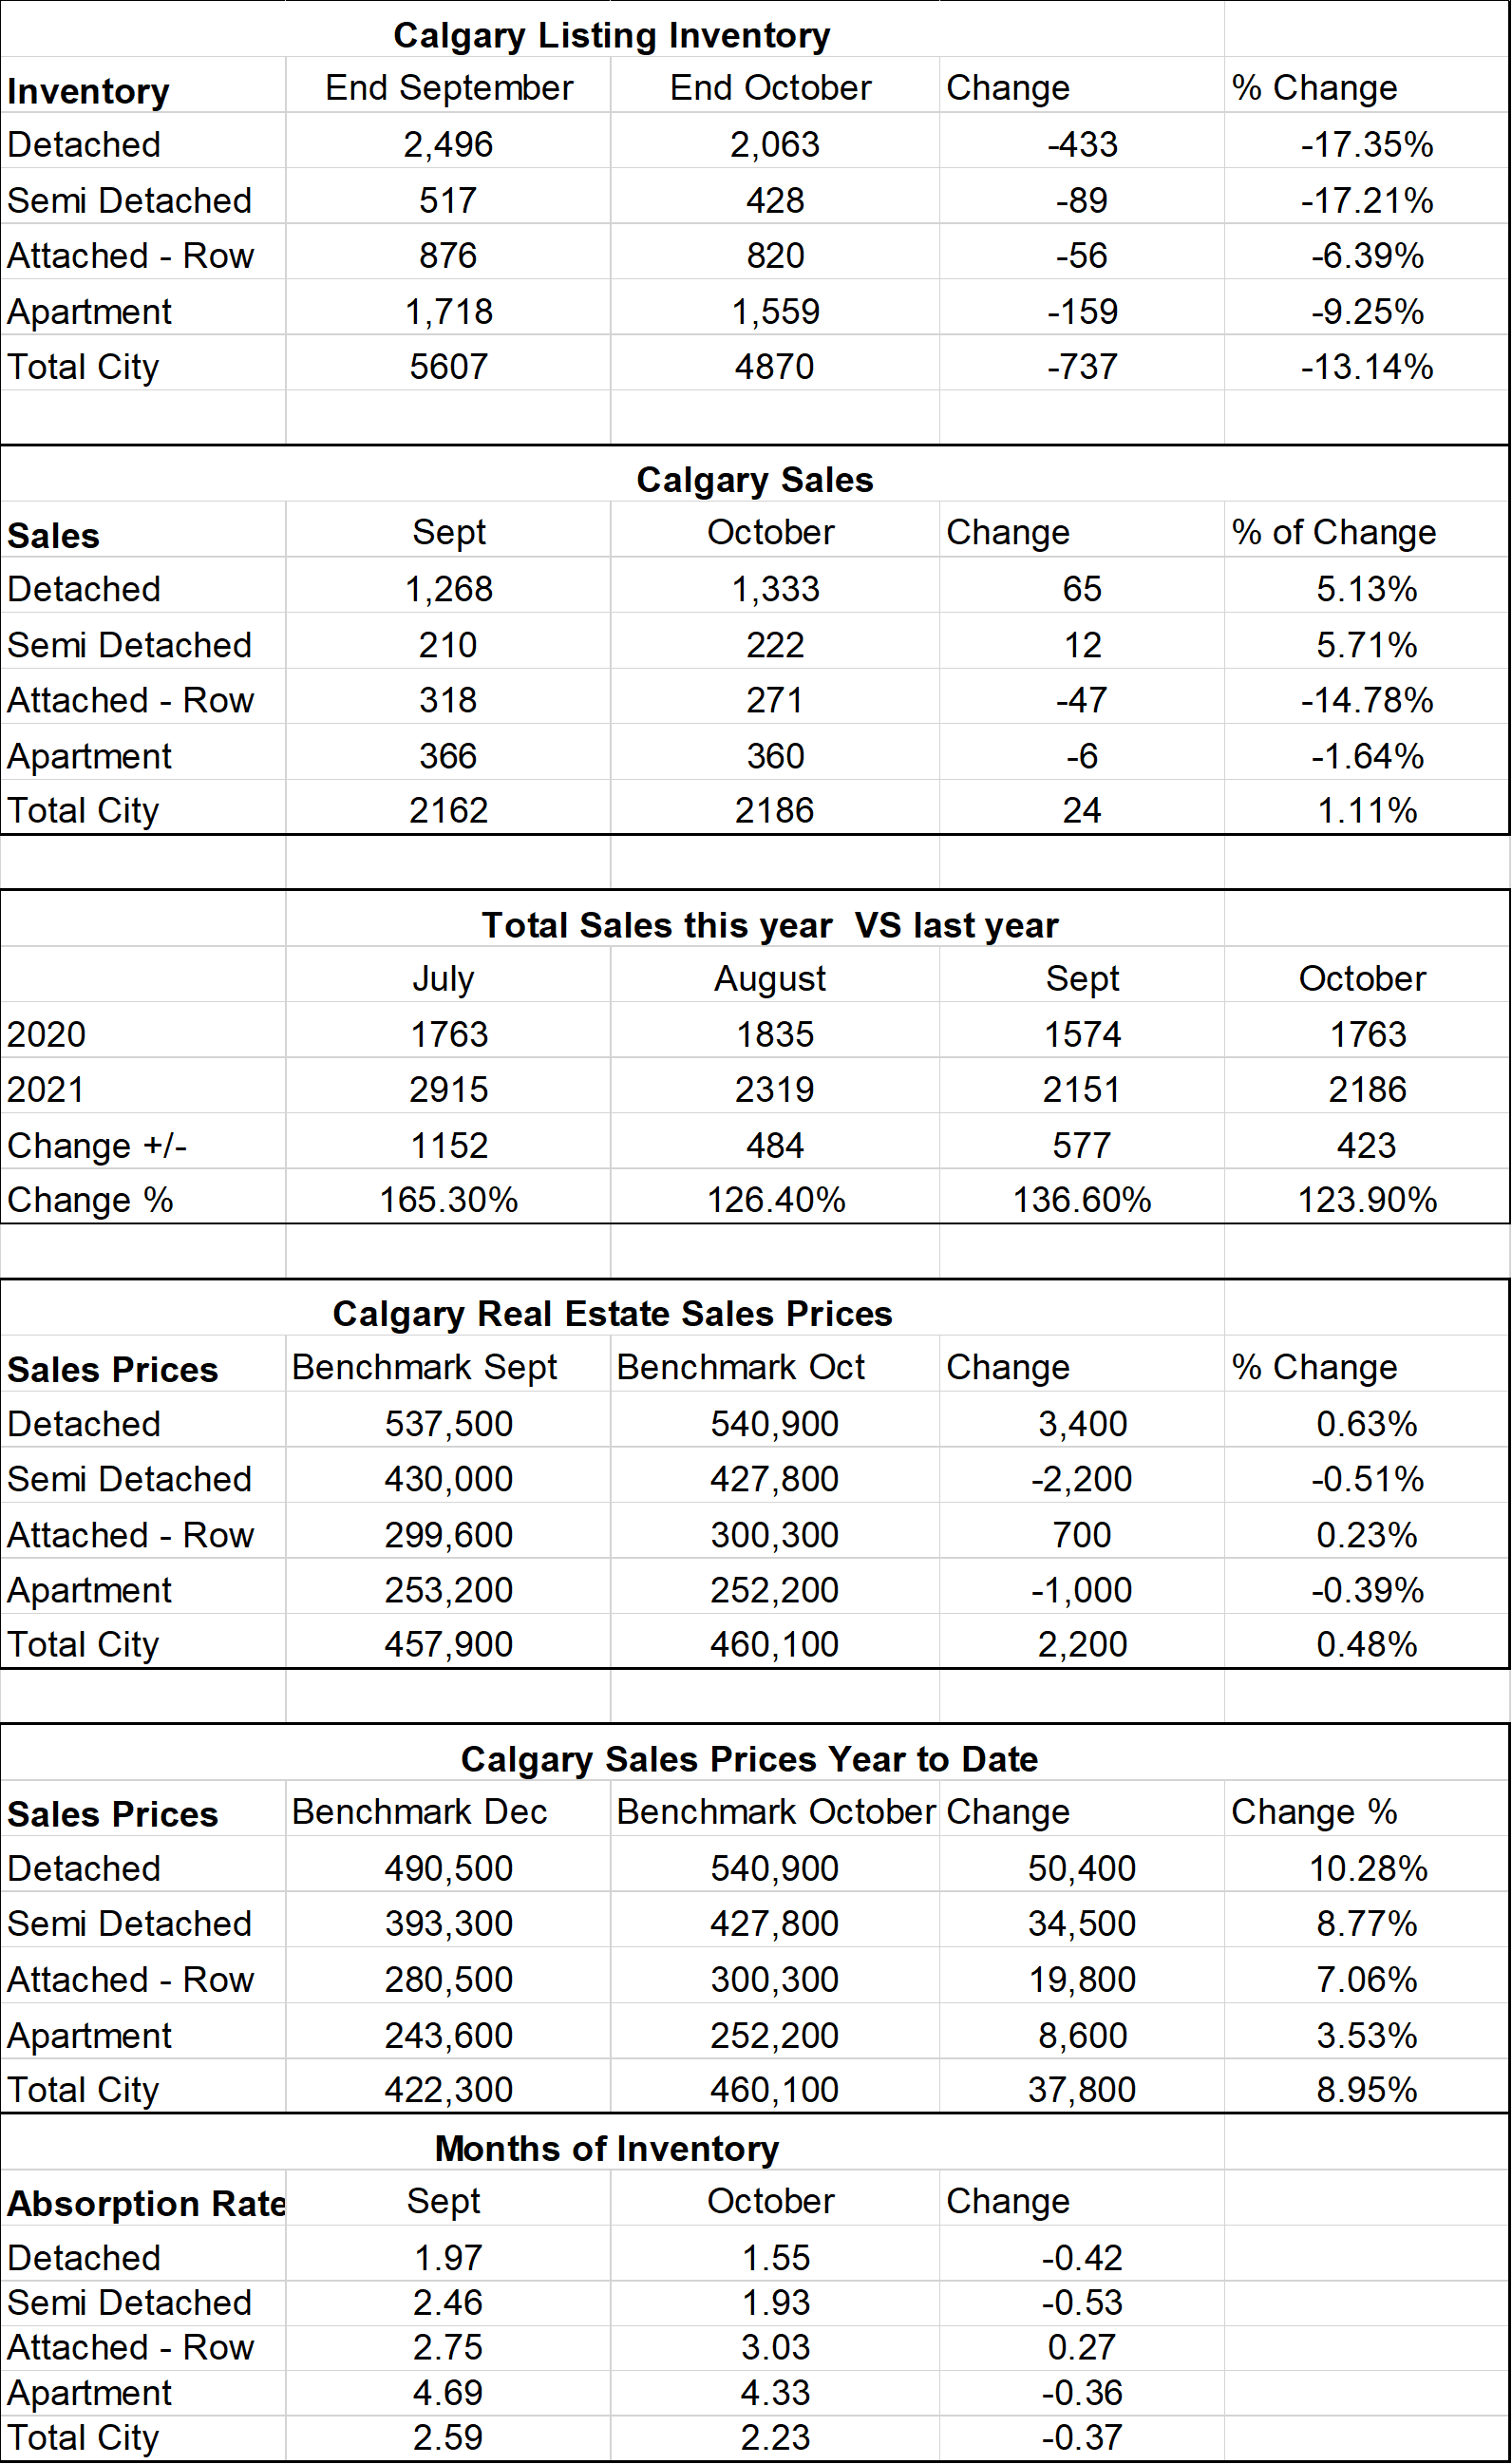
Calgary Listing Inventory
Our listing inventory remains extremely low with a total of 2164 listings on the market. This number decreased by 27.6% from November. It’s important to note that this number is only 55 listings lower than on Dec 31, 2022. It is quite normal that the number of new listings declines at this time of year and I’m confident we will start seeing this number increase.
Calgary Sales:
Sales in December were down by 421 or 23.5% from November. The decreases were somewhat consistent in all sectors. This decline is very normal in December as Holiday celebrations trump Real Estate for many people.
As I have said many times what is keeping our sales down is our Inventory if there were more listings we would certainly sell more. It is interesting to note that Row Houses only decreased by 5.2%
Sales Compared to 2022:
It is also important to look at sales compared to the Previous year. Sales for December were up by 13.8% from last year. The demand is still extraordinarily strong so the more we can list the more we sell.
| Jan | Feb | Mar | Apr | May | June | |
| 2022 | 2004 | 3305 | 4091 | 3401 | 3071 | 2837 |
| 2023 | 1199 | 1740 | 2432 | 2690 | 3120 | 3146 |
| Change | -805 | -1565 | -1659 | -711 | +57 | +309 |
| % Change | -40.1% | -47.4% | -40.55% | -20.9% | +1.9% | +10.9% |
| July | Aug | Sept | Oct | Nov | Dec | |
| 2022 | 2249 | 2133 | 1893 | 1855 | 1642 | 1200 |
| 2023 | 2647 | 2729 | 2441 | 2171 | 1785 | 1366 |
| Change | +398 | +596 | +548 | 316 | 143 | 166 |
| % Change | +17.7% | 27.9% | +28.9% | +17.1% | 8.7% | 13.8% |
Calgary Real Estate Benchmark Sales Prices:
The overall benchmark price decreased by $2,600 this month. The largest decreases were in the Attached-Row sector followed by Detached and then Semi-Detached. Price of Apartment condos increased by $1,300.
Calgary Real Estate Benchmark Year to Date Sales Price: See chart below.
For all of Calgary in 2023, we saw an increase in all sectors of 9.89% or $51,300.
The lowest dollar increase was apartment condos at $46,600 followed by Attached Row at $66,800 then Semi-Detached at $64,100, and the highest sector is Detached homes at $77,800. It is important to note that this is a Calgary number and each community within Calgary will be different – some higher and some lower.
Current Months of Inventory (Absorption Rate):
All sectors except Apartment Condos saw a small decrease in the Months of Inventory. Apartment Condos increased by .12. All sectors remain fairly deep in a seller’s market position.
My Prediction for what is ahead: In 2024, I believe we are going to see more of the same. I know the demand is outpacing the supply by quite a but. What this means if we list more homes then it will increase our Sales not our inventory so we can expect a low inventory throughout 2024. Sales will either stay on pace or increase, and the months of inventory will remain low keeping us in a seller’s market ultimately increasing prices again.
**Below is a summary of numbers in chart form. All numbers are taken from the Calgary Real Estate Boards monthly Stats package.
*All numbers vary by community and price ranges, if you would like stats specifically for your neighbourhood, please contact us.
See Stats from the Calgary Real Estate Market Below
Calgary Real Estate Board Stats