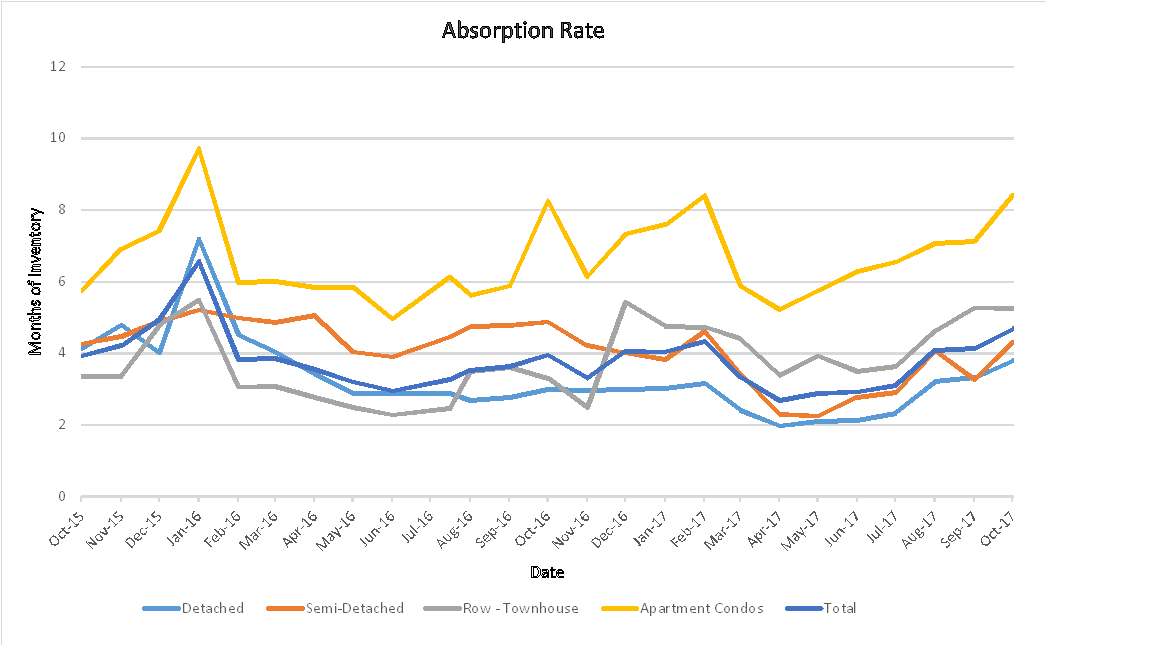
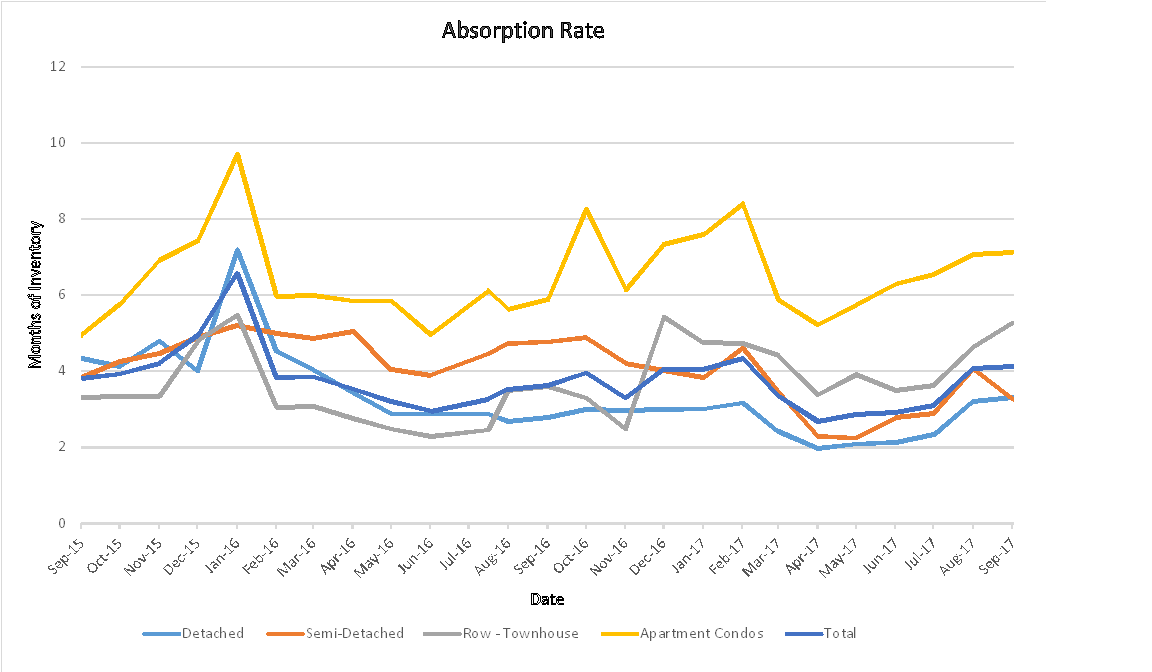
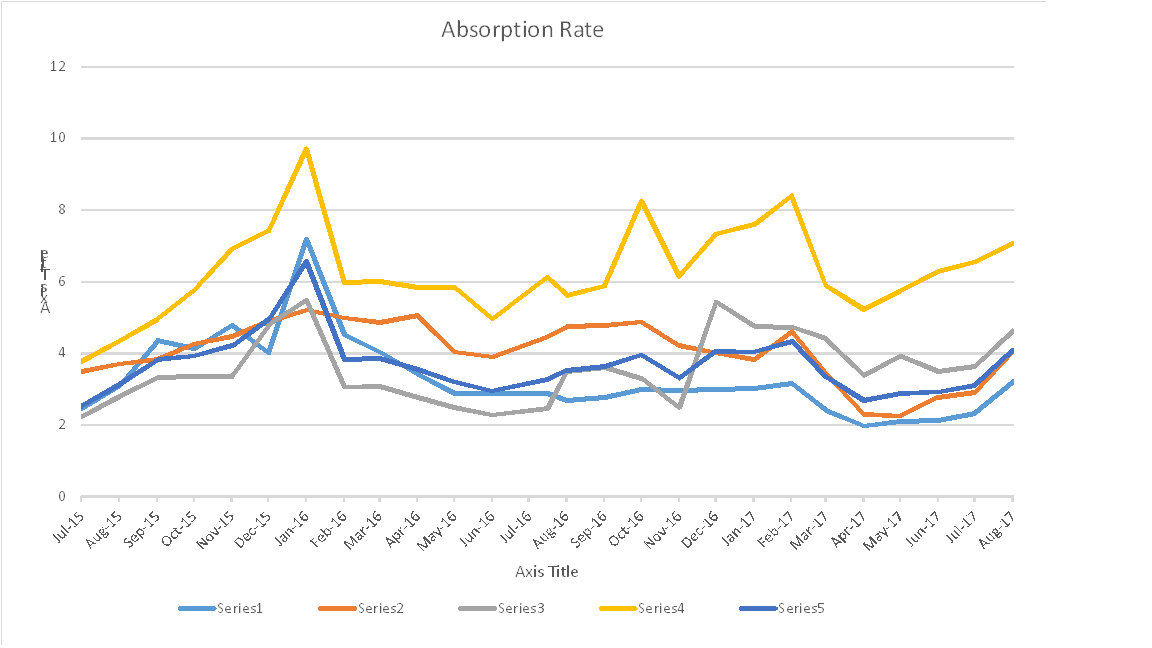
For Sale 132 Harvest Hills Drive

July 27th, 2017

New Listing today.  You don’t often find a bi-level this size, located on a large lot with RV Parking and so well looked after.

MLS:  C4130523

Priced to sell @ $465,000

Request a private viewing here

Beautiful family home on a large lot with RV Parking in the great community of Harvest Hills.  Home has been meticulously maintained and features vaulted ceilings along with many updates over the years.  Not very often do you see a 1361 sq. ft. Bi-level providing over 2450 sq. ft. of developed living space.  Living room features laminate flooring, wood fireplace and a bay window. Dining room is perfect for entertaining a large group.  Kitchen with dining nook is spacious and features a bay window and an island.  Master is spacious and includes a 4 piece ensuite with jetted tub.  Complete the upper level with 2 additional bedrooms and the main bath.  Downstairs offers newer paint and flooring in the spacious Recreation room. Also features a bedroom, hobby room, a 4 piece bath and a workshop.  Oh, you will love the separate Laundry room.  Fantastic backyard with deck, and gate to park your RV and room to easily add a dog run.  Community offers schools and tons of shopping just minutes away.

Going “Green” in Your Garden or Flower Bed

July 21st, 2017

There has been a lot of emphasis lately on the importance of “going green”.  That simply means being environmentally-responsible.  You likely already recycle, use energy-efficient lights, and turn down your thermostat when no one is home. Yet, most of us don’t think about the garden or flower bed when we “think green”.  We should.  Here are a few practical things you can do to tend to outdoor plants — without negatively impacting the environment.

*Pull weeds instead of using a weed killer.

* Avoid strong pesticides. (Products that target only one or two types of insects tend to be less harsh.) There are numerous environmental options available in all stores.

• Don’t use flower bed ornaments (i.e. gnomes) that might bleed colour dye into the soil. (Ask your garden centre before you buy.)

• Be careful not to leave hand spades, trowels, and other garden tools lying around, especially over winter. They can rust, which contaminates the soil.

These tips may seem minor, but if you want to be environmentally conscious, every little bit helps!

Does Your Home Insurance Cover Everything?

July 14th, 2017

When you suffer damage to, (or the loss of), your home or its contents, you expect your insurance company to help you out. And, most do a good job of doing just that.  Still, it’s a good idea to review your policy with your insurance advisor and find out what’s covered and what isn’t. You don’t want to discover that your policy will not cover the cost of repairing the damage caused by a flood in your laundry room.  Pay particular attention to coverage in the case of water damage.  Some insurance policies don’t cover floods and sewer backup unless an additional rider is purchased.  Also, check liability limits.  Ask your advisor to recommend an appropriate level.  Finally, make sure you know exactly how much your home is insured for.  Are you covered for the full replacement cost?  Are you comfortable with that coverage or the actual cash value?  Having the right insurance gives you peace-of-mind and is an important part of enjoying your home. Keep in mind that experts advise you to review your insurance with your advisor.  Ask lots of questions.  Make sure you understand your coverage fully.  By the way, if you’re looking for an insurance advisor, I’m well-connected in the local “home” industry and  I may be able to give you a couple of names of good, reputable professionals. Give me a call.

No Homes for Sale in the Area You Like?

July 11th, 2017

Here’s What to Do…

Imagine there’s a neighborhood you’d love to live in someday, but, every time you drive through, you rarely, if ever, see a For Sale sign.  It’s as if homes get gobbled up by buyers the moment they get listed.  It’s true, properties do tend to sell quickly in desirable, in-demand neighborhoods. Does that mean you’re destined to either hope for a lucky break or miss out on ever living there?  Fortunately, no.  There are practical things you can do to increase your chances of getting into that neighborhood.  Your first step is to find out the kind of new home you can afford. You want to get your financial ducks in a row so when a listing does come up in the area, you’re able to respond quickly.  Find out the average price range of homes in the neighborhood.  Then, if necessary, talk to your lender or mortgage broker.  The second step is to get your current property ready for sale.  You don’t necessary need to list it now, but you want to be in a position to do so quickly, if necessary.  You may need to clean up and declutter, get repairs done, and spruce up your home in other ways.  The third step is to talk to me. You see, listings in popular neighborhoods often move fast. By the time you see them advertised on the internet, they may be gone.  I can closely monitor listings in that area for you, so the moment one comes up that meets your criteria, you can be alerted. I also have access to many listing before they even hit the market.  This greatly increases your chances of getting that home. So if there is a dream neighborhood you’d love to get into, give me a call.

The Magic of Decorative Moulding

July 7th, 2017

Decorative moulding is one of the most eye-catching ways to upgrade a room. You’re probably accustomed to seeing standard baseboard moulding installed where your floor meets the wall. But, there are many other types. For example: • Crown moulding for ceilings. • Panel moulding for a southern colonial look. • Chair rail moulding, which is very distinctive on walls. • Apron moulding for window sills. • Entablature moulding for above doorways. Decorative moulding comes in a dizzying array of styles. Interior designers recommend taking home samples, just as you would take paint swatches, to test out ideas. In addition to style choices, you also need to select the material you prefer. Moulding can be made of wood, plaster, laminate, composite, fiberboard, vinyl and other materials. There are pros and cons to each. Generally, the higher-priced options are more attractive and durable. (If you select wood, you typically have the additional option of “finished or unfinished”. If you choose unfinished, you of course, will be painting it yourself.) Choosing the right moulding for the look you want is the toughest part of the job. Installation is a lot easier and most people with DIY experience have no problems. So if you want to add some magic to your walls, consider decorative moulding. It can turn a room from standard to stunning.

July 1, 2017 Market Snapshot

July 5th, 2017

What is really happening in the Calgary Real Estate Market?

Absorption Rate for 2017


Stay ahead of everyone else by following our Monthly Market Snapshot of the Calgary Real Estate Market This shows what’s really happening! The market is driven by supply and demand so here we show the inventory (supply) and sales (demand) and most importantly the relationship between the two and how it affects the price of Calgary Real Estate.  A simple way to keep up to date with how the market is trending and to stay ahead of most! All numbers are taken from the Calgary Real Estate Boards Stats package for Realtors. I have also included some general comments which are simply my opinion.

Absorption Rate (Months of Inventory)   (the inventory divided by the number of sales in the last month). What does this mean you might ask?

Buyer’s Market >4.0 Drives prices down
Balanced Market Between 2.4 to 4.0 Prices typically remain stable
Seller’s Market <2.4 Drives prices up

___________________________________________________________________________________________________________________________________

Important Disclaimer:   For those who regularly follow my Market Snapshot you may notice the numbers from last month do not jive with the numbers from this month.  It appears to me that the Real Estate Board made some changes to what fits into each category and then made the stats changes retroactive.  This shows up as a large increase in Semi-Detached homes ($39,000) a large decrease in Row homes (14,300) and a decrease in Apartment condos of $5,400.  In my report I am using their new, year to date numbers so you can still see the change from May to June. _____________________________________________________________________________________________________________________________________

*** Absorption Rate

The Absorption rate for June saw all categories increase very slightly.  The highest increase is in the apartment condo market where it increased by .26 which happens to be where we need it the least.

  May  2017 June 2017   Change
Detached 2.13 2.33 0.19
Semi Detached 2.78 2.90 0.12
Attached – Row 3.49 3.63 0.14
Apartment 6.29 6.55 0.26
Total City 2.92 3.11 0.19


Calgary Listing Inventory

In June we saw a fairly large increase in our inventory level. Detached homes were the highest showing an increase of 283 listings.

Inventory May  2017 June 2017  Change
Detached 2941 3224 283
Semi Detached 518 560 42
Attached – Row 949 1001 52
Apartment 1780 1874 94
Total City 6188 6659 471


Calgary Sales:

Can you say consistent?  Sales in June were almost identical in numbers to May. As you can see sales remain strong in the detached sector and weak in the apartment condo sector.

Calgary Sales  May  2017 June 2017  Change % Change
Detached 1378 1385 7 0.51%
Semi Detached 186 193 7 3.76%
Attached – Row 272 276 4 1.47%
Apartment 283 286 3 1.06%
Total City 2119 2140 21 0.99%


Calgary Real Estate Sales Prices:

For June all sectors showed price increased with the exception of Apartment Condos which showed a slight decrease.  I believe that you will continue to see this trend for apartment condos for quite some time as there are several new buildings coming to completion stage and it’s just going to increase our inventory.

  Sales Prices May  2017Benchmark Price          June 2017  Benchmark Price Change
Detached 506,700 509,400 2,700
Semi Detached 427,900 432,100 4,200
Attached – Row 292,400 294,000 1,600
Apartment 266,600 265,800 -800
Total City 439,300 441,500 2,200


Sales Prices “Year to Date”  


Sales Prices Jan 1, 2017    Benchmark Price  June 2017  Benchmark Price Change

$

% Change
Detached 498,700 509,400 10,700 2.15%
Semi Detached 406,800 432,100 25,300 6.22%
Attached – Row 302,600 294,000 -8,600 -2.84%
Apartment 265,000 265,800 800 0.30%
Total City 433,400 441,500 8,100 1.87%

 **Please note that these numbers include only Calgary homes and do change on a community basis and more so for towns.  This report does not include rural properties.  If you would like to find stats on your community just let me know.  If you have any questions about this summary or Real Estate questions please feel free to contact us.


June 1, 2017 Calgary Real Estate Market Snapshot

June 5th, 2017

What’s Happening in the Calgary Real Estate Market? 


Absorption Rate Calgary

What is really happening in the Calgary Real Estate market?

Stay ahead of everyone else by following our Monthly Market Snapshot of the Calgary Real Estate Market This shows what’s really happening! The market is driven by supply and demand so here we show the inventory (supply) and sales (demand) and most importantly the relationship between the two and how it affects the price of Calgary Real Estate.  A simple way to keep up to date with how the market is trending and to stay ahead of most! All numbers are taken from the Calgary Real Estate Boards Stats package for Realtors. I have also included some general comments which are simply my opinion.

Absorption Rate (Months of Inventory)   (the inventory divided by the number of sales in the last month). What does this mean you might ask?

Buyer’s Market >4.0 Drives prices down
Balanced Market Between 2.4 to 4.0 Prices typically remain stable
Seller’s Market <2.4 Drives prices up

*** Absorption Rate June 1, 2017

As you can see below the absorption rates for the different categories did not change substantially in May.

  • Seller’s Market – Detached and Semi-Detached Homes – No change
  • Balanced Market – Row or Townhouses
  • Buyer’s Market – Apartment Condo’s


  April 2017 May  2017 Change
Detached 2.09 2.13 0.04
Semi Detached 2.25 2.78 0.54
Attached – Row 3.92 3.49 -0.43
Apartment 5.74 6.29 0.55
Total City 2.87 2.92 0.05


Calgary Listing Inventory

June  saw an increase in inventory levels in all categories. This is a very normal trend for May and we can expect more increases as we get into the summer months.

Inventory April 2017 May  2017 Change
Detached 2522 2941 419
Semi Detached 463 518 55
Attached – Row 863 949 86
Apartment 1647 1780 133
Total City 5495 6188 693


Calgary Sales:

Both Single family and Attached Row houses saw a large increase in sales this month.  Semi-Detached saw a sizable decrease and apartment condos saw a small decrease.

Calgary Sales   April 2017 May  2017 Change % Change
Detached 1204 1378 174 14.45%
Semi Detached 206 186 -20 -9.71%
Attached – Row 220 272 52 23.64%
Apartment 287 283 -4 -1.39%
Total City 1917 2119 202 10.54%


Calgary Real Estate Sales Prices: 

Wow, this is the first time in a few years that I can say that all categories saw price increases during the month of May.   While this trend seems nice (for homeowners) I cannot see that this can continue.  Detached homes should continue to increase but Apartment condos should not (and should be going down) with the high absorption rate.

  Sales Prices April 2017 Benchmark Price          May  2017 Benchmark Price Change
Detached 504,100 509,000 4,900
Semi Detached 390,200 393,100 2,900
Attached – Row 305,900 308,300 2,400
Apartment 269,200 271,200 2,000
Total City 439,600 443,800 4,200


Sales Prices “Year to Date”   

Sales Prices Jan 1, 2017    Benchmark Price  May  2017 Benchmark Price Change

$

% Change
Detached 498,300 509,000 10,700 2.15%
Semi Detached 385,400 393,100 7,700 2.00%
Attached – Row 307,900 308,300 400 0.13%
Apartment 269,200 271,200 2,000 0.74%
Total City 435,400 443,800 8,400 1.93%

 Clarification

**Please note that these numbers include only Calgary homes and do change on a community basis and more so for towns.  This report does not include rural properties.  If you would like to find stats on your community just let me know.  If you have any questions about this summary or Real Estate questions please feel free to contact us.


New Listing at 401, 4 Hemlock Crescent SW Calgary T3C 2Z1

May 11th, 2017

Stunning, move in ready, Top floor open concept unit with 10 foot ceilings and plenty of upgrades.

List Price: $324,900

MLS C4116027

Watch You Tube Video @ https://youtu.be/aczZ5kHwnIo


May 1, 2017 Calgary Real Estate Market Snapshot

May 2nd, 2017

What is really happening in the Calgary Real Estate market?

Calgary Real Estate Absorption Rate

Stay ahead of everyone else by following our Monthly Market Snapshot of the Calgary Real Estate Market This shows what’s really happening! The market is driven by supply and demand so here we show the inventory (supply) and sales (demand) and most importantly the relationship between the two and how it affects the price of Calgary Real Estate.  A simple way to keep up to date with how the market is trending and to stay ahead of most! All numbers are taken from the Calgary Real Estate Boards Stats package for Realtors. I have also included some general comments which are simply my opinion.

Absorption Rate (Months of Inventory)   (the inventory divided by the number of sales in the last month). What does this mean you might ask?

Buyer’s Market >4.0 Drives prices down
Balanced Market Between 2.4 to 4.0 Prices typically remain stable
Seller’s Market <2.4 Drives prices up

The absorption rate for April remained fairly flat.  Detached homes changes only by .13%.  Semi detached rate decreased by .04% while attached homes and Townhouses both increased by .5% This leaves us in the following market positions:

  • Sellers Market – Detached and Semi-Detached Homes
  • Balanced Market – Row or Townhouses
  • Buyers Market – Apartment Condo’s
  March 2017 April 2017 Change
Detached 1.97 2.09 0.13
Semi Detached 2.29 2.25 -0.04
Attached – Row 3.38 3.92 0.54
Apartment 5.22 5.74 0.52
Total City 2.68 2.87 0.18


Calgary Listing Inventory

April saw a slight increase in our inventory level in all categories except Semi Detached which remained even.  Increasing inventory is a normal pattern for April as we are approaching the spring market.  Expect our inventory to continue to increase over the next few months.

Inventory March 2017 April 2017 Change
Detached 2312 2522 210
Semi Detached 463 463 0
Attached – Row 764 863 99
Apartment 1575 1647 72
Total City 5114 5495 381

Calgary Sales:

All categories remained flat in sales. Overall we had 11 more sales in April then in March. This again is a fairly normal pattern and I expect this number to start to increase as buyers tend to come out once spring starts to arrive. We are starting to see lots of competing offers again in the detached market.

Calgary Sales   March 2017 April 2017 Change % Change
Detached 1176 1204 28 2.38%
Semi Detached 202 206 4 1.98%
Attached – Row 226 220 -6 -2.65%
Apartment 302 287 -15 -4.97%
Total City 1906 1917 11 0.58%


Calgary Real Estate Sales Prices: 

Prices this month increased marginally in all categories except for Apartment Condos which went down by $500. The increases in the Detached and Semi Detached homes were small and Row Houses actually increased by $1800.  Based on the absorption rate I believe you will continue to see increases in all Detached and Semi Detached Homes, prices should remain flat for Attached-Row houses and a slight decline in apartment condos which are still very much in a buyer’s market position.

  Sales Prices March 2017   2016 Benchmark Price          April 2017 Benchmark Price Change
Detached 503,900 504,100 200
Semi Detached 389,600 390,200 600
Attached – Row 304,100 305,900 1,800
Apartment 269,700 269,200 -500
Total City 439,400 439,600 200


Sales Prices “Year to Date”   

Sales Prices Jan 1, 2017    Benchmark Price  April  2017 Benchmark Price Change

$

% Change
Detached 498,300 504,100 5,800 1.16%
Semi Detached 385,400 390,200 4,800 1.25%
Attached – Row 307,900 305,900 -2,000 -0.65%
Apartment 269,200 269,200 0 0.00%
Total City 435,400 439,600 4,200 0.96%


Price Notes 

**Please note that these numbers include only Calgary homes and do change on a community basis and more so for towns.  This report does not include rural properties.  If you would like to find stats on your community just let me know.  If you have any questions about this summary or Real Estate questions please feel free to contact us.


Just listed – Tuscany Townhouse

April 20th, 2017

Check out our new listing at 260 Tuscany Springs Blvd – Steps away from the Tuscany LRT Station.

C4111224

List Price: $325,000 – Perfect starter home or ideal for an investor.

Ideal for first time buyer or investors, reduce your commute time, just steps to Tuscany LRT.   This bright beautiful home features an open concept, newer appliances, and newer paint, Hunter Douglas Blinds, Vacuum System and Water Filtration System.  On the main floor you will enjoy the cozy living room, dining room and a spacious kitchen that boasts plenty of counter/cabinet space and a breakfast bar.  Main floor also features a 2 piece bath and a door to your patio and fenced back. Upstairs you will find 2 spacious bedrooms both with ensuite baths and one with a walk in closet.  The basement is perfect for laundry and storage and leads into your oversized garage with plenty of room for additional storage.  Location is ideal, just steps to the Tuscany LRT Station. Enjoy the many amenities provided in Tuscany with walking paths, ravine, and excellent transit access, Sobeys, Schools and only a 5 minute drive to crowfoot for your larger shopping trips.