When you suffer damage to, (or the loss of), your home or its contents, you expect your insurance company to help you out. And, most do a good job of doing just that. Still, it’s a good idea to review your policy with your insurance advisor and find out what’s covered and what isn’t. You don’t want to discover that your policy will not cover the cost of repairing the damage caused by a flood in your laundry room. Pay particular attention to coverage in the case of water damage. Some insurance policies don’t cover floods and sewer backup unless an additional rider is purchased. Also, check liability limits. Ask your advisor to recommend an appropriate level. Finally, make sure you know exactly how much your home is insured for. Are you covered for the full replacement cost? Are you comfortable with that coverage or the actual cash value? Having the right insurance gives you peace-of-mind and is an important part of enjoying your home. Keep in mind that experts advise you to review your insurance with your advisor. Ask lots of questions. Make sure you understand your coverage fully. By the way, if you’re looking for an insurance advisor, I’m well-connected in the local “home” industry and I may be able to give you a couple of names of good, reputable professionals. Give me a call.
Does Your Home Insurance Cover Everything?
July 14th, 2017July 1, 2017 Market Snapshot
July 5th, 2017What is really happening in the Calgary Real Estate Market?
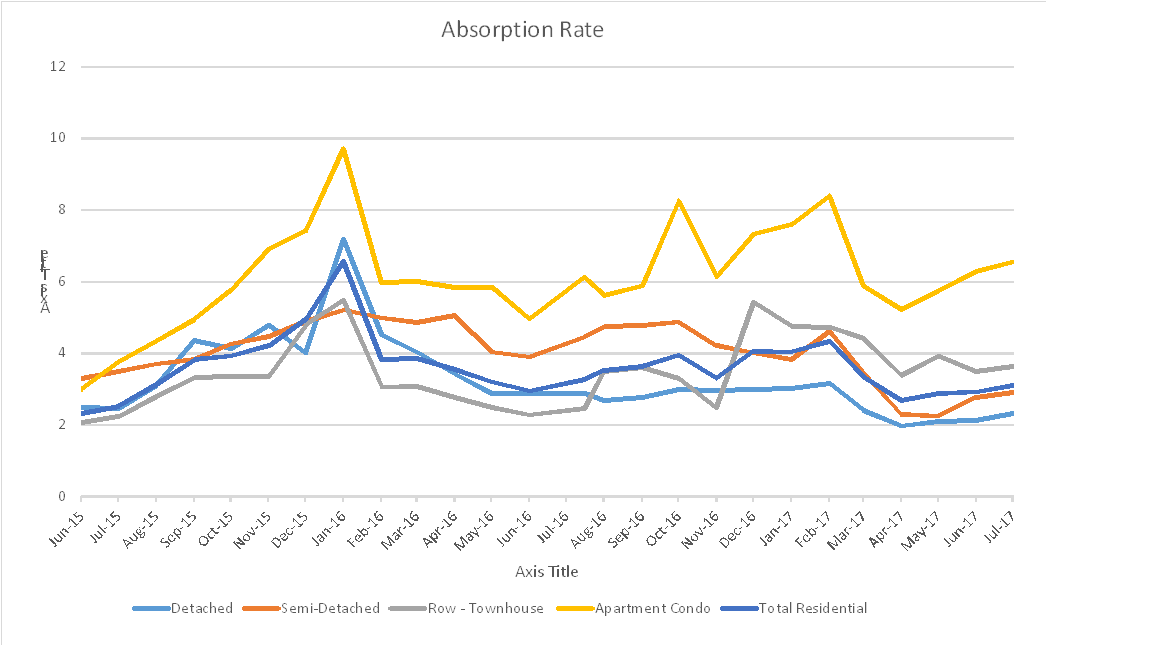
Absorption Rate for 2017
Stay ahead of everyone else by following our Monthly Market Snapshot of the Calgary Real Estate Market This shows what’s really happening! The market is driven by supply and demand so here we show the inventory (supply) and sales (demand) and most importantly the relationship between the two and how it affects the price of Calgary Real Estate. A simple way to keep up to date with how the market is trending and to stay ahead of most! All numbers are taken from the Calgary Real Estate Boards Stats package for Realtors. I have also included some general comments which are simply my opinion.
Absorption Rate (Months of Inventory) (the inventory divided by the number of sales in the last month). What does this mean you might ask?
| Buyer’s Market | >4.0 | Drives prices down |
| Balanced Market | Between 2.4 to 4.0 | Prices typically remain stable |
| Seller’s Market | <2.4 | Drives prices up |
___________________________________________________________________________________________________________________________________
Important Disclaimer: For those who regularly follow my Market Snapshot you may notice the numbers from last month do not jive with the numbers from this month. It appears to me that the Real Estate Board made some changes to what fits into each category and then made the stats changes retroactive. This shows up as a large increase in Semi-Detached homes ($39,000) a large decrease in Row homes (14,300) and a decrease in Apartment condos of $5,400. In my report I am using their new, year to date numbers so you can still see the change from May to June. _____________________________________________________________________________________________________________________________________
*** Absorption Rate
The Absorption rate for June saw all categories increase very slightly. The highest increase is in the apartment condo market where it increased by .26 which happens to be where we need it the least.
| May 2017 | June 2017 | Change | |
| Detached | 2.13 | 2.33 | 0.19 |
| Semi Detached | 2.78 | 2.90 | 0.12 |
| Attached – Row | 3.49 | 3.63 | 0.14 |
| Apartment | 6.29 | 6.55 | 0.26 |
| Total City | 2.92 | 3.11 | 0.19 |
Calgary Listing Inventory
In June we saw a fairly large increase in our inventory level. Detached homes were the highest showing an increase of 283 listings.
| Inventory | May 2017 | June 2017 | Change |
| Detached | 2941 | 3224 | 283 |
| Semi Detached | 518 | 560 | 42 |
| Attached – Row | 949 | 1001 | 52 |
| Apartment | 1780 | 1874 | 94 |
| Total City | 6188 | 6659 | 471 |
Calgary Sales:
Can you say consistent? Sales in June were almost identical in numbers to May. As you can see sales remain strong in the detached sector and weak in the apartment condo sector.
| Calgary Sales | May 2017 | June 2017 | Change | % Change |
| Detached | 1378 | 1385 | 7 | 0.51% |
| Semi Detached | 186 | 193 | 7 | 3.76% |
| Attached – Row | 272 | 276 | 4 | 1.47% |
| Apartment | 283 | 286 | 3 | 1.06% |
| Total City | 2119 | 2140 | 21 | 0.99% |
Calgary Real Estate Sales Prices:
For June all sectors showed price increased with the exception of Apartment Condos which showed a slight decrease. I believe that you will continue to see this trend for apartment condos for quite some time as there are several new buildings coming to completion stage and it’s just going to increase our inventory.
| Sales Prices | May 2017Benchmark Price | June 2017 Benchmark Price | Change |
| Detached | 506,700 | 509,400 | 2,700 |
| Semi Detached | 427,900 | 432,100 | 4,200 |
| Attached – Row | 292,400 | 294,000 | 1,600 |
| Apartment | 266,600 | 265,800 | -800 |
| Total City | 439,300 | 441,500 | 2,200 |
Sales Prices “Year to Date”
| Sales Prices | Jan 1, 2017 Benchmark Price | June 2017 Benchmark Price | Change
$ |
% Change |
| Detached | 498,700 | 509,400 | 10,700 | 2.15% |
| Semi Detached | 406,800 | 432,100 | 25,300 | 6.22% |
| Attached – Row | 302,600 | 294,000 | -8,600 | -2.84% |
| Apartment | 265,000 | 265,800 | 800 | 0.30% |
| Total City | 433,400 | 441,500 | 8,100 | 1.87% |
**Please note that these numbers include only Calgary homes and do change on a community basis and more so for towns. This report does not include rural properties. If you would like to find stats on your community just let me know. If you have any questions about this summary or Real Estate questions please feel free to contact us.
June 1, 2017 Calgary Real Estate Market Snapshot
June 5th, 2017What’s Happening in the Calgary Real Estate Market?

Absorption Rate Calgary
What is really happening in the Calgary Real Estate market?
Stay ahead of everyone else by following our Monthly Market Snapshot of the Calgary Real Estate Market This shows what’s really happening! The market is driven by supply and demand so here we show the inventory (supply) and sales (demand) and most importantly the relationship between the two and how it affects the price of Calgary Real Estate. A simple way to keep up to date with how the market is trending and to stay ahead of most! All numbers are taken from the Calgary Real Estate Boards Stats package for Realtors. I have also included some general comments which are simply my opinion.
Absorption Rate (Months of Inventory) (the inventory divided by the number of sales in the last month). What does this mean you might ask?
| Buyer’s Market | >4.0 | Drives prices down |
| Balanced Market | Between 2.4 to 4.0 | Prices typically remain stable |
| Seller’s Market | <2.4 | Drives prices up |
*** Absorption Rate June 1, 2017
As you can see below the absorption rates for the different categories did not change substantially in May.
- Seller’s Market – Detached and Semi-Detached Homes – No change
- Balanced Market – Row or Townhouses
- Buyer’s Market – Apartment Condo’s
| April 2017 | May 2017 | Change | |
| Detached | 2.09 | 2.13 | 0.04 |
| Semi Detached | 2.25 | 2.78 | 0.54 |
| Attached – Row | 3.92 | 3.49 | -0.43 |
| Apartment | 5.74 | 6.29 | 0.55 |
| Total City | 2.87 | 2.92 | 0.05 |
Calgary Listing Inventory
June saw an increase in inventory levels in all categories. This is a very normal trend for May and we can expect more increases as we get into the summer months.
| Inventory | April 2017 | May 2017 | Change |
| Detached | 2522 | 2941 | 419 |
| Semi Detached | 463 | 518 | 55 |
| Attached – Row | 863 | 949 | 86 |
| Apartment | 1647 | 1780 | 133 |
| Total City | 5495 | 6188 | 693 |
Calgary Sales:
Both Single family and Attached Row houses saw a large increase in sales this month. Semi-Detached saw a sizable decrease and apartment condos saw a small decrease.
| Calgary Sales | April 2017 | May 2017 | Change | % Change |
| Detached | 1204 | 1378 | 174 | 14.45% |
| Semi Detached | 206 | 186 | -20 | -9.71% |
| Attached – Row | 220 | 272 | 52 | 23.64% |
| Apartment | 287 | 283 | -4 | -1.39% |
| Total City | 1917 | 2119 | 202 | 10.54% |
Calgary Real Estate Sales Prices:
Wow, this is the first time in a few years that I can say that all categories saw price increases during the month of May. While this trend seems nice (for homeowners) I cannot see that this can continue. Detached homes should continue to increase but Apartment condos should not (and should be going down) with the high absorption rate.
| Sales Prices | April 2017 Benchmark Price | May 2017 Benchmark Price | Change |
| Detached | 504,100 | 509,000 | 4,900 |
| Semi Detached | 390,200 | 393,100 | 2,900 |
| Attached – Row | 305,900 | 308,300 | 2,400 |
| Apartment | 269,200 | 271,200 | 2,000 |
| Total City | 439,600 | 443,800 | 4,200 |
Sales Prices “Year to Date”
| Sales Prices | Jan 1, 2017 Benchmark Price | May 2017 Benchmark Price | Change
$ |
% Change |
| Detached | 498,300 | 509,000 | 10,700 | 2.15% |
| Semi Detached | 385,400 | 393,100 | 7,700 | 2.00% |
| Attached – Row | 307,900 | 308,300 | 400 | 0.13% |
| Apartment | 269,200 | 271,200 | 2,000 | 0.74% |
| Total City | 435,400 | 443,800 | 8,400 | 1.93% |
Clarification
**Please note that these numbers include only Calgary homes and do change on a community basis and more so for towns. This report does not include rural properties. If you would like to find stats on your community just let me know. If you have any questions about this summary or Real Estate questions please feel free to contact us.
New Listing at 401, 4 Hemlock Crescent SW Calgary T3C 2Z1
May 11th, 2017Stunning, move in ready, Top floor open concept unit with 10 foot ceilings and plenty of upgrades.
List Price: $324,900
MLS C4116027
Watch You Tube Video @ https://youtu.be/aczZ5kHwnIo


May 1, 2017 Calgary Real Estate Market Snapshot
May 2nd, 2017What is really happening in the Calgary Real Estate market?

Calgary Real Estate Absorption Rate
Stay ahead of everyone else by following our Monthly Market Snapshot of the Calgary Real Estate Market This shows what’s really happening! The market is driven by supply and demand so here we show the inventory (supply) and sales (demand) and most importantly the relationship between the two and how it affects the price of Calgary Real Estate. A simple way to keep up to date with how the market is trending and to stay ahead of most! All numbers are taken from the Calgary Real Estate Boards Stats package for Realtors. I have also included some general comments which are simply my opinion.
Absorption Rate (Months of Inventory) (the inventory divided by the number of sales in the last month). What does this mean you might ask?
| Buyer’s Market | >4.0 | Drives prices down |
| Balanced Market | Between 2.4 to 4.0 | Prices typically remain stable |
| Seller’s Market | <2.4 | Drives prices up |
The absorption rate for April remained fairly flat. Detached homes changes only by .13%. Semi detached rate decreased by .04% while attached homes and Townhouses both increased by .5% This leaves us in the following market positions:
- Sellers Market – Detached and Semi-Detached Homes
- Balanced Market – Row or Townhouses
- Buyers Market – Apartment Condo’s
| March 2017 | April 2017 | Change | |
| Detached | 1.97 | 2.09 | 0.13 |
| Semi Detached | 2.29 | 2.25 | -0.04 |
| Attached – Row | 3.38 | 3.92 | 0.54 |
| Apartment | 5.22 | 5.74 | 0.52 |
| Total City | 2.68 | 2.87 | 0.18 |
Calgary Listing Inventory
April saw a slight increase in our inventory level in all categories except Semi Detached which remained even. Increasing inventory is a normal pattern for April as we are approaching the spring market. Expect our inventory to continue to increase over the next few months.
| Inventory | March 2017 | April 2017 | Change |
| Detached | 2312 | 2522 | 210 |
| Semi Detached | 463 | 463 | 0 |
| Attached – Row | 764 | 863 | 99 |
| Apartment | 1575 | 1647 | 72 |
| Total City | 5114 | 5495 | 381 |
Calgary Sales:
All categories remained flat in sales. Overall we had 11 more sales in April then in March. This again is a fairly normal pattern and I expect this number to start to increase as buyers tend to come out once spring starts to arrive. We are starting to see lots of competing offers again in the detached market.
| Calgary Sales | March 2017 | April 2017 | Change | % Change |
| Detached | 1176 | 1204 | 28 | 2.38% |
| Semi Detached | 202 | 206 | 4 | 1.98% |
| Attached – Row | 226 | 220 | -6 | -2.65% |
| Apartment | 302 | 287 | -15 | -4.97% |
| Total City | 1906 | 1917 | 11 | 0.58% |
Calgary Real Estate Sales Prices:
Prices this month increased marginally in all categories except for Apartment Condos which went down by $500. The increases in the Detached and Semi Detached homes were small and Row Houses actually increased by $1800. Based on the absorption rate I believe you will continue to see increases in all Detached and Semi Detached Homes, prices should remain flat for Attached-Row houses and a slight decline in apartment condos which are still very much in a buyer’s market position.
| Sales Prices | March 2017 2016 Benchmark Price | April 2017 Benchmark Price | Change |
| Detached | 503,900 | 504,100 | 200 |
| Semi Detached | 389,600 | 390,200 | 600 |
| Attached – Row | 304,100 | 305,900 | 1,800 |
| Apartment | 269,700 | 269,200 | -500 |
| Total City | 439,400 | 439,600 | 200 |
Sales Prices “Year to Date”
| Sales Prices | Jan 1, 2017 Benchmark Price | April 2017 Benchmark Price | Change
$ |
% Change |
| Detached | 498,300 | 504,100 | 5,800 | 1.16% |
| Semi Detached | 385,400 | 390,200 | 4,800 | 1.25% |
| Attached – Row | 307,900 | 305,900 | -2,000 | -0.65% |
| Apartment | 269,200 | 269,200 | 0 | 0.00% |
| Total City | 435,400 | 439,600 | 4,200 | 0.96% |
Price Notes
**Please note that these numbers include only Calgary homes and do change on a community basis and more so for towns. This report does not include rural properties. If you would like to find stats on your community just let me know. If you have any questions about this summary or Real Estate questions please feel free to contact us.
Just listed – Tuscany Townhouse
April 20th, 2017Check out our new listing at 260 Tuscany Springs Blvd – Steps away from the Tuscany LRT Station.
C4111224
List Price: $325,000 – Perfect starter home or ideal for an investor.

Ideal for first time buyer or investors, reduce your commute time, just steps to Tuscany LRT. This bright beautiful home features an open concept, newer appliances, and newer paint, Hunter Douglas Blinds, Vacuum System and Water Filtration System. On the main floor you will enjoy the cozy living room, dining room and a spacious kitchen that boasts plenty of counter/cabinet space and a breakfast bar. Main floor also features a 2 piece bath and a door to your patio and fenced back. Upstairs you will find 2 spacious bedrooms both with ensuite baths and one with a walk in closet. The basement is perfect for laundry and storage and leads into your oversized garage with plenty of room for additional storage. Location is ideal, just steps to the Tuscany LRT Station. Enjoy the many amenities provided in Tuscany with walking paths, ravine, and excellent transit access, Sobeys, Schools and only a 5 minute drive to crowfoot for your larger shopping trips.
72 Bridlewood View Calgary Alberta T2Y 3X7
April 12th, 2017Check out our new listing at 72 Bridlewood View!
MLS C4109975
List Price: $335,000
Video : https://youtu.be/8PscOuWGsus

Beautiful 1445 Square foot, 3 bedroom, end unit, walk-out townhouse that has been extremely well maintained. Features hardwood flooring throughout main, Granite countertops in kitchen, new paint throughout and central vacuum. Main floor boasts 9 foot ceilings, an open floorplan, 2 piece bath, kitchen with granite counter tops, eating bar and stainless steel appliances, spacious dining room and living room with corner gas fireplace. Upstairs you will find laundry, main bath, 2 good sized bedrooms and a large master with 4 piece ensuite, walk in closet and fantastic city views. Downstairs is a fully developed walk-out and features a living area, storage area and 2 piece bath. Don’t forget the single attached garage all in the desired community of Bridlewood.
Do I need a Real Property Report to sell my home?
March 31st, 2017If you live in Alberta the answer is yes if you own a detached home, an attached home or a Bare land Condominium you will need a Real Property Report with compliance. If you own a conventional Condo then you do not need a Real Property Report.
What is a Real Property Report?
A Real Property Report is a legal document that clearly illustrates the locations of significant visible improvements relative to the property boundaries. It is a land survey that shows where the buildings are located and it shows the property lines. A Real Property report will show if there are any encroachments onto City of Calgary property or your neighbour’s property. The survey must be completed by an Alberta Land Surveyor. An Example of a Real Property Report

Real Property Report Sample
Compliance
Once you have your Real Property Report completed you then have to take it to the City of Calgary and have them review it. They look for encroachments, setbacks being met and many other problems. If it meets all of the City’s criteria they will give you (for a fee) a stamp of compliance.
I do not know of one lawyer in Calgary that will close a Real Estate sale without a current Real Property Report. When you are signing the papers at the lawyers you will be required to sign a document stating that the Real Property Report reflects the current state of the property.
Sometimes the mortgage lender will ask for a land survey, especially if your property is older and hasn’t changed hands in many years. You might also be asked for one by the buyer if there is any confusion about the size and boundaries of your property – or if significant changes have been made to it in recent years.
This is nothing to be concerned about. Property Surveyors are highly trained and licensed. In Canada, Professional Surveyors Canada (PSC) represents the profession nationally, and most provinces have their own professional associations.
Before getting a new land survey, make sure you don’t already have one. Hopefully, you’ve stored the paperwork that relates to the purchase of your home. Look through it. A valid land survey might be right there.
It is smart to get your Real Property Report with compliance before your home hits the market. This allows time to correct and issues that may arise getting compliance from the City.
If you have questions about land surveys, call today.