Stay ahead of everyone else by following our Monthly Market Snapshot of the Calgary Real Estate Market This shows what’s really happening! The market is driven by supply and demand so here we show the inventory (supply) and sales (demand) and most importantly the relationship between the two and how it affects the price of Calgary Real Estate. A simple way to keep up to date with how the market is trending and to stay ahead of most! All numbers are taken from the Calgary Real Estate Boards Stats package for Realtors. I have also included some general comments which are simply my opinion.
Absorption Rate (Months of Inventory) (the inventory divided by the number of sales in the last month). What does this mean you might ask?
| Buyer’s Market | >4.0 | Drives prices down |
| Balanced Market | Between 2.4 to 4.0 | Prices typically remain stable |
| Seller’s Market | <2.4 | Drives prices up |
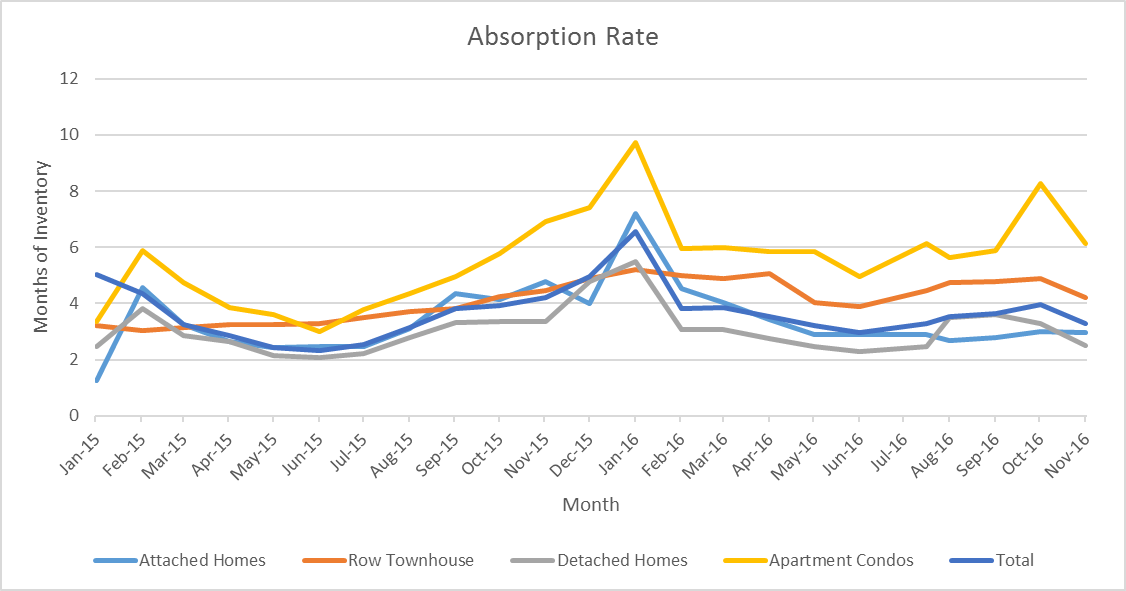
*** Absorption Rate***
The absorption rate for all categories decreased this month. I believe this is because we saw a spike in sales due to people entering the market before the mortgage rules changed. It should be interesting to see our stats for next month once the new rules have been in place for a while.
Absorption Rate Cont.
| July 2016 | August 2016 | Change | |
| Detached | 2.99 | 2.49 | -0.50 |
| Semi Detached | 3.30 | 2.96 | -0.34 |
| Attached – Row | 4.88 | 4.21 | -0.67 |
| Apartment | 8.26 | 6.14 | -2.11 |
| Total City | 3.95 | 3.30 | -0.65 |
Calgary Listing Inventory
October Inventory levels decreased in all categories. I believe that the change is due to increased sales and a normal amount of new listings. The bottom line is there are less Calgary Homes and Condos for sale than last month.
| Inventory | July 2016 | August 2016 | Change |
| Detached | 2823 | 2565 | -258 |
| Semi Detached | 515 | 486 | -29 |
| Attached – Row | 888 | 834 | -54 |
| Apartment | 1651 | 1542 | -109 |
| Total City | 5877 | 5427 | -450 |
Calgary Sales:
Sales in all categories increased this month. Again I believe that the new mortgage rules are 100% responsible for this increase. For many people if they did not buy before the changes they would simply not be able to qualify so this created a sense of urgency for buyers. Note that apartment condos saw the largest increase (25.5%) which was needed in this sector.
| Calgary Sales | July 2016 | August 2016 | Change | % Change |
| Detached | 945 | 1031 | 86 | 9.10% |
| Semi Detached | 156 | 164 | 8 | 5.13% |
| Attached – Row | 182 | 198 | 16 | 8.79% |
| Apartment | 200 | 251 | 51 | 25.50% |
| Total City | 1488 | 1644 | 156 | 10.48% |
Calgary Real Estate Sales Prices:
All categories showed a slight decrease in prices this month. Typically you will see a direct correlation between the absorption rate and prices – this month that is not the case and I believe it is again caused by the government rule changes and everyone trying to figure out what the market might look like next month. Attached – row houses (townhouses) saw the largest decrease even though apartment condos have the highest absorption rate.
| Sales Prices | July 2016 Benchmark Price | August 2016
Benchmark Price |
Change |
| Detached | 503,400 | 502,200 | -1,200 |
| Semi Detached | 386,500 | 386,500 | 0 |
| Attached – Row | 311,100 | 308,100 | -3,000 |
| Apartment | 274,700 | 273,800 | -900 |
| Total City | 440,400 | 438,900 | -1,500 |
Sales Prices “Year to Date”
Year to date prices
| Sales Prices | Dec 31, 2015 Benchmark Price | August 2016 Benchmark Price | Change
$ |
% Change |
| Detached | 514100 | 502,200 | -11,900 | -2.31% |
| Semi Detached | 393100 | 386,500 | -6,600 | -1.68% |
| Attached – Row | 318500 | 308,100 | -10,400 | -3.27% |
| Apartment | 288,000 | 273,800 | -14,200 | -4.93% |
| Total City | 452800 | 438,900 | -13,900 | -3.07% |
Community Variations
**Please note that these numbers do change on a community basis and more so for towns. This report does not include rural properties. If you would like to find stats on your community just let me know. If you have any questions about this summary or Real Estate questions please feel free to contact us.