What is really happening in the Calgary Real Estate Market?
The market is a result of Supply and Demand therefore we look at both Supply (inventory) and Demand (Sales) and the relationship between the two. We also update you on the current benchmark price for all housing sectors.
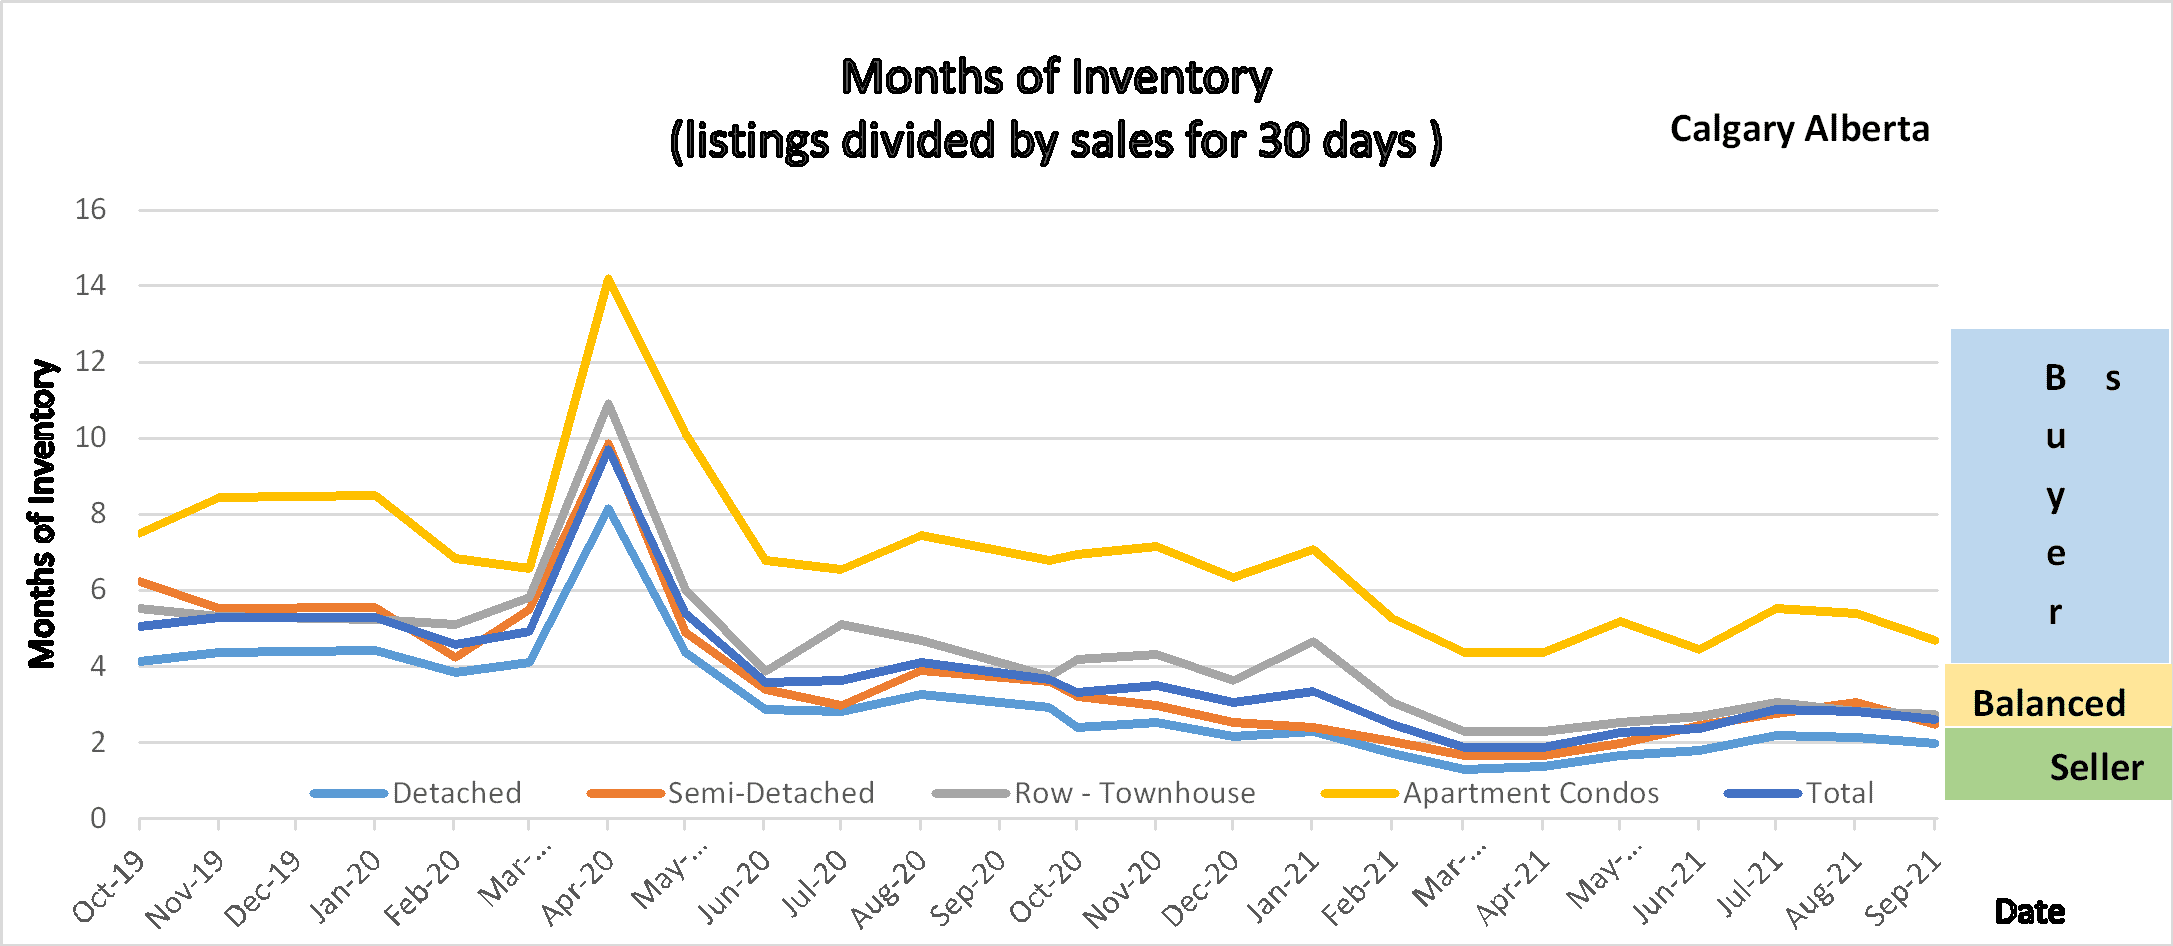
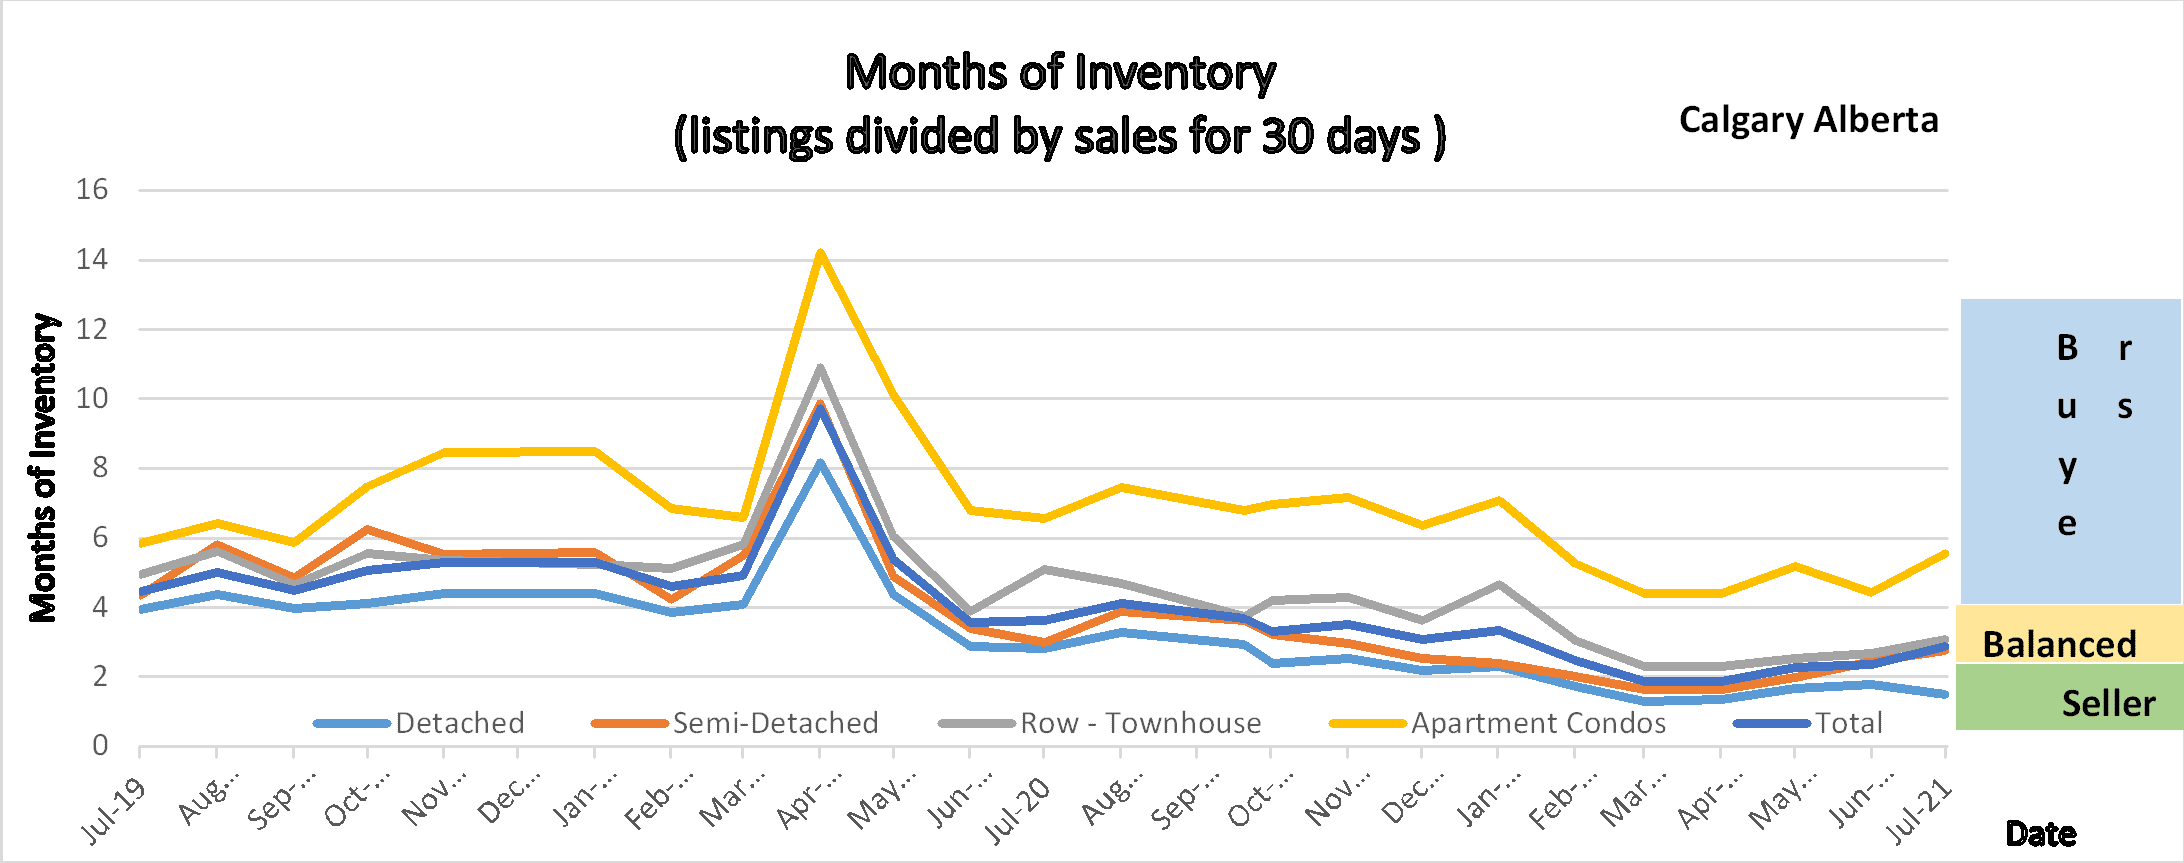
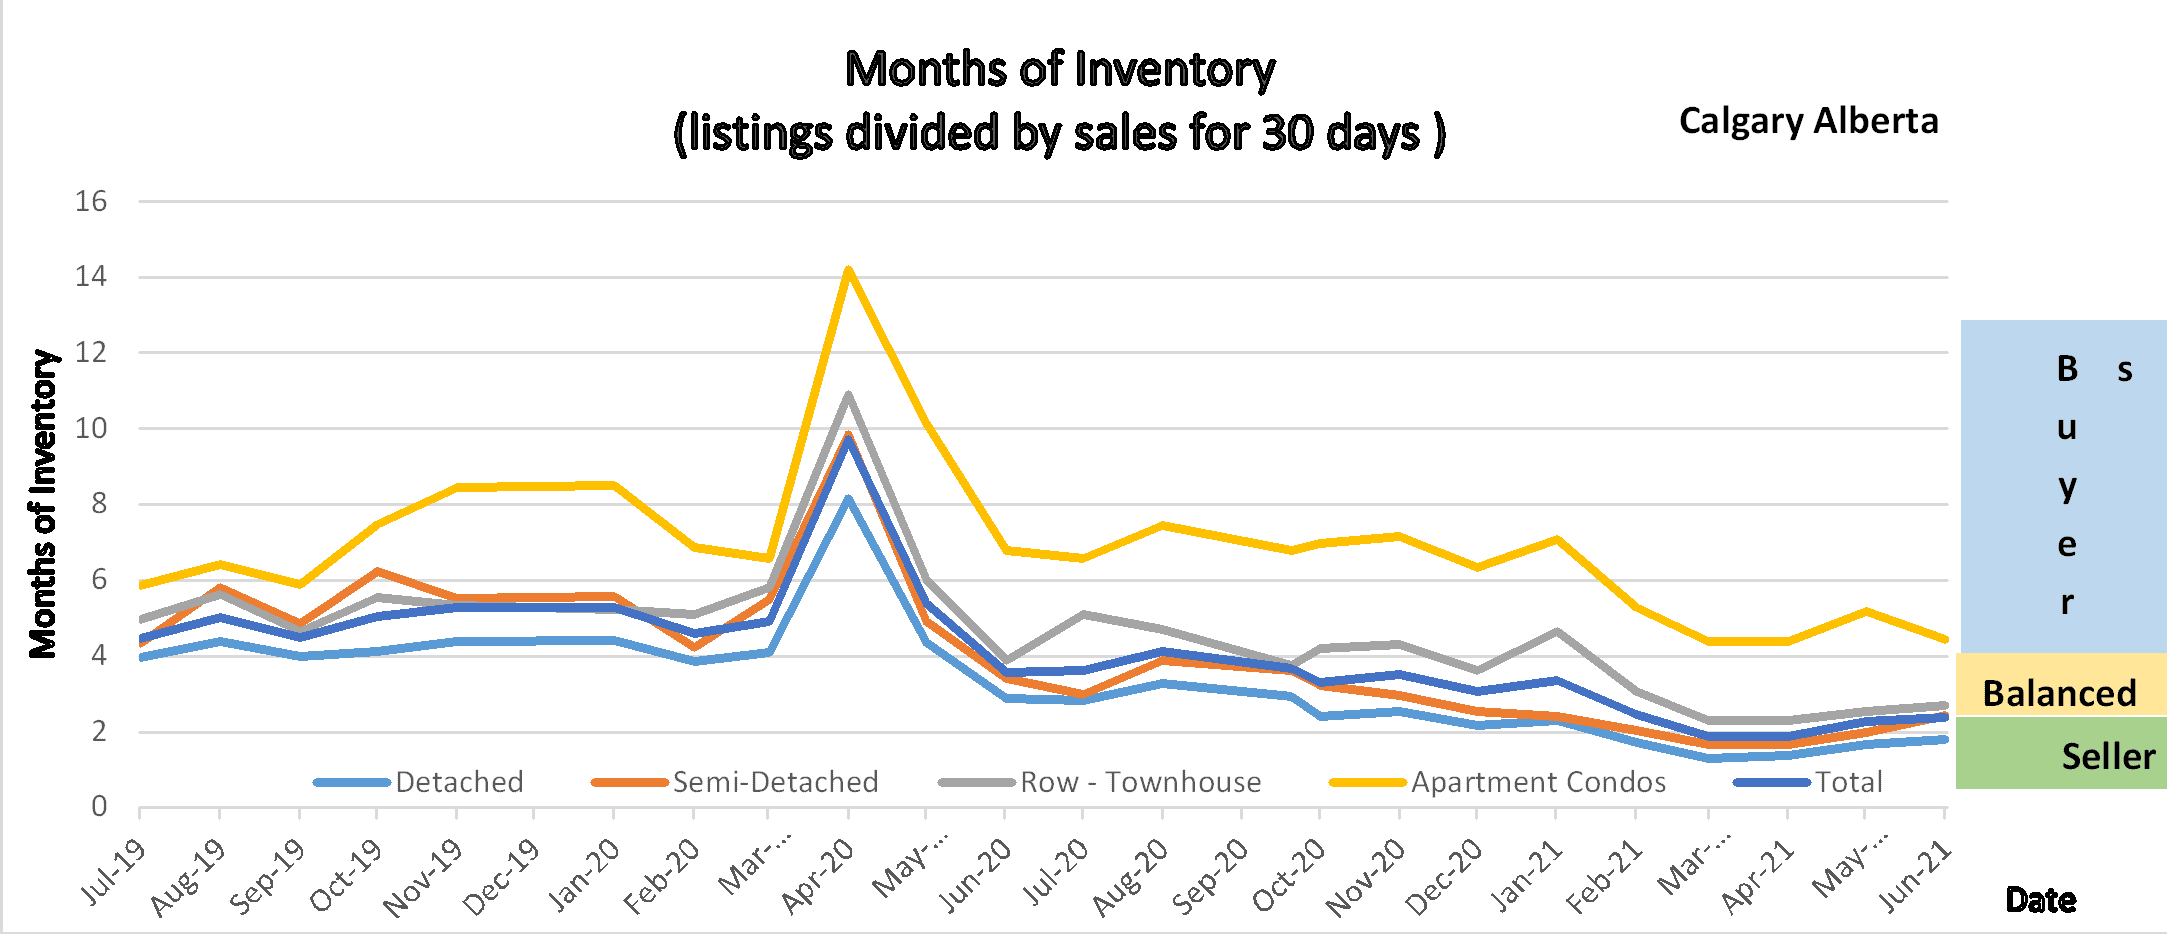
Following is a graph that shows the months of inventory for each housing sector. Looking at a 2-year trendline gives you an indication of where things are really heading.
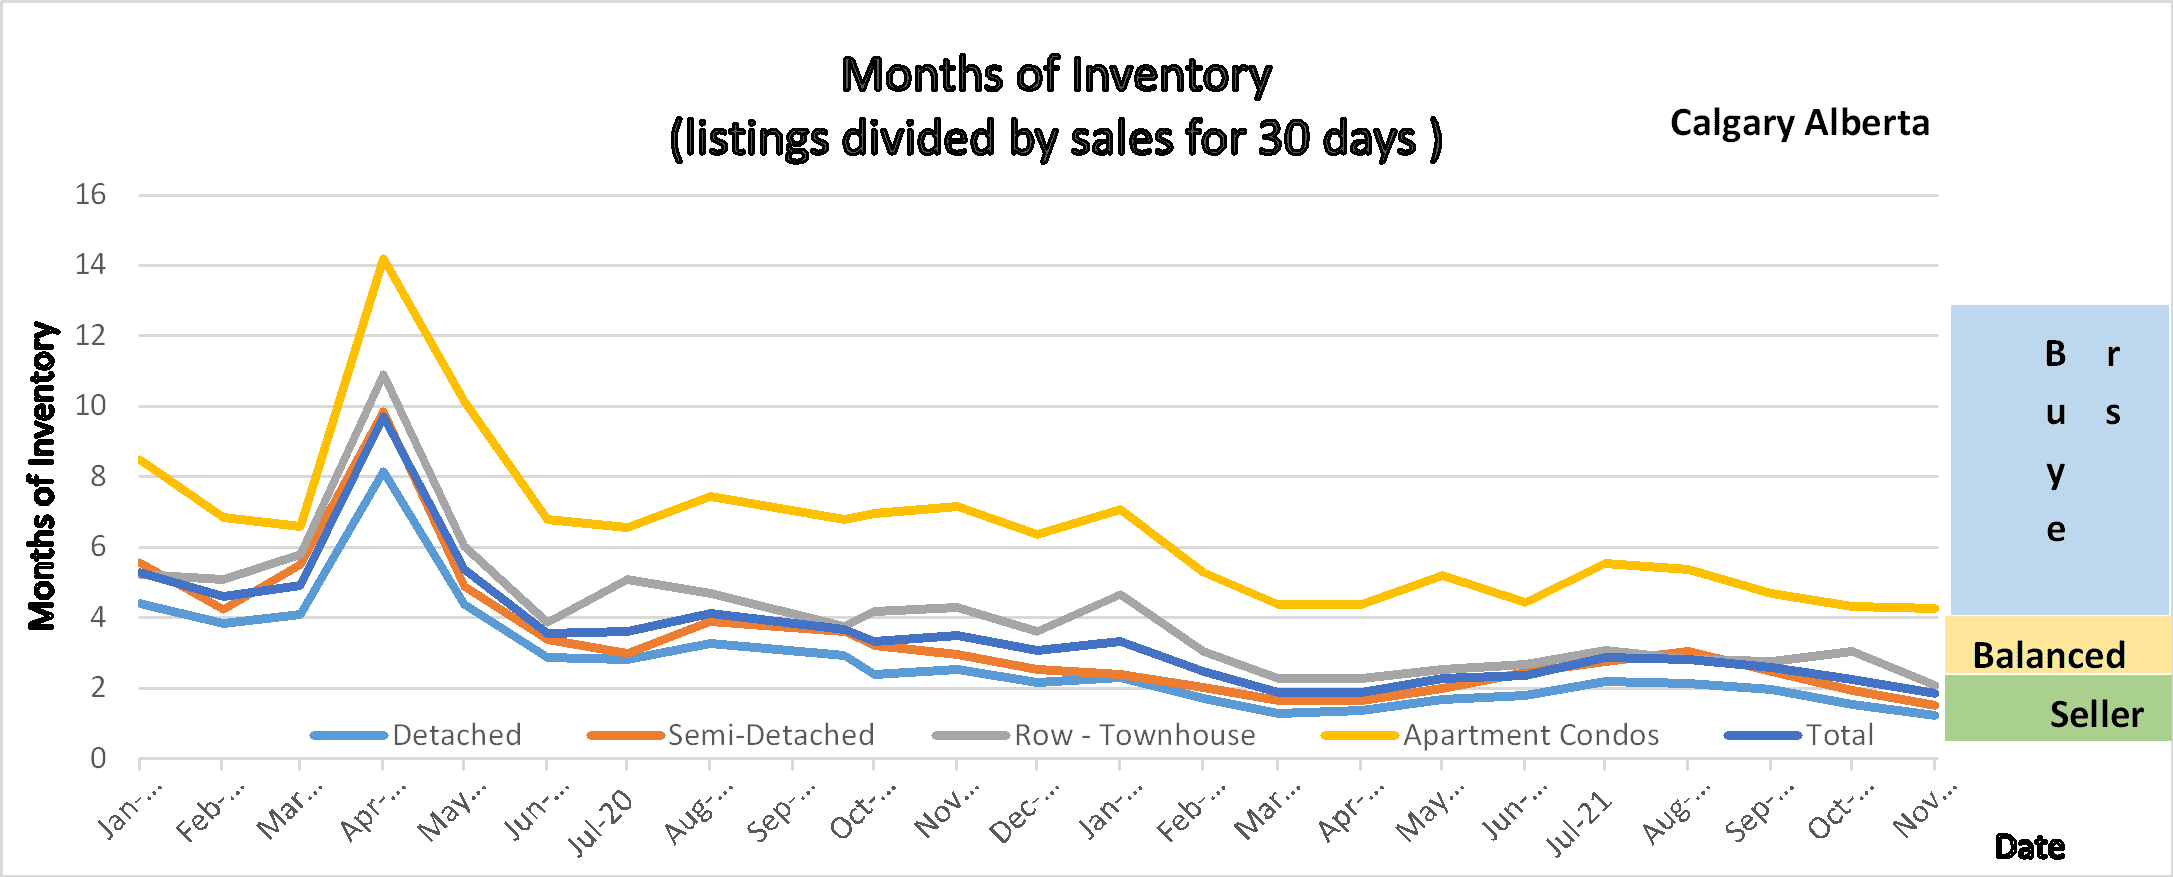
Months of Inventory for the Calgary Real Estate Board
Gord’s commentary for the month (just my opinion).
Typically, we see a steady decline in sales from October through December, and then once we hit mid-January sales start to increase again and peak around June. This year is far from typical. Sales are booming and our Inventory is decreasing pushing us into an even stronger Seller’s Market. It has to the point (in the detached home sector) where if a new listing is priced at market value there will be competing offers and it will sell in the same day, typically above list price. It is common to see 6-10 offers on homes.
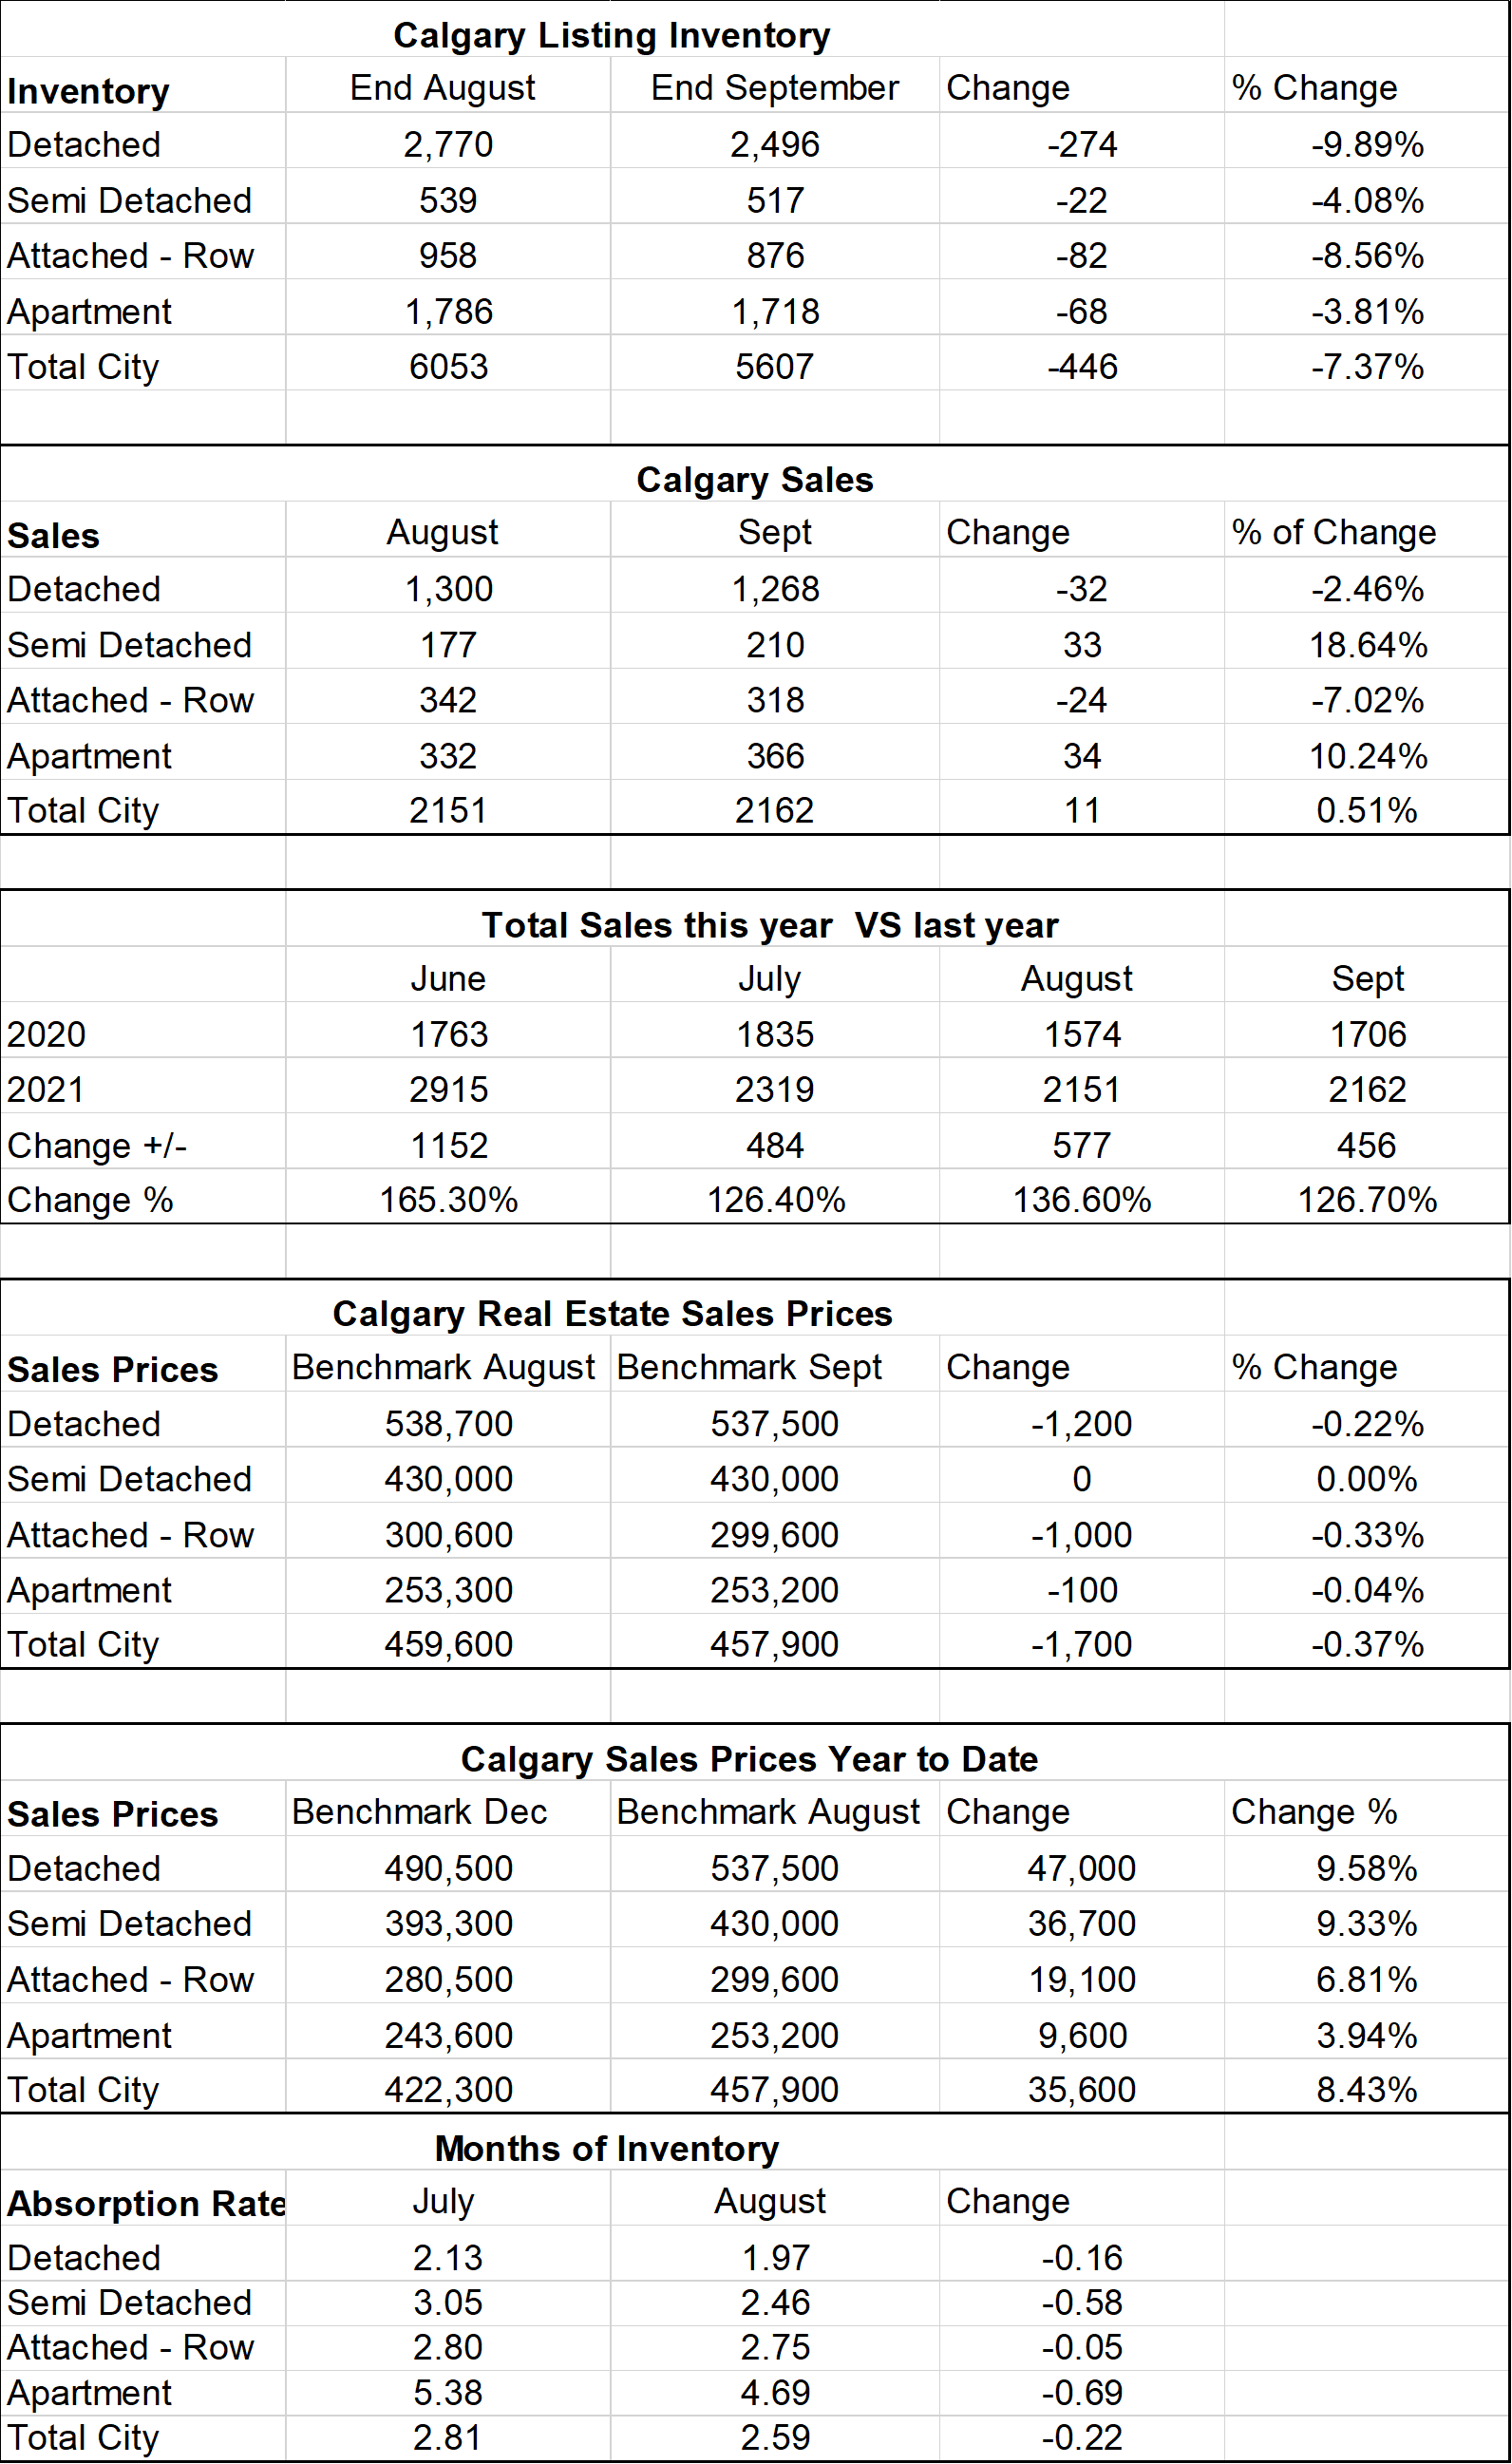
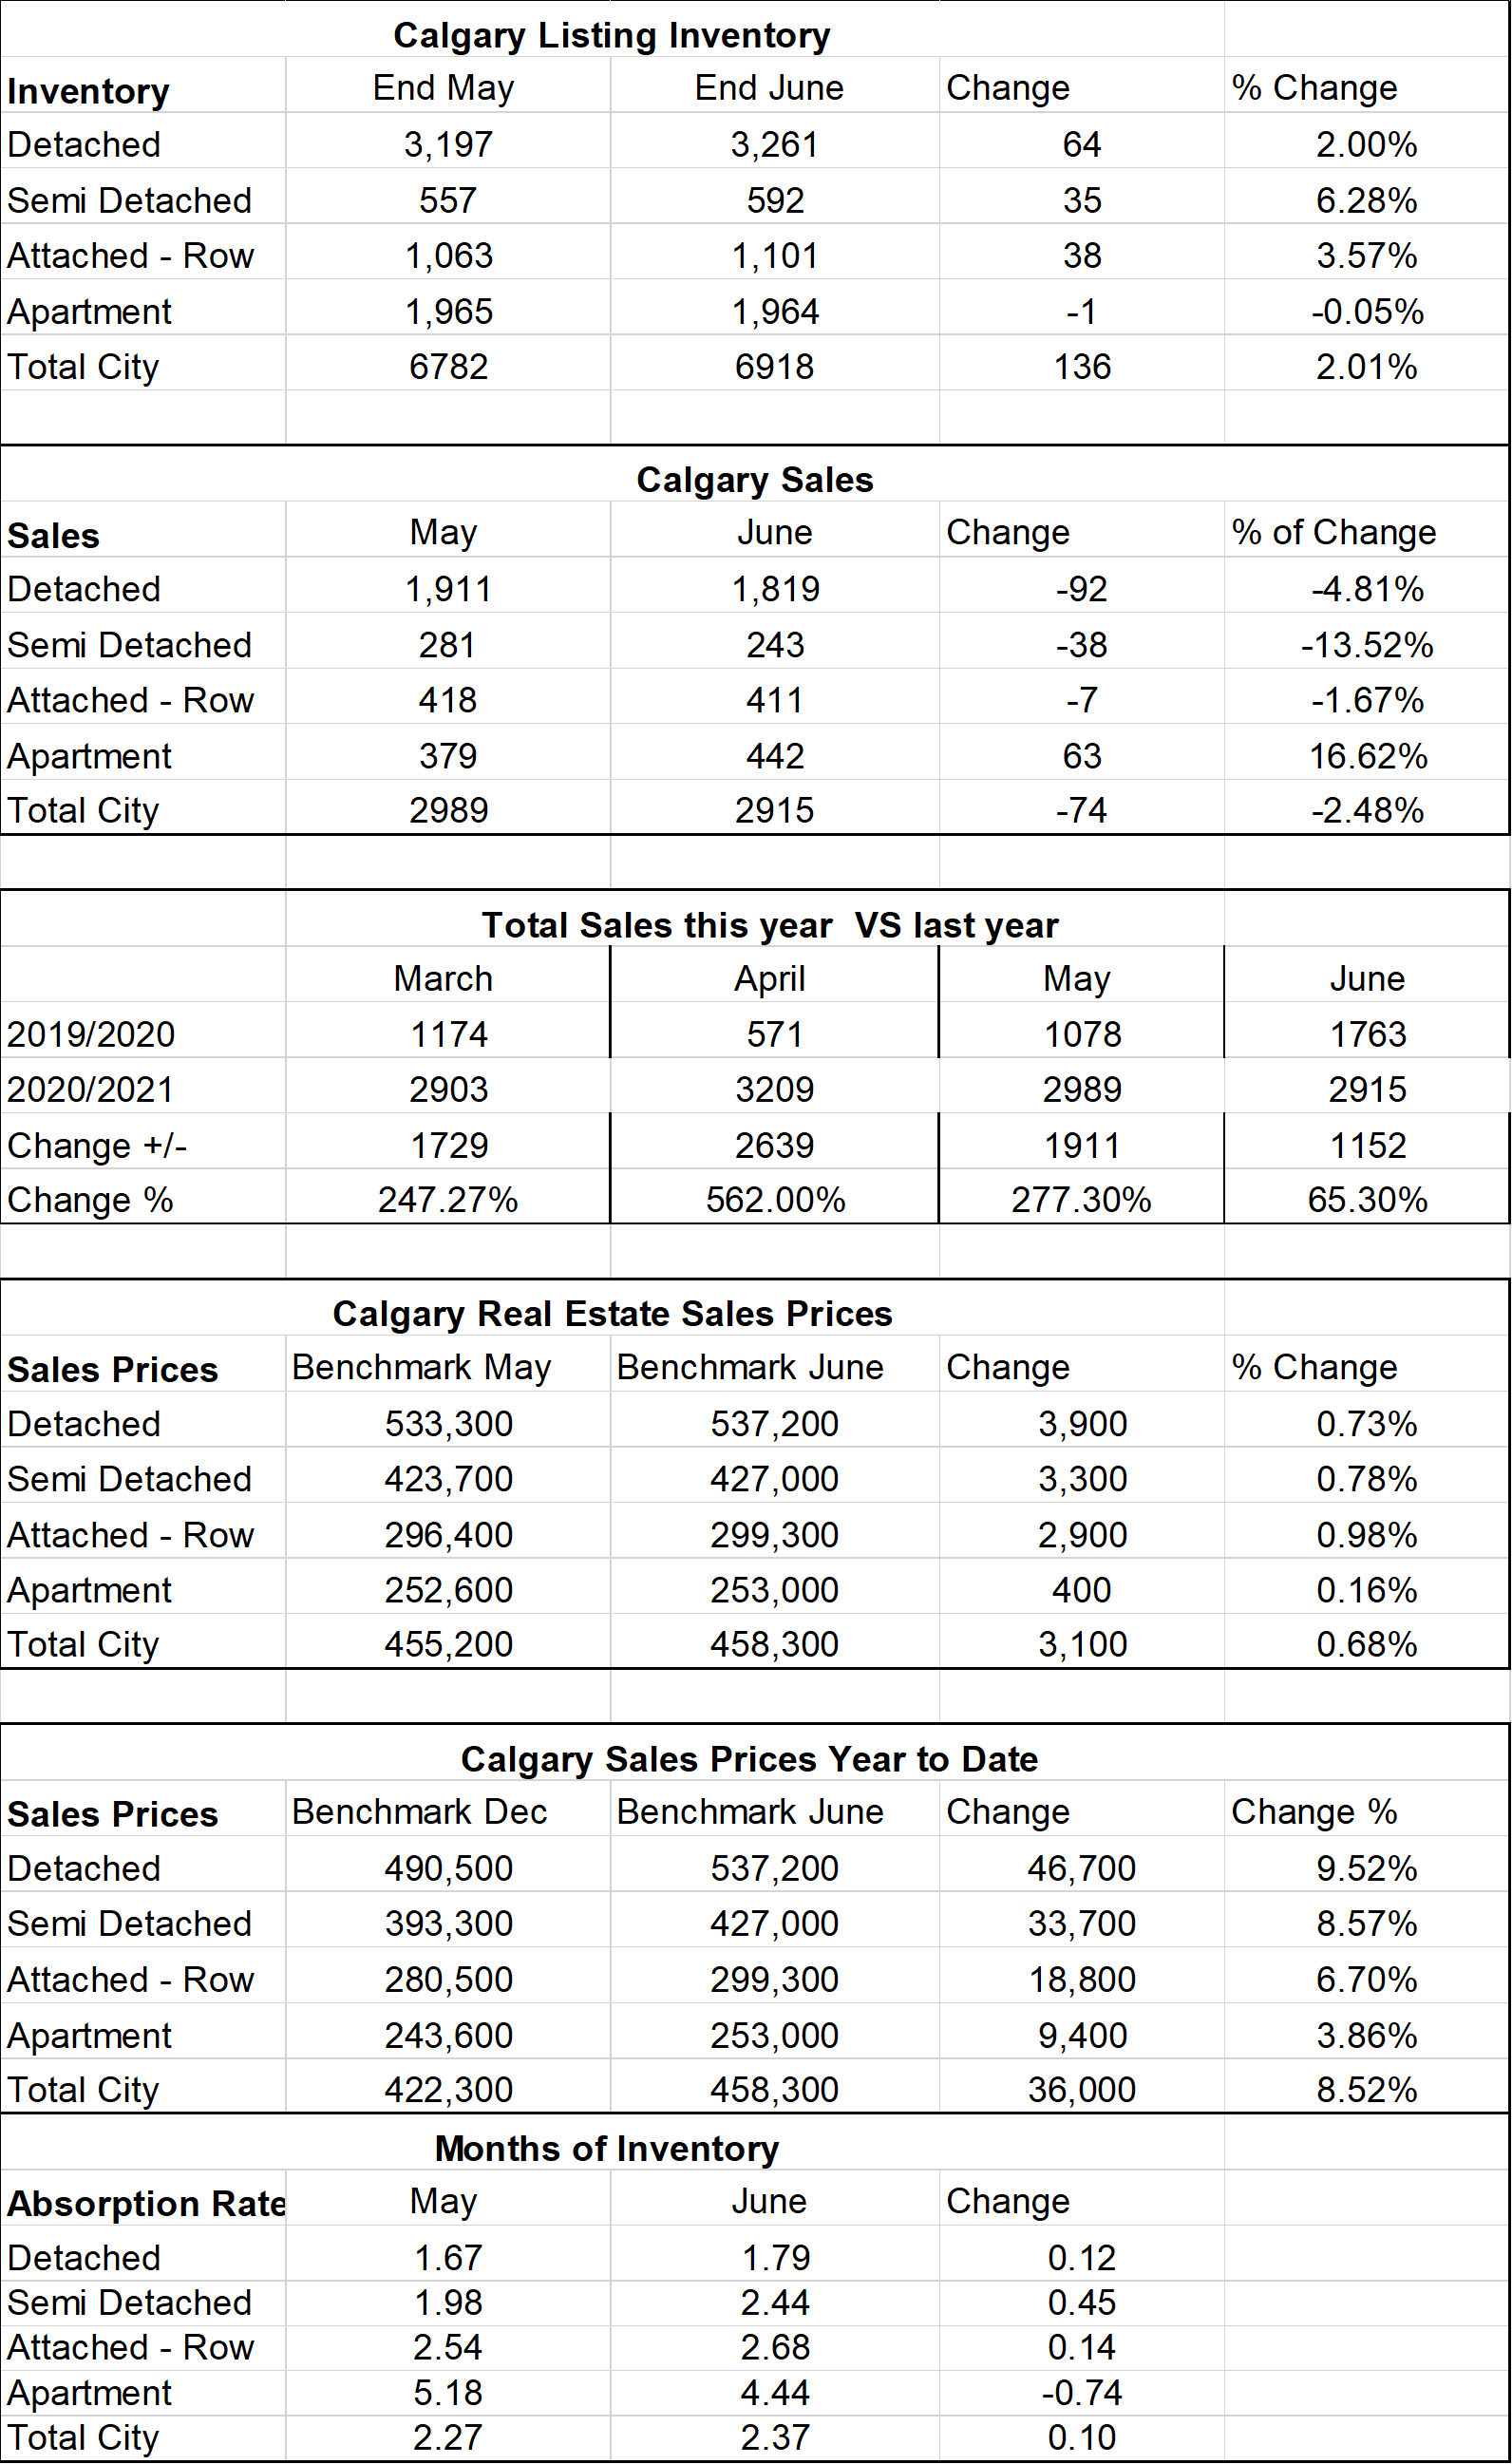
Calgary Listing Inventory
Listing inventory in all sectors declined again this month. Detached homes showed the largest decline of 537 listings with a total decline in inventory of 948 listings in all sectors. This works out to a decrease in inventory of 19.47%. Seeing a decline in inventory is quite typical of this time of year but the decline this year is higher. Last year our decline was 733 in November.
Calgary Sales:
Sales in all sectors (except Attached Row Homes) were down slightly from last month by a total of seventy-six sales less. Attached Row homes sales increased by fifty sales. To put this in perspective sales in November were 146.7% of sales from last November so a large increase. What makes this interesting is that if we had more inventory our sales would be higher as there are many buyers out there who are trying but have not successfully bought a home due to the lack of supply.
Sales Compared to 2020:
As you can see below October 2021 Sales were higher than October 2020. As noted above this is due to pent up demand and a lack of supply making people search longer to find their home. The other factor here is people taking advantage of the low-interest rates.
| Jan | Feb | Mar | Apr | May | June | |
| 2020 | 861 | 1190 | 1175 | 573 | 1080 | 1763 |
| 2021 | 1208 | 1836 | 2903 | 3209 | 2989 | 2915 |
| Change | +347 | +646 | +1729 | +2639 | 1,911 | 1,152 |
| % Change | +7.49 | +54.4 | 247% | +562% | 277.3% | 165.3% |
| July | Aug | Sept | Oct | Nov | Dec | |
| 2020 | 1835 | 1574 | 1702 | 1763 | 1438 | 1199 |
| 2021 | 2319 | 2151 | 2162 | 2186 | 2110 | |
| Change | +484 | +577 | +456 | + 423 | +672 | |
| % Change | 126.4% | 136.6% | 126.7% | 123.9% | 146.7% |
Calgary Real Estate Benchmark Sales Prices:
Overall, the benchmark price increased for the Detached and Semi-Detached Sectors while the Townhouse and Apartment Condo sectors saw a small decline this month ((see chartbelow). With the Months of Inventory where it is I anticipate further price increases in the coming months.
Calgary Real Estate Benchmark Year to Date Sales Price: See chart below.
Year to date every sector has seen an increase in the Benchmark price. Overall we are at a 9.16% increase so far and I anticipate further gains this month.
Current Months of Inventory (Absorption Rate):
The Months of inventory decreased in all sectors this month. As of today, here is where we sit:
Sellers Market: Detached, Semi-Detached, and Attached- Rowhomes
Buyers Market: Apartment Condos
Overall, we are in a Sellers’s Market.
It is also important to note that these numbers vary by community, and by price range. If you would like numbers for your community, or more specific numbers for your home please contact us.
Below is a summary of numbers in chart form. All numbers are taken from the Calgary Real Estate Boards monthly Stats package.
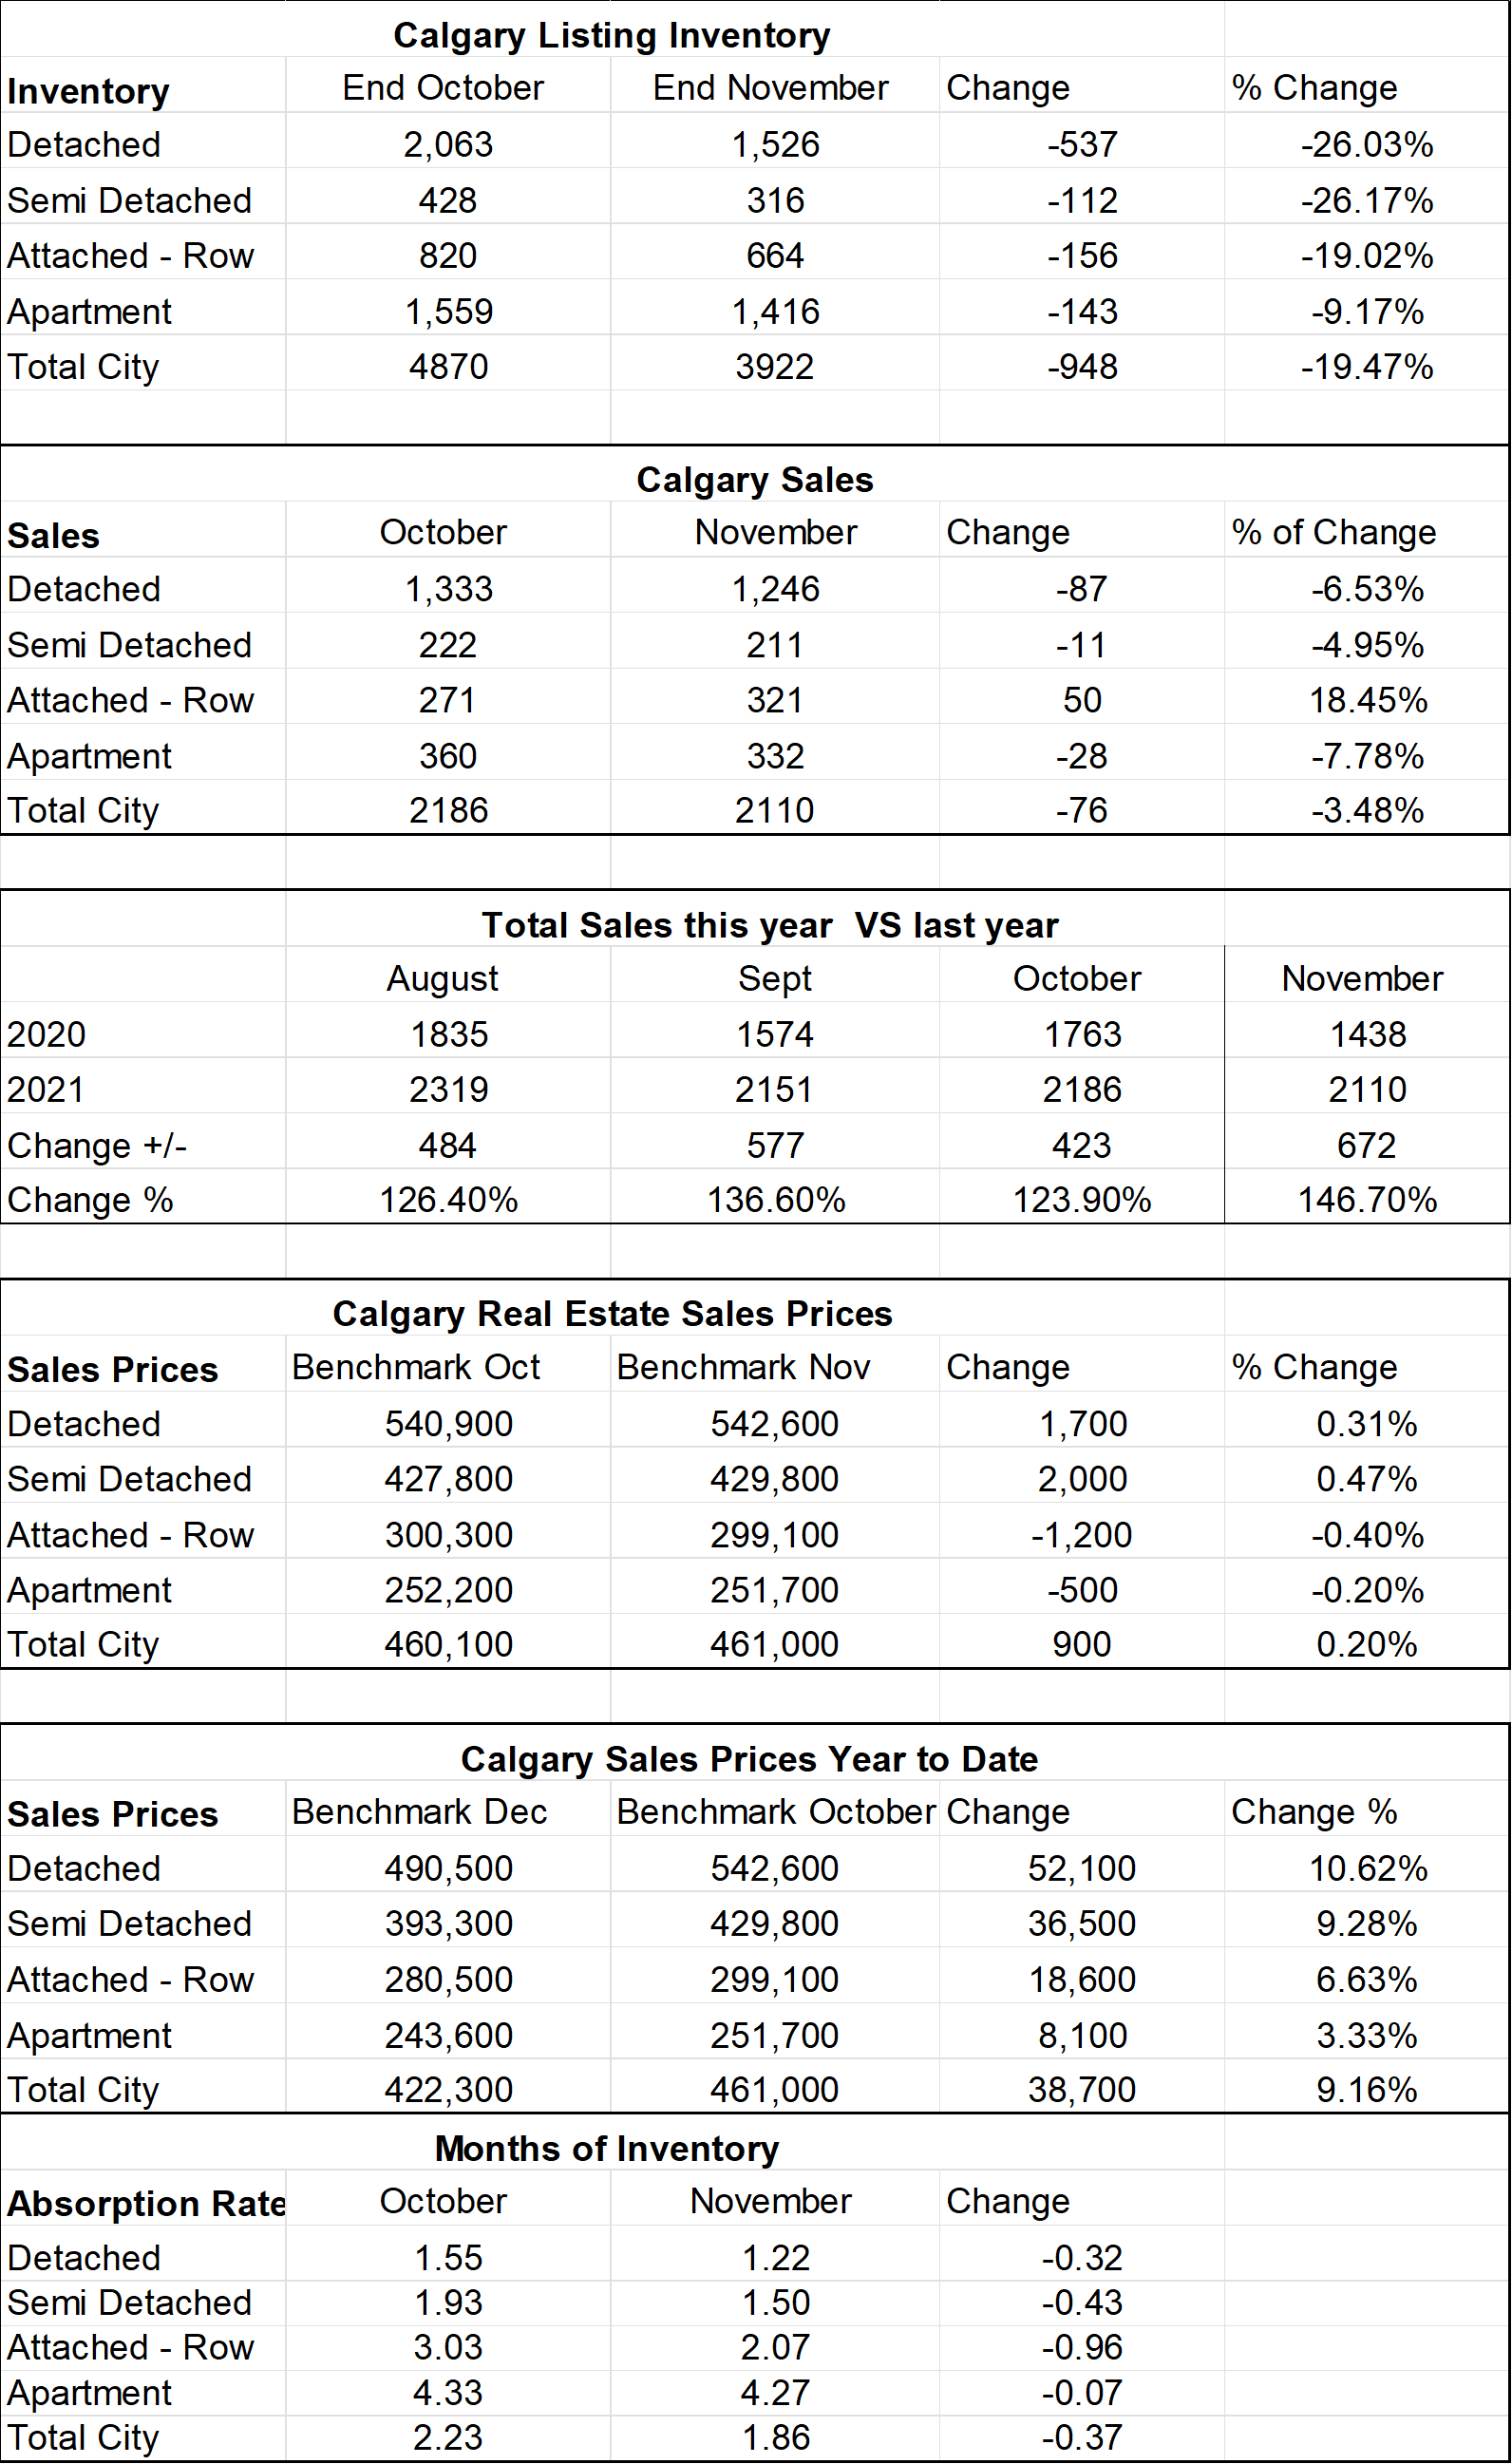
This photo shows Key Numbers from the Calgary Real Estate Board including sales, inventory, and Benchmark Price for each sector of the market.